
Stocks & Equities

In this week’s issue:
- Weekly Commentary
- Strategy of the Week
- Stocks That Meet The Featured Strategy
In This Week’s Issue:
– Stockscores’ Market Minutes Video – Process Maps
– Stockscores Trader Training – Market Cycles
– Stock Features of the Week – Good Dogs
Stockscores Market Minutes Video – Process Maps
Applying your trading strategies effectively requires a well thought out and repeatable process. Drawing out a process map can help you be more effective and profitable as a trader. That plus my weekly market commentary.Click Here to Watch To get instant updates when I upload a new video, subscribe to the Stockscores Youtube Channel.
Trader Training – Market Cycles
I don’t believe you can apply the same investment strategy through all market conditions and be successful. As conditions change, so too should the way you trade the market. Stocks and markets have a life cycle and adapting your approach to where in the cycle they are will improve the performance of your portfolio. Here are 8 phases that we tend to see stocks go through in their stock market cycle:
Phase 1 – Parking Lot
In the Parking Lot phase the stock will go sideways without a significant trend, remaining above long term support but also below long term resistance. As rising bottoms begin to form on the chart, accumulation begins as investors grow optimistic. During the latter part of this phase, the Stockscores Optimistic Consolidations strategy will work well at anticipating a breakout through resistance. The Sentiment Stockscore will tend to languish aimlessly between 40 and 60.
Phase 2 – Smart Money
Those who know most about the company are buying the stock on the break through long term resistance. Typically, the breakout through resistance will come with abnormal price and volume activity. The Stockscores Simple and Longterm Breakout Strategies will identify stocks at this most profitable phase. The uptrend will usually start slow and a pull back to support after the breakout often occurs. The general public are not big buyers of the stock during this phase. During this phase the Sentiment Stockscore will cross above 60 and the Signal Stockscore will break above 80 on days when abnormal trading activity signals accumulation by the smart money.
Phase 3 – Pull Back
As the stock’s price rises myopic investors will take profits, causing three to five day pull backs from the high. This sets up the Stockscores swing trading strategy, Pull Back Plays. When the short term profit taking appears to be over smart bargain hunters buy shares in anticipation of a bounce back in favor of the longer term upward trend. As the trend continues higher, more and more retail investors take ownership of the company’s shares as the Smart Money phase buyers begin to distribute their holdings. The Sentiment Stockscore will usually remain well above 60 during this phase although the Signal Stockscore may pull back below 70.
Phase 4 – Change of Control
In an upward trend, the buyers are in control of the market. As prices climb higher, buyers lose their enthusiasm for the stock and the sellers are able to take back control. This brings an abnormal move to the downside that breaks the upward trend line, a break that is usually accompanied by abnormal volume. This sets up a Stockscores short selling strategy, Breaking Uptrends. The Sentiment Stockscore may be falling but is likely above 60 with the Signal Stockscore now coming below 60.
Phase 5 – Power Cycle
Most stocks don’t get to see Phase 5 where the long term trend shows its true force and breaks the change of control back in favor of the buyers. The medium term downward trend line is broken as the stock works to resume the longer term upward trend. The Stockscores Bottom Fishing strategy will identify these stocks as the Sentiment Stockscore crosses back above 60 and the stock breaks through short term resistance.
Phase 6 – Denial
Normal people avoid pain and hold on to their losers way too long. During the Denial phase the Smart Money investors have typically moved on to other stocks and now the stock is being bought by those in denial of the truth – this stock is a dog. The Sentiment Stockscore is below 60 and the stock is breaking down below longer term support levels as the sellers are clearly in control of the market. The Stockscores Long Term Breakdowns will find stocks in this phase as the Signal Stockscores will often spike down below 20 on important technical breakdown days.
Phase 7 – Pull Ups
Throughout the downtrend bargain hunters who still believe in the company will try to buy stock, thinking they are getting a bargain. Swing traders can take advantage of the longer momentum working in their favor by short selling the stock in to these brief upward price moves that tend to only last about 5 days. The Stockscores Pull Ups strategy will identify stocks that have shown short term strength while longer term weakness prevails. The Sentiment Stockscore will be below 50 but the Signal Stockscore may be able to spike above 60 during this phase.
Phase 8 – Fear
Emotion causes investors to make mistakes. As the stock falls farther and farther investors feel more and more fear until they can not take the pain any more and sell the stock in disgust. As the stock approaches long term support it is often a bargain fundamentally and well informed investors will buy the stock at a bargain. As fear culminates in irrational selling, the stock is able to bounce off of long term support for a brief but often profitable trade. The Sentiment Stockscore will usually be below 20 but the stock will approach long term support levels that held up as a boundary on the trading range during the parking lot phase.
Keep these phases in mind when you look at any stock or market and use this long term cycle analysis to determine the appropriate Stockscores trading strategy.

Lately, many of the top performing, short term trades, have been in stocks that have pretty ugly looking charts. These are dogs that no one likes but, with some positive fundamental change, there is a quick rush to own them. When stocks are able to attract buyers against a lot of pessimism, they often make sharp, short term gains. This week, I highlight a couple of dogs that I have bought today. I don’t intend to hold them long, just enjoy the moment when these dogs get some attention.
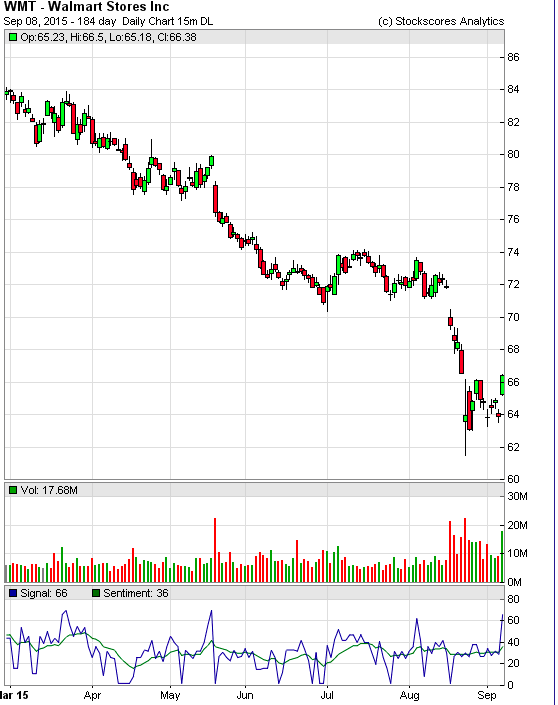
1. WMT
WMT has been in a parabolic sell off lately but the buyers came back to it today. I expect it will rally back up to its long term downward trend line, somewhere around $70.
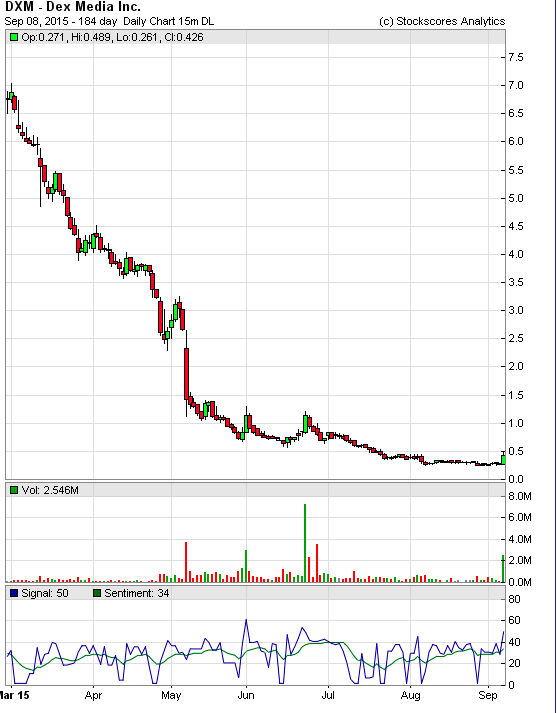
2. DXM
Shareholders of DXM have suffered miserably in 2015, the stock started the year over $8 and is now in the $0.40 range. Something has caught buyer interest today, however, as it is trading a lot more volume than normal and is up over 50% at the time I am writing it. I picked up this morning with the thought that it could rally back to $1 in the near term.
References
- Get the Stockscore on any of over 20,000 North American stocks.
- Background on the theories used by Stockscores.
- Strategies that can help you find new opportunities.
- Scan the market using extensive filter criteria.
- Build a portfolio of stocks and view a slide show of their charts.
- See which sectors are leading the market, and their components.
Disclaimer
This is not an investment advisory, and should not be used to make investment decisions. Information in Stockscores Perspectives is often opinionated and should be considered for information purposes only. No stock exchange anywhere has approved or disapproved of the information contained herein. There is no express or implied solicitation to buy or sell securities. The writers and editors of Perspectives may have positions in the stocks discussed above and may trade in the stocks mentioned. Don’t consider buying or selling any stock without conducting your own due diligenc

Morgan Stanley has issued a “full house” buy alert on international stock markets for the first time since early 2009, effectively calling the bottom of this summer’s equity slump.
The investment bank reportedly told customers that all five of its market-timing signals are flashing a buy signal in sync with panic selling earlier this week that reached capitulation levels. This occurs very rarely, the bank said, and is a condition that typically leads to a V-shaped recovery which delivers a 23% average gain in stock prices over the following 12 months.
It’s interesting that the signal has emerged in sync with my own Tech Trend Trader market assessment model going long for the first time this year on Tuesday.
Graham Secker, Morgan Stanley’s chief European equity strategist, said the selloff over recent weeks is largely driven by emotion and has little to do with the underlying outlook for the world economy.
The trailing dividend yield on stocks — measured by the MSCI Europe index — is currently 2.4 percentage points above the yield on a mix of European government bonds, near its all-time highs of the past century, the bank reported. Such levels usually precede powerful equity rallies, it said.
Morgan Stanley’s bold call has raised eyebrows since the bank caught the exact top of the European equity market in June 2007 using the same timing indicators, on that occasion issuing a “full house” sell alert.

The big call comes at a treacherous time for global investors as they try to figure out what the heck is really happening in China and prepare for a rate hike campaign in the United States, the first in nine years. That is going to hurt debtors in emerging markets with $4.5 trillion in U.S. dollar liabilities, the bank noted.
These kinds of indicators basically suggest that the risk-reward balance is tilted more toward stocks than bonds, and securities of all types over cash.
Secker added that the bank senses the current mood has echoes of 1998 during the East Asia crisis and the Russian default, when there was a nasty squall in the markets but it proved to be a false alarm for the global economy, in part due to three back-to-back rate cuts by the Fed.
The five timing tools in the MS algorithm are valuation, fundamentals, risk, capitulation, and a combined market indicator. Between them they capture mutual fund flows, market breadth and technical momentum measures such as the rate of change, as well as price-to-earnings ratios, dividend yields and their relationship to bonds.
Morgan Stanley said the best way to invest in the rebound would be through eurozone bank stocks because they will benefit from quantitative easing and loose-money policies by the European Central Bank. You can do this through a single fund, the iShares MSCI Europe Financial Sector (EUFN). The bank also predicted Italy would be the star country over the next two years as it benefits from dramatic reforms. The fund for that is iShares Italy (EWI).
Buona fortuna!
Jon Markman
Published after close 02/09/15 –
US equities rallied today. Our benchmark S&P 500, which had slipped back into the correction zone (a 10% decline), opened higher and surged above that -10% stigma. By the noon hour it had given back over half its gains but then recovered to the vicinity of its opening rally shortly after the lunch hour. Some buying in the final 15 minutes took the index to its 1.83% closing gain just a few ticks from its intraday high.
The yield on the 10-year note closed at 2.20%, up 3 bps from yesterday’s close.
Here is a snapshot of past five sessions.
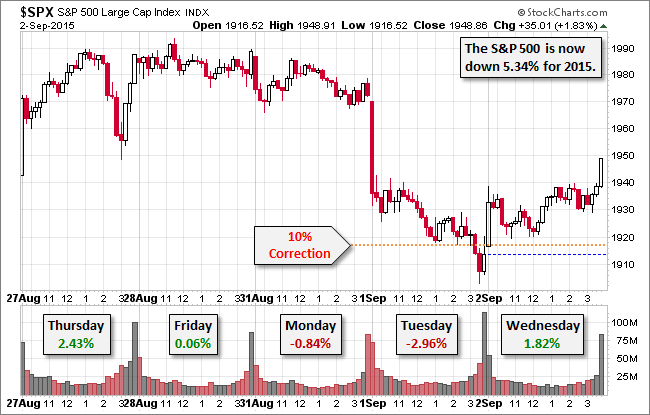
On a daily chart of the SPY ETF we see that volume on today’s gain was unremarkable and well below most of the levels during the recent selloff. It will be interesting to see if today’s advance triggers more participation tomorrow.
Is it over? Will the stock market now make a beeline back to the highs, then on to new record highs?
Not yet! The long-awaited correction, according to my models, is far from over. Yes, we may see the dust settle for a few more days. We may even see more strong spikes higher.
But my work tells me there is much danger on the horizon, and the Dow Industrials have not yet bottomed. Not even close. Nor have the other major indices such as the Dow Transports, the S&P 500, the Nasdaq.
Nor has Europe bottomed. Or Asia.
So don’t be deceived if you see some rallies. Don’t let your stockbroker load you up on stocks, of any kind.
Instead, mark my words: The time to buy is not yet here. In the weeks ahead, you will see …
– The Dow Industrials plummet as low as 13,937
– The NASDAQ as low as 3,162
– The S&P 500 as low as 1,710
How sure am I? In this business, it’s a rare exception when someone can be 100% sure.
But if I had to rate the odds of new lows ahead for stocks, I’d say they’re better than 90%.
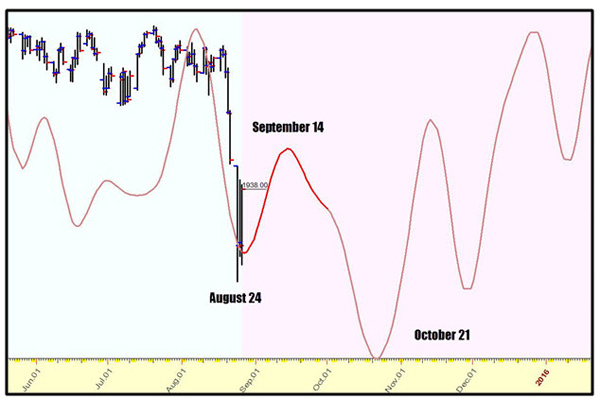
FIRST, is this cycle forecast chart for the Dow Industrials. It’s the type of cycle forecast I frequently show members of my Supercycle Trader, who actively speculate in the markets per my specifically chosen and timed recommendations.
And who also just bagged a sweet 121% gain on a bearish position in stocks, more than doubling their money, in just one week!
As you can see from this chart, which is based on billions of calculations of stock market data via an artificial intelligence model or neural net …
After a brief stabilizing period and bounce (red line) into the middle of this month, the stock market is likely to nosedive into the third week of October.
That low can come in as low as 13,937 in the Dow.
SECOND, is Europe. My models show similar patterns for virtually all stock markets in Europe. Some stabilization and a possible bounce into the middle of this month, then a collapse.
Moreover, Europe’s economic data is far worse than the lackluster data on the U.S. economy. Deflation is worsening in Europe. Industrial production is sliding. Consumer confidence is near lows.
And all the policies that have made Europe such a basket case in the first place — including a hair brained single currency experiment — continue to squeeze the European Union as if it were in a vice with a one way screw that can only be further tightened by insane leaders.
THIRD, is Asia. Long-term, Asia, including China, is fine. But my work tells me the markets there too have not yet bottomed. But keep an eye on them, for when they do bottom — especially China — they will likely bottom ahead of Western markets.
Why? Because in a very real sense today, Asia — especially China — leads the world.
They used to say when the U.S. sneezed, the rest of the world caught a cold. Now it’s the other way around: When China sneezes, the rest of the world gets pneumonia.
There are many more reasons why I believe stock markets have not yet bottomed.
So here’s what I strongly suggest:
A. If you own any stocks, with the exception of specifically selected ones you plan to own longer-term, just get out. If you cannot get out, then hedge your holdings via an inverse ETF such as the ProShares Short Dow30, symbol DOG.
B. Do not — I repeat — do not go bottom fishing. In any sector. It makes no sense to bottom fish stocks that have already lost, say 30% or more, when they can easily lose another 30% or more.
Instead …
C. Build your cash so that you can deploy it at the right time, near or at the bottom of the correction …
Fully keeping in mind that the long-term bull market in stocks is still intact — and that over the next couple of years the Dow Industrials can easily stage a slingshot move back up and more than double to over 31,000. Ditto for other major U.S. broad market indices.
And all on the backbone of frightened capital rushing out of the collapsing cancerous debts of the doomed-to-fail Western socialist-style economies of Europe and Japan.
Washington will collapse too, but not for a couple of years. So make hay of it while you can, just like my Supercycle Trader members are starting to do.
Best wishes,
Larry

Summary
- The biotech sector has been extremely weak to begin this week and a lot of investors are asking whether this is the start of a larger swoon in this space.
- I don’t have a definitive answer to that question but there are a couple of things I am watching to determine the near-term direction of this sector.
- Below is my game plan as the biotech sector seems to be entering a period of escalating volatility.


-
I know Mike is a very solid investor and respect his opinions very much. So if he says pay attention to this or that - I will.
~ Dale G.
-
I've started managing my own investments so view Michael's site as a one-stop shop from which to get information and perspectives.
~ Dave E.
-
Michael offers easy reading, honest, common sense information that anyone can use in a practical manner.
~ der_al.
-
A sane voice in a scrambled investment world.
~ Ed R.
Inside Edge Pro Contributors

Greg Weldon

Josef Schachter

Tyler Bollhorn

Ryan Irvine

Paul Beattie

Martin Straith

Patrick Ceresna

Mark Leibovit

James Thorne

Victor Adair