
Stocks & Equities
Are you worried about the stock market? You should be; at least according to your local Starbucks barista.
Starbucks CEO Howard Schultz told his 190,000 employees in his daily “Message from Howard” email communication: “Today’s financial market volatility, combined with great political uncertainty both at home and abroad, will undoubtedly have an effect on consumer confidence and … our customers are likely to experience an increased level of anxiety and concern. Let’s be very sensitive to the pressures our customers may be feeling.”
You can’t make this stuff up!
Hey, maybe I shouldn’t be too harsh on Mr. Schultz, because the stock market is in a lot of trouble… and not for the reasons the mass media and Wall Street experts are telling you.
The know-it-alls on CNBC are pointing their fingers at the Chinese stock market meltdown as the reason for our stock market turmoil, but that is just the catalyst… not the root problem.
The source of the meltdown is deeper, more problematic, and more painful. What I’m talking about is that the Federal Reserve—from Greenspan to Bernanke, to Yellen—thought they possessed Wizard of Oz powers to fix whatever ails the economy with their menu of monetary tools.
In 2000, the Fed thought it could solve the bursting of the dot-com bubble with massive interest rate cuts and repeated that playbook again for the 2008-09 Financial Crisis.
And when they ran out of room by cutting interest rates to zero, they trotted out Operation Twist and QE 1, 2, and 3.
Those three rounds of QE added about $3.7 trillion to the Federal Reserve’s balance sheet since 2008, which now totals a mind-boggling
$4.5 trillion.
The problem is not China; the problem is Janet Yellen and her Federal Reserve buddies.

The Fed—beginning with the original monetary Mr. Magoo of Alan Greenspan—created a bubble, then rolled out more of the same to deal with the bursting of the bubble, and like the shampoo bottle says: Rinse, Lather, Repeat.
Zero interest rates plus QE1, QE2, and QE3 created a massive misallocation of capital that has affected everything from home supply, ocean-going freighters, the US dollar, and wages, and pushed stock prices to a bigger-than-ever bubble.
The recent weakness is the painful process of deflating that bubble, but the Federal Reserve refuses to learn from its mistakes. It won’t be long until we hear about QE4 and/or a delay to the overpromised interest rate liftoff.
Former US Treasury Secretary Larry Summers had this to say yesterday: “A reasonable assessment of current conditions suggests that raising rates in the near future would be a serious error that would threaten all three of the Fed’s major objectives; price stability, full employment and financial stability.”
Honestly, I don’t know what the Federal Reserve will do next. Heck, I bet they don’t know what to do either… but they will do something.
Central bankers are arrogant know-it-alls who think they can fix the world’s financial problems with a couple of pulls of a monetary lever.
So pull they will.
And so the stock market damage will continue, albeit with some powerful up moves along the way.
Bulls, whether in a Spanish bull-fighting arena or roaming the floor of the NYSE, are a tough animal to kill. They won’t surrender until they make a few more desperate attempts to push the market higher.
Look at what happened last Tuesday after the 588-point Monday meltdown. The Dow Jones Industrial Average shot up by as much as 441 points before ending the day with a 204-point loss.
My point is that you’re going to see a lot of powerful up moves in the coming months… but I’m telling you, these are nothing more than bear market traps to lure you into buying at the wrong time.
The stock market is falling into a bear market, and that means big swings both up and down, similar to 2000–2003.
The Federal Reserve, along with the rest of the world’s central bankers, has puffed stock valuations into an epic bubble, and the stock market has a long, long ways yet to fall… just not in a straight line.
That’s heart attack material for both buy-hold-and-pray and buy-the-dip investors, but it is a goldmine if you adapt your strategy.

Instead of buying the dip, the right strategy going forward is SELL THE RIP.
When the stock market gives you a big rally, the right move will be to sell into strength.
And if you have some risk capital, that will be the time to load up on inverse ETFs and put options, like my Rational Bear subscribers did in July.
The biggest short-selling opportunity of our lifetimes is knocking on your door.
Tony Sagami![]()
30-year market expert Tony Sagami leads the Yield Shark and Rational Bear advisories at Mauldin Economics. To learn more about Yield Shark and how it helps you maximize dividend income, click here. To learn more about Rational Bear and how you can use it to benefit from falling stocks and sectors, click here.


| Fri. | Mon. | Tue. | Wed. | Thu. | Fri. | Mon. | Evaluation | |
| Monetary conditions | 0 | 0 | 0 | 0 | 0 | 0 | 0 | 0 |
| 5 day RSI S&P 500 | 9 | 5 | 5 | 37 | 51 | 51 | 46 | 0 |
| 5 day RSI NASDAQ | 10 | 6 | 6 | 40 | 53 | 55 | 48 | 0 |
|
McCl-
lAN OSC.
|
-234 | -336 | -290 | -145 | +8 | +56 | +39 |
0
|
| Composite Gauge | 17 | 15 | 16 | 6 | 5 | 9 | 12 | 0 |
| Comp. Gauge, 5 day m.a. | 13.26 | 15.21 | 16.0 | 14.2 | 11.8 | 10.2 | 9.6 | 0 |
| CBOE Put Call Ratio | 1.68 | 1.25 | 1.27 | 1.04 | 1.19 | 1.28 | 1.17 |
+
|
| VIX | 27.88 | 40.74 | 36.02 | 30.32 | 26.10 | 26.05 | 28.43 | + |
| VIX % change | +47 | +45 | -12 | -16 | -14 | 0 | +9 | + |
| VIX % change 5 day m.a. | +18.4 | +27.0 | +23.0 | +18.0 | +10.0 | +0.6 | -6.6 | – |
| Adv – Dec 3 day m.a. | -1978 | -2427 | -1762 | -429 | +1338 | +1660 | +924 | – |
| Supply Demand 5 day m.a. | .33 | .18 | .13 | .25 | .50 | .59 | .60 | 0 |
| Trading Index (TRIN) | 3.02 | 1.92 | 3.37 | .39 | .34 | .98 | 1.12 |
0
|
|
S&P 500
|
1971 | 1893 | 1867 | 1941 | 1988 | 1989 | 1972 | Plurality +1 |
 But in come the cronies to tell us not to worry about it.
The “relief rally” continued yesterday (08/27/15) All over the world, stocks gained. So did oil and commodities. (More on that below in today’s Market Insight.) The Dow was up 369 points – a 2.3% move. Chinese stocks were up by about 5%. Why?
U.S. GDP numbers for the second quarter came out higher than expected. The economy grew by an annual rate of 3.7%. And influential New York Fed chief William Dudley said the argument for a rate increase in September was “less compelling.”
A Decline in Excess of 50%
Oh, ye of little faith… fear not! Things are happening just as they should. It is the end of summer. Markets are giving strong hints of things to come in the fall. Like Vesuvius, a plume of smoke rises… and a cloud of dust hangs over the markets. The economic earth rumbles… and animals take flight.
But in come the cronies to tell us not to worry about it.
And who knows what happens next?
Your editor is a fairly good plumber. He can put the pipes together and unclog the toilet. Alas, his record as a market soothsayer is spotty. He is rarely wrong, but often so early that by the time the event occurs even he has forgotten he ever predicted it.
But today we are encouraged and emboldened. We swagger ahead, like a reedy poet into a rough bar, confident in the knowledge that there are giants behind us. Yes, economist and money manager John Hussman’s forecast is similar to our own. From his most recent note for Hussman Fund clients:
If you roll a wheelbarrow of dynamite into a crowd of fire jugglers, there’s not much chance things will end well. The cause of the inevitable wreckage is not the dynamite, but the trigger is the guy who drops his torch.
Likewise, once extreme valuations are established as a result of yield-seeking speculation that is enabled (1997-2000), encouraged (2004-2007), or actively promoted (2010-2014) by the Federal Reserve, an eventual collapse is inevitable.
By starving investors of safe return, activist Fed policy has promoted repeated valuation bubbles, and inevitable collapses, in risky assets.
On the basis of valuation measures having the strongest correlation with actual subsequent market returns, we fully expect the S&P 500 to decline by 40% to 55% over the completion of the current market cycle. The only uncertainty has been the triggers.
A $12 Trillion Wealth Wipeout
A “decline in excess of 50%” within “less than three years” is our forecast.
We will stick with it, hoping to live long enough to see it proven correct, or in any case hoping to live long enough to see how it turns out.
But this forecast is for real (adjusted for inflation) prices, not nominal prices. Because we have a feeling that the feds will not stay in their seats as the government loses revenues, zombies rise in rebellion, and cronies and campaign contributors lose much of their net worth.
As of this May, the combined market cap of the companies listed on the New York Stock Exchange was $19.7 trillion. A 50% plunge would wipe out about $10 trillion in investor wealth, give or take a few billion dollars. More “reflationary” monetary policies are no doubt in the pipeline. Real estate would most likely go down, too – especially at the upper end.
The house in Florida on the market for $139 million that we reported on last week, for example, would have to be sold at auction. How much would it bring? $10 million? $50 million? Who knows?
Debt in Distress
The junkiest, riskiest part of the bond market would also be destroyed. When the going gets tough, the “spread” (or gap between yields) on junk bonds over U.S. Treasury bonds widens, as bond investors bail out of their riskier positions.
Whole sectors could go broke. Here’s Bloomberg with a report on debt in the oil patch:
At a time when the oil price is languishing at its lowest level in six years, producers need to find half a trillion dollars to repay debt. Some might not make it.The number of oil and gas company bonds with yields of 10% or more, a sign of distress, tripled in the past year, leaving 168 firms in North America, Europe, and Asia holding this debt, data compiled by Bloomberg show. The ratio of net debt to earnings is the highest in two decades.
If oil stays at about $40 a barrel, the shakeout could be profound.
Easy come. Easy go. It doesn’t take too much imagination to see the EZ money of the last seven years going back where it came from – to nowhere.
Forward – to Disaster
And then, what would Saint Janet do?
Even now, under less stressful conditions (let us assume that markets stay calm), will she raise rates next month as expected? Probably not…
Consumer prices, as officially measured, are stable, not rising. And inflation expectations have dropped to a five-year low. Unemployment and GDP numbers make it look as though the economy is running okay. But don’t look under the hood!
And with the stock market so fragile, would Saint Janet risk being the one to cause a worldwide panic? Nah… No rate increase in September.
Instead, when the crash resumes, we will see even EZ-ier money, not tighter money. We are on course for a “hormegeddon”-style outcome. (Hormegeddon is the term I coined in my latest book for “disaster by public policy.”) Backing up is not an option. We must go forward – to disaster. By Bill Bonner, Bonner & Partners
Markets bounced over the last few days. But is the bounce to be trusted? Read… “The Most Astounding Credit Binge in History”

 Most people don’t think about profiting directly from a market decline.
They don’t understand the concept. They don’t know how.
That’s a shame. Because, to help get you through uncertain times, one of the key things you’ll need is money. And to make money, just running for the hills doesn’t work. Your best defense is to go on the offense.
There are also some people who miss this opportunity because they think there’s something cynical or sinister about making good money in bad times.
But the fact is, the more you and others can build wealth … keep it safe … and later reinvest it in worthy enterprises, the better it will be for everyone.
Back in the 1930s, only a very small handful of investors understood this. Only a tiny minority turned the tables on Wall Street and actually transformed the big, three-year market decline into a profit opportunity.
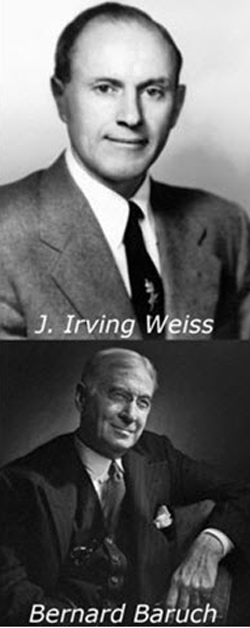
 Bernard Baruch, an adviser to several American presidents, was one of them.
My father, J. Irving Weiss, who later advised Baruch, was another. Initially, the two men didn’t know each other. Yet their approach to the market was remarkably similar.
In our many conversations Dad and I had over the years, here’s how he described his experiences:
“I had gone to work on Wall Street as a typist at the age of 16. I knew very little about the stock market then. But I found it so exciting that I went back in 1929 as a customer’s man (stock broker).
“I traded some stocks for myself and a few clients. When the crash hit, I was as surprised as everyone else by the utter fury of the decline. But my portfolio was clean. Neither I nor any of my clients had one share of stock.
“My good fortune was due to a combination of my family’s poverty and my healthy dose of skepticism. Everywhere, I saw commodities falling. Yet, all around me, investors were going wild over stocks.
“If people bought stocks with their own money, it might have been okay. But they were doing it on margin, with broker loans. These loans, which were normally around a half a billion or a billion dollars, surged to a total of $8 billion in 1929. That was huge in those days. The entire economy was only a bit over $100 billion.
“Overseas, most economies were sinking. Why should Wall Street be any different? I couldn’t understand the discrepancy. I wasn’t about to risk my family’s meager savings on something as uncertain as a surging stock market.
“Then I learned that you can actually profit from a falling market. Instead of buying low and then selling high, you just reverse the transaction. You borrow the stock and sell it. Then, you wait for it to go down and buy it back at lower prices. The more it falls, the bigger your profits. This fascinated me. I wanted to learn more.
 “I also studied the trading strategies of other great traders –men like Jesse Livermore, who built up a fortune trading the market, and Bernard Baruch, who was also making money in the market’s decline.
“Baruch was a quintessential contrarian. He recommended watching the crowd and then doing exactly the opposite. If good news about the stock market shows up on the front page of the paper, sell. That was my approach as well.
“I learned everything I could about selling short. So when the market rallied from November 1929 into early 1930, I was ready.
“With this rally, almost everyone on Wall Street thought we were in a ‘new bull market.’ But I was skeptical. The volume just wasn’t there. Deflation was spreading from commodities to other assets.
“The European markets had not recovered very much, and England was especially weak. When I saw nearly everyone turning bullish again, I just shook my head. I shorted every stock I could lay my hands on that had anything to do with England.
“President Hoover tried to rally businessmen and failed to do so. Still, no one on Wall Street was paying much attention to the sinking business picture. They said the ’29 crash had been a ‘temporary lapse.’
“They believed Hoover. I didn’t. I borrowed $500 from my mother and started to go short the stock market — 100 shares, 200, 300, building it up slowly at first.
“To me, $500 was a lot of money. I grew up in a poor and tough immigrant neighborhood on the Upper East Side of Manhattan. I’d worked two jobs to help support my parents and family ever since I was a teenager. But I was confident because of my indicators.
“The main indicator I watched was the Federal Reserve’s figures on the broker loans of the large New York banks that issued their data weekly. I noticed that, instead of broker loans going up, as they normally would in a recovery, they were going down. This tipped me off that the banks were liquidating stocks.
“I figured the banks represented the smart money in those days, so I followed them. They didn’t have any faith in stocks, so neither did I. As long as they sold, I sold. When they stopped selling, I stopped selling. The other brokers and analysts at the office laughed at me. They thought I was crazy to sell stocks short. But that only made me more confident.
“My other benchmark was foreign currencies, especially the British pound. Britain was still the financial capital of the world. So when the pound fell, it had a direct impact. My brother and I charted the pound daily, and as soon as it broke a key low, we sold short more stocks that were closely tied to the pound’s fate.
“By the time the crash was nearing bottom, I had transformed my mother’s $500 into six figures. She was overjoyed, and so was I.
“But not every trade was a success. Each time the market surged, I lost money, and whenever my losses began to mount, I sweated bullets. With short selling, there’s no limit to how much money you can lose. And when you use margin and borrowed money, like I did, the losses can pile up just as fast as the profits.
“That’s one reason why an even better opportunity is buying the bottom. At the end of the big bear market, we bought GM, AT&T, GE, and Sears for pennies on the dollar.
“The tape barely moved. No more than 350,000 to 400,000 shares of stock were traded that day. That’s less volume than what typically trades in just one large transaction in modern times. Some people thought it was the eye before the next storm. We didn’t. We just kept right on buying.
“The broker looked at us as if we were from another world. ‘How come you guys are buying?’ he asked. ‘You’re the only ones!’
“We didn’t tell him. It was none of his business. By the time the day was out, we had bought thousands of shares of stock for ourselves and for our clients at bargain basement prices. As a matter of fact, they were just about the lowest they had fallen in the entire century.”
Back to the Present
Let me summarize some of the lessons to be learned from my father’s experience:
Lesson #1. There’s a lot of money to be made in falling markets.
Lesson #2. The best time to start doing so is typically (a) after a big drop that breaks the back of the bull market and (b) when you get sharp market rallies, possibly triggered by desperate government efforts to turn the tide.
Lesson #3. Traditional short-selling is too risky for most investors.
Fortunately, however, you can profit from a market decline without selling stocks short and without risking a penny more than you invest.
You can simply buy exchange-traded funds that are specifically designed to profit from falling markets — inverse ETFs.
In fact, with these special-purpose ETFs, you could have the opportunity to earn as much money in a bear market as you’d make in a bull market.
You don’t need a special brokerage account. You can buy them like any stock or other kind of ETF. Your goal is simply to buy low and sell high.
Lesson #4. From an early age, we are taught that “up” is good and “down” is bad. So most people don’t like declines. But that kind of bias has no place in investing strategies. Especially in today’s topsy-turvy world, serious investors should learn how to invest in both up and down markets.
Lesson #5. Bernard Baruch’s axiom to never follow the crowd is especially critical. If you follow the crowd, you could end up buying stocks when investors are the most enthusiastic (at the market’s top) and selling when they are the most downtrodden (at the bottom).
Avoid that trap. Even if Wall Street experts or your own friends deride your approach, don’t let that stop you from making rational, prudent decisions.
Lesson #6. You don’t have to be a seasoned expert to make money in the market. In fact, sometimes, those who are new to the world of investing can see the big picture more clearly than veterans who have been cocooned on Wall Street.
You see that the country is not going down the right path. You see foreign markets sinking. In your heart and mind, all that simply does not jibe with the image of a nonstop bull market.
You feel that major corrections, or worse, are still very possible — even needed to restore reason and a sober recognition of reality.
Lesson #7. Whenever a supposedly “powerful” central bank or government agency — in Washington, London, Brussels, Tokyo or Beijing — makes a new announcement to prop up their stock markets or rescue their economy, you can typically expect bursts of optimism in their stock markets.
But especially in the current environment, that could be very deceptive — one of the worst times to buy stocks or regular ETFs and one of the best times to buy inverse ETFs.
Lesson #8. An excellent indicator that many people ignore is foreign currencies. Back in the 1930s, my father tracked the British pound because it represented the world’s dominant economic empire. When it fell, it signaled continuing trouble for the entire world.
This time, a similar indicator is the U.S. dollar against the Japanese yen. When the U.S. dollar falls against the Japanese yen (expressed as fewer yen needed to buy each dollar), that could be a signal of a decline in the U.S. market.
The reason: As we’ve told you repeatedly, the U.S. market has greatly benefited — and may continue to benefit — from a global flight to quality.
We call it the Global Money Tsunami. And as long as that money continues rushing into U.S. markets, it can boost U.S. share prices.
But when it’s diverted to markets like Japan, considered a competing safe haven, it can have the opposite effect — at least temporarily.
Lesson #9. Do not expect profits all the time. In any kind of investing — in rising or falling markets — losses can and do happen. So be sure to keep plenty of cash in reserve.
Lesson #10. Whether it turns out to be just a correction or a lot more, the more durable profit opportunity comes after the market’s decline.
That’s when you can reinvest the profits you make on inverse ETFS — or just use the cash you’ve stashed away — to pick up the highest quality investments at the lowest prices.
Good luck and God bless!
Martin
In last week’s missive I specifically stated:
“The time has now come to start moving more heavily to cash. As I will discuss throughout this weekend’s missive, including the 401k-Plan Manager, it is now time to “OPPORTUNISTICALLY” REDUCE PORTFOLIO ALLOCATIONS.
As noted in the chart below, the markets are now once again extremely oversold. As I have often stated in the past:
“By the time a market signal is given in the market, the markets are very likely at a point of extreme oversold or bought conditions. Therefore, it is always better to use the subsequent relaxation of those extreme conditions to add or reduce portfolio exposure.”
This is why it is never a good idea to “panic” when something initially goes wrong.
With the markets now deeply oversold, it is VERY likely that the markets will bounce next week. The problem, for those with “buy and hold” bullishly biased strategies, is the “bull market” has now ended…at least for now.
As shown in the next chart, and confirmed by the above, is that a bounce from these oversold levels will run into a substantial amount of overhead resistance where the rally will very likely fail. THIS WILL BE THE POINT TO LIQUIDATE HOLDINGS.”
The chart below is updated through Thursday’s close.


-
I know Mike is a very solid investor and respect his opinions very much. So if he says pay attention to this or that - I will.
~ Dale G.
-
I've started managing my own investments so view Michael's site as a one-stop shop from which to get information and perspectives.
~ Dave E.
-
Michael offers easy reading, honest, common sense information that anyone can use in a practical manner.
~ der_al.
-
A sane voice in a scrambled investment world.
~ Ed R.
Inside Edge Pro Contributors

Greg Weldon

Josef Schachter

Tyler Bollhorn

Ryan Irvine

Paul Beattie

Martin Straith

Patrick Ceresna

Mark Leibovit

James Thorne

Victor Adair