
Stocks & Equities
Fed funds futures are coming around to the idea of no September rate hike, a position we long held since last December based on the argument that inflation in 2015 will move further below the Fed’s mandate, to the extent that the tightening in labour markets is inadequate to stir up inflationary pressures.
The negative trifecta of: i) slowing China; ii) strengthening US dollar; and iii) rising oil supplies has unleashed a negative feedback loop of accelerating descent in oil prices, gloomy climate for emerging market’s exports to China and broadening cuts in capex from energy gains dwarfing any savings to US consumers from lower prices at the tank.
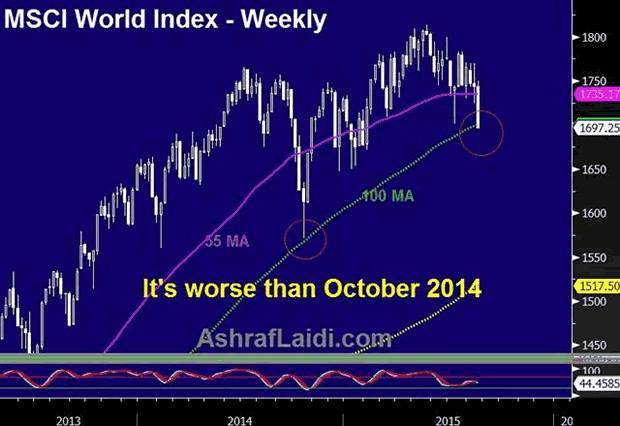
Why it’s worse than the October 2014 sell-off?
Nearing Disinflation
Most market and survey-based measures of US inflation are lower than in October 2014. Unlike survey-based inflation measures, which are provided monthly, break-even rates priced off US inflation-protected bonds are available daily, with the 2-year BE tumbling near 7-month lows at 0.24% and 5-year BE rates at 1.2%, the lowest since 2010. Is the Fed being inadequately taking notice of falling oil prices? This WILL change in the September meeting and the first hint of which will be seen in next weekend’s speech by Fed governor Stanley Fischer at the Jackson Hole conference.
Greater USD Backlash
Since October, the USD has gained an additional 12% against most major currencies, exacerbating the currency translation effect for US multinationals and increasing the price for US exports in the global market place. Surging costs of USD-denominated loans are also punishing emerging markets, especially in Asia. More than $900 bln in USD-denominated debt remain unpaid in corporate China.
No Extra BoJ, ECB Magic
Two weeks after global yields and share prices plummeted in midOctober, the Bank of Japan surprised the world with a rare split 5-4 decision in its policy board to accelerate the monthly purchases of Japanese government bonds so that its holdings increase at an annual pace of 80 trillion yen.
Two weeks later, the European Central Bank signalled to markets that quantitative easing and negative interest rates would finally be pursued.
Markets’ reaction to these events was a 2-month rally in global shares, which eventually stalled in January 2015 as the New Year gave its first hint of impending deflation.
China Devaluation = Antithesis of ECB, BoJ QEs
China today is far weaker than it has ever been over the last 15 years. Most services and manufacturing surveys indicate a contraction, while exports have declined for the 5th month over the last seven months, driving down currency reserves to two-year lows. Tying the yuan to the rising USD has worsened the situation since October.
This month’s CNY devaluation may be a stimulus for China, but its impact on the rest of the world is the antithesis of QEs from the BoC and ECB.
We raised the target on our EURUSD longs from Jul 30 (pre-NFP) as the unwinding of EUR shorts has yet to extend once a 2015 rate hike is completely shut out of the market. The euro unwinding is partly joined by further losses in the Eurostoxx and the Dax, with 9,970 and 1,830 targets cemented for the Dax-30 and S&P500.

Briefly: In our opinion, speculative short positions are favored (with stop-loss at 2,140, and profit target at 1,980, S&P 500 index)
Our intraday outlook is bearish, and our short-term outlook is bearish:
Intraday outlook (next 24 hours): bearish
Short-term outlook (next 1-2 weeks): bearish
Medium-term outlook (next 1-3 months): neutral
Long-term outlook (next year): bullish
The U.S. stock market indexes lost 0.7-0.9% on Wednesday, retracing their recent move up, as investors reacted to the FOMC’s Minutes release, among others. Our yesterday’s bearish intraday outlook has proved accurate. The S&P 500 index remains within half-year long medium-term consolidation, as it continues to fluctuate along the level of 2,100. The nearest important level of resistance is at around 2,100-2,115, marked by local highs. On the other hand, support level is at 2,040-2,060, marked by some previous local lows. There have been no confirmed negative signals so far, however, we still can see negative medium-term technical divergences:

Expectations before the opening of today’s trading session are negative, with index futures currently down 0.7%. The main European stock market indexes have lost 0.4-0.8% so far. Investors will now wait for some economic data announcements: Initial Claims at 8:30 a.m., Existing Home Sales, Philadelphia Fed, Leading Indicators at 10:00 a.m. The S&P 500 futures contract (CFD) trades within an intraday downtrend, as it continues its recent move down. The nearest important level of resistance is at 2,080-2,100, and support level is at 2,040-2,050, as the 15-minute chart shows:

The technology Nasdaq 100 futures contract (CFD) follows a similar path, as it continues its short-term downtrend. The nearest important level of resistance is at around 4,500. On the other hand, support level is at 4,430-4,450, as we can see on the 15-minute chart:

Concluding, the broad stock market retraced its recent move up yesterday, as it extended its short-term consolidation. There have been no confirmed medium-term negative signals so far. However, we continue to maintain our speculative short position (2,098.27, S&P 500 index), as we expect medium-term downward correction or an uptrend reversal. Stop-loss is at 2,140, and potential profit target is at 1,980. You can trade S&P 500 index using futures contracts (S&P 500 futures contract – SP, E-mini S&P 500 futures contract – ES) or an ETF like the SPDR S&P 500 ETF – SPY. It is always important to set some exit price level in case some events cause the price to move in the unlikely direction. Having safety measures in place helps limit potential losses while letting the gains grow.
Thank you.

Economic Basis For Large Bear Market Declines
As we noted in a recent “recession odds” article, bear markets typically are caused by one of two things: a recession or tight monetary conditions. For example, the 2000-2002 bear market featured a rough economic period in 2001 (see table below).
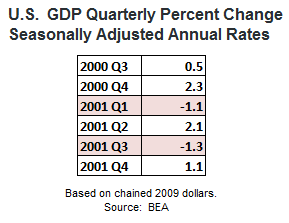
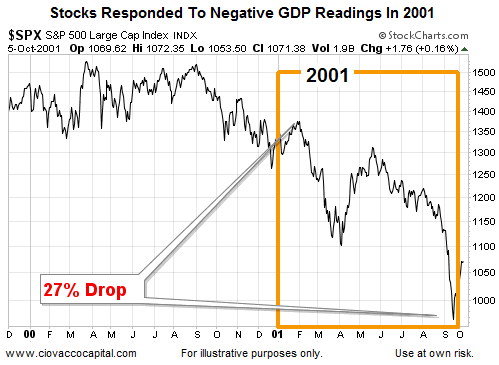
The chart below shows a period in 2001 that featured a 27% drop in the S&P 500, which even in isolation crossed the widely accepted 20% threshold defining a bear market. The big drop occurred during the period of weak economic growth as shown in the table above.
2001 vs. 2008 vs. 2015: Another Perspective
Last week, the global equity markets were quite undecided. China’s and Japan’s equity prices have been moving higher. The Japanese Nikkei reached its highest level since 1996 on Tuesday, August 11th, but then pulled back at the end of the week. Hong Kong’s Hang Seng made a new monthly low and the Australian Market fell to a new 6-month low.
Europe was more decisive. Traders mostly sold stocks. The German DAX, London FTSE, and Zurich SMI all fell to monthly lows by mid-week and did not recover much by Friday August 14th’s close. In Russia, it was much different. Moscow’s MICEX index rallied to its highest mark in 3 months.
In the US Markets, the selling was even more intense. On May 19th,2015, the DJIA topped out at 18,351. The DJIA has failed to make a new high since then and continues to sell off. The decline, so far, has been over 1,220 points which is its’ greatest loss of the year. Last week, began very strong, with the DJIA up 245 points on Monday, August 10th; Tuesday was down 212 points, and by Wednesday, the DJIA had fallen all the way to 17,125, its’ lowest level since February 2nd, 2015. We had a CONFIRMED BEARISH/SELL signal on August 4th, when the Dow Jones was at 17,596. Before I can take any BEARISH positions in the US Markets, this signal needs to be CONFIRMED by the SPX and the NDX-100 as BEARISH, which are currently NEUTRAL/TRENDLESS.
The SPX landed at support levels and found its’ footing, once again. We are getting closer to the cycle lows in September/October when the downward pressure will push it through its’ support trend lines. We are still into a sideways direction. It is a little too early to tell if it will continue the sideways motion or decline in some downward momentum, next week. SPX is undergoing a consolidation in a downtrend trend using the 200- Day Moving Average as support. A daily close below 2076, which does not hold, should bring about the next challenge to the 2040 major support level. The current declining patterns are represented in those of the DJIA,, NYSE and the Dow Jones Transportation Indexes.

The Dow Jones Transportation Index and the Dow Jones Industrial Average are leading the US Markets down during this topping process They are declining further than the other indexes, and the other indexes should be establishing their downtrends, in the near future. With the exception of a monumental one-day market crash, that happens once in a blue moon, bull markets that are topping undergo a drawn-out process that usually takes, at least, many months before bearish momentum finally takes over and a new downtrend emerges.

Considering that US stocks have been in a 7 -year bull market, it would be unreasonable to expect such bullish momentum to change overnight.
Therefore, even though price momentum has been favoring the bulls lately, it is still my belief, that it is dangerous to be invested on the long side of these markets, as of November 25th, 2014.
The stock market is undergoing a big trend change and most of the analysts are missing it, which is normal. They lack the access to “The Predictive Trend System Analytic’s” of a Financial Forecasting Model. My clients have the access to this knowledge from our subscription service that we provide. This knowledge provides you, the client, with THE EDGE that other professional investment firm’s lack.
U.S. equity markets have been fueled by cheap dollars and cheaper interest rates. The combination of the stock market crash from 2008 – 2009, along with a declining U.S. Dollar, has been destroyed by the Federal Reserve Bank (FRB), which has helped US Equities to become a bargain on the global market. This allowed foreign buyers to come in and purchase US Equities, at both a nominal value, based on the markets’ decline, as well as, a relative value based on their home currency. Foreign investors have capitalized on the rise in the US equity market
On November 25th, 2014 my **Global Sentiment Model signaled the “EXCESSIVE EXTREME OPTIMISM”, which provided an exit point on all long US Market positions . Those traders and investors, that remained in long positions, who were not subscribers to our service, at that time, have just been channeling, without any new break outs into new highs.
There is a huge disconnect between the popular sentiment, among the “talking heads” on the news, regarding how these events will affect the September 2015 meeting of the Federal Reserve Bank. The general consensus, that I feel currently exists, is that this could very well push any increase in interest rates, out into the year, 2016. The Federal Reserve Board of Governors has been decidedly dovish, regarding this aspect, and has continued its’ quantitative financial engineering.
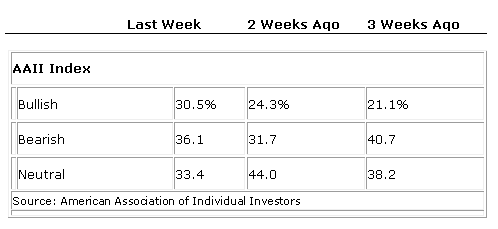
Investor Sentiment Readings
High bullish readings in the sentiment stock index usually are signs of Market tops; low ones, market bottoms.
Our current sentiment and technical features are consistent with a major stock market top. This model uses the market sentiment composite which is a measure of investor sentiment. This metric tracks the mood of investors, which is then translated into a probability whether the markets will advance or decline, within the near term, as well as, an undisclosed period of time. It is a contrarian indicator that produces a bullish signal, when market sentiment is overwhelmingly negative, and a bearish signal when markets are overwhelmingly bullish.
We have not disclosed these models’ methodology, and its statistical data, as it is proprietary. We have also not disclosed the correlation coefficient that is used to measure the strength of the linear dependence and its’ algorithms between the market sentiment composite and the 12-month forward return. A trading friend of mine developed this model thirty years ago. For the period of time that it has been implemented, which is now 25 years, it has been predicatively accurate, 100% of the time, prior to any major changes within the US Markets. The last signal that was generated was on November 25th, 2014, which registered “EXCESSIVE EXTREME OPTIMISM” and the broad market had been trading sideways since.
The US markets continue to s-l-o-w-l-y roll over with the Dow Industrials leading the way. Despite the fact that $INDU moved 100 points higher this week, the intermediate to long-term trend is clearly down. Lots of people talked about the “Death Cross” that occurred on the Dow’s daily chart on Monday when the 50-day simple moving average moved below the 200-day average, but that should come as no surprise to any reasonably-attentive ChartWatchers. Here’s why:

When a market rolls over slowly like this, the first thing to go is the uptrend’s momentum and, yes, we see that as the MACD has been moving lower for months. The next thing to happen is increased interaction with the 50-period moving average. Next up are tests of the 200-period moving average and it draws closer and closer. Then comes a definitive break below the 200-period average and then finally the “Death Cross” occurs – which is where we are at with the Dow.
A longer-term weekly chart shows the slow roll-over more clearly. It really is a “text book” rollover:

The S&P 500 hasn’t rolled-over quite yet but its chart looks very similar to the chart above back in June. The Nasdaq chart offers some hope with the price bars remaining above the 200-day MA for now but something significant needs to change if it is to avoid this same fate.
For more thoughts on the market – including the current breadth and sector situation – be sure to watch the recording of this weekend’s ChartWatchers LIVE webinar. Just click here to get started.
As I say towards the end of that recording, there are still stocks out there with positive momentum and great relative strength – you just need to work a little harder to find them and then watch them closely for signs of weakness.
Take care everyone!
– Chip

-
I know Mike is a very solid investor and respect his opinions very much. So if he says pay attention to this or that - I will.
~ Dale G.
-
I've started managing my own investments so view Michael's site as a one-stop shop from which to get information and perspectives.
~ Dave E.
-
Michael offers easy reading, honest, common sense information that anyone can use in a practical manner.
~ der_al.
-
A sane voice in a scrambled investment world.
~ Ed R.
Inside Edge Pro Contributors

Greg Weldon

Josef Schachter

Tyler Bollhorn

Ryan Irvine

Paul Beattie

Martin Straith

Patrick Ceresna

Mark Leibovit

James Thorne

Victor Adair