
Stocks & Equities
Reviewing the US stock market picture from a few different angles…
NFTRH been using the Equity Put/Call ratio to gauge pressure on the US stock market for all of 2015. Many people think that anxiety indicators like this and the VIX are contrary indicators (i.e. when they spike you buy the fear in the markets, which often does work well) but when smoothing out CPCE using a moving average (weekly EMA 20 in this case) you get a trend.
The market benefited over long stretches from the calm atmosphere and the down trend in put buying vs. call buying. One explanation is that the market felt safe in mommy and daddy’s arms (Bernanke and Yellen, amidst ‘peak confidence’ in the Fed with a side of Goldilocks).
Then came transition and then came uptrend. The market has gone exactly sideways for all of 2015.

Meanwhile, gold is breaking out vs. commodities, so a counter-cyclical message is back in play. Now, this has not stopped the market yet, as the implication has been to this point, a Goldilocks scenario for the US.

Except that this time Palladium-Gold ratio, a cyclical indicator, has joined its bearish fellow above, in making a counter-cyclical turn.

As long as the stock market’s price is in an uptrend, which it is, then that is the primary ruler of things. The Dow is in an uptrend because it has not violated the October low and it is at the weekly EMA 85, which has supported every routine correction since 2011.
Bullish % (faded into background) is another of those indicators you could consider a contrary indicator, i.e. buy the correction, but there is one notable difference between this instance and the previous ones where BP declined; in this case BP (a measure of market participation) has ground lower while the Dow went sideways before recently dropping. Previously, BP has plunged in concert with corrections.

S&P 500 is more egregious, as it is still sideways and only testing the the first key moving average. This is a very thinned out market as the majority of components have been weak.

Nasdaq 100 has a bigger divergence, still. Price has continued up, as fewer big tech captains do the heavy lifting.

As noted above, price is the ultimate decider and price has not yet decided. Dialing in the view of SPX to a daily once more, we note an index getting pinched between the daily SMA’s 50 and 200. Price direction, up or down, will be coming soon.

Subscribe to NFTRH Premium for your 25-35 page weekly report, interim updates and NFTRH+ chart and trade ideas or the free eLetter for an introduction to our work. Or simply keep up to date with plenty of public content at NFTRH.com and Biiwii.com. Also, you can follow via Twitter @BiiwiiNFTRH.

Stocks bounced higher on Monday, fuelled by strength in markets overseas, as well as takeover news in the US. Major benchmarks in the US closed higher by over 1%, the largest one-day jump since May. The S&P 500 Index bounced firmly from its 200-day moving average, yet again, emphasizing the significant support that exists at this long-term average. Since the start of July, the large-cap index has recorded three major tests of this average, making it vulnerable to breakdown as the weight of the benchmark leans on support. The percent of stocks in the index above 200-day moving averages currently sits at 57%, down from 90% recorded last summer; market breadth continues to wane. As an increasing number of stocks break below their 200-day moving averages, the weight on the broader market will become apparent, turning what was previously support into resistance. For now, support cannot be denied, a trend that will continue until it ends. However, should a break occur at this long-term average, the losses are likely to continue over the short to intermediate-term.

Sentiment on Monday, as gauged by the put-call ratio, ended overly bullish at 0.56. Monday’s closing put-call ratio matches the lowest level of the year, last charted on May 11. Typically, when investors lean bullish to the degree that the ratio is suggesting, equity market losses typically follow.

….for the comprehensive daily report including seasonality and sentiment click on any chart above or go HERE
For many moons, Larry Edelson, Mike Larson and I have been alerting you to a series of upcoming disruptions and dangers overseas — wars, revolutions, recession, and chaos.
We told you they would spread; and they have.
We predicted they would drive wave after wave of flight capital to our shores, and they have.
Plus, we pinpointed the most obvious, most immediate, victims of those disasters — investors who plowed their money into emerging market countries. And now, those investors are getting killed in a series of disastrous stock declines:
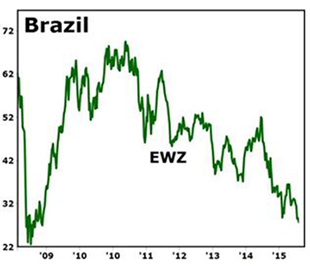 Brazil has suddenly flip-flopped from a miracle economy to a basket case.
Brazil’s service sector, once robust, has just suffered its largest fall since early 2009.
Overall economic activity is falling at an estimated annual rate of almost 5%.
The Brazilian currency — the real — has lost half its value.
And a massive corruption scandal, which began with Brazil’s oil giant Petrobras, has now spread fear to the boardrooms of dozens of the country’s largest corporations.
Result: EWZ, the once-high-flying ETF that represents Brazil’s largest companies, has suffered a long-term plunge from over 99 to a recent low of 27 — a wipe-out decline of almost 72%.
Moreover, it is now approaching the extreme low it made back in the depth of the 2008 bear market.
If that level is broken, look out below!
South Korea, recently a darling of global investors, has suddenly been cast as one of the dogs.
Youth unemployment has crept up to record highs.
 The working-age population, which, until recently had made South Korea an export powerhouse, is shrinking.
And among Korea’s elderly, poverty is the worst of all 34 countries that belong to the Organization for Economic Cooperation and Development (OECD).
For all these reasons — and more — EWY, the ETF specialized in South Korea’s blue chips, took a beating in 2014, rallied, and has now taken an even bigger beating in 2015.
Malaysia, another recent “miracle” economy, has been hit even harder:
Its currency, the ringgit, has crashed to its lows of the late 1990s.
Its central bank, desperate to prevent an even more dramatic currency crash, is depleting its foreign currency reserves.
 Adding corruption to the mix, the government’s giant investment fund — 1MDB — is under investigation over allegations of a massive misappropriation.
The biggest blow of all: The global oil-price plunge, gutting Malaysia’s largest source of revenues.
So it’s no wonder that the ETF devoted to Malaysia’s leading stocks has also been smacked down, busting through four years of lows.
But it’s Russia that currently worries me the most — both for the sake of its own people and the rest of the world.
If Russia’s economic swan dive could be blamed exclusively on its showdown with the West — sanctions, countersanctions and now more sanctions — you could argue that, once politicians on both sides come to their senses, a big rally might be in the offing.
Alternatively, if you could pin it all on the oil-price slump, you might argue that, as soon as oil markets turn, all would be fine.
The reality, however, is that Russia is being dragged down by both of these simultaneously. And both are entrenched megatrends with no signs of ending: The anti-West propaganda machine in Russia is now fully entrenched and empowered, making it almost impossible politically for the leadership to reverse course. And even if oil markets started recovering today, it could take years for Russia to recoup lost revenues.
Bottom-line: Russia is trapped in a Great Recession that’s probably going to be a lot bigger than what the U.S. has seen in recent years. They’re looking at …
* GDP set to shrink by 3.4% this year and by as much as 9% overall
* A ruble that sank by half last year, and is now sinking again.
 * Plus a great bear market in Russia’s leading stocks, which, even in the absence of an East-West conflict, would frighten away the most cold-blooded global investor.
Like Brazil’s stock market, it’s not too far from the prior Big Bottom made in early 2009.
And like Brazil’s, if that critical low is breached, a further collapse could be hard to avoid.
The big question …
What does this mean for U.S. investors?
Are these foreign markets strictly victims of the global flight to quality — hitting their stocks hard, but giving ours a boost?
Or are they early storm warnings of similar tempests that could ultimately reach the United States too?
We believe that, for now at least, it’s mostly the former. But it’s not too soon to start waving a yellow flag of caution.
So if you haven’t done so already, be sure to …
 Own only the highest-quality stocks in the strongest U.S. sectors …
Keep a super-sized portion of your money in cash, and
Get ready to take even more protective action if needed.
Good luck and God bless!
Martin

 Earlier this year we witnessed a sharp uptick in a number of the energy related stocks in our Coverage Universe from the lows experienced after the oil price shock which began this past fall. The spike began in early March as oil prices strengthened and investors bid up depressed energy shares, particularly in some of the quality names we cover(ed). As the adage states however, even a dead cat will bounce if you drop it from sufficient heights. We worried that oil was the bouncing cat.
By May, a number of producers and oil service stocks had more than doubled since dropping to year lows in January of this year. While some of the gains were deserved as the price declines are typically over done when panic sets in, in our Focus Buy Quarterly Commentary at the time, we saw risk in the segment as capital spending has ground to a halt in some areas. At that time crude was well above its lows but still remained 35-40% lower than the levels we saw at this time last year and by most reports, the world remained rather awash in oil.
Given this widely held view, it was unclear as to whether a continued uptick in oil is sustainable. What we did and continue to know is that capital spending will be significantly lower in the energy segment for at least 12-months time. As such, recommended not to add to our exposure in this group and took the opportunity to cut some names following the recent uptick as almost all energy related companies continue to face significantly lower year-over year results for the next 12-18 months minimum.
Fast forward to today as both WTI and Brent Oil are hitting new-year lows, we continue to advise clients to avoid all but one or two energy names in our Small-Cap Coverage Universe near term. Poor year-over-year cash flow comparisons will continue for at least the next 3-4 quarters and with share prices hitting new-year lows, we expect the sector to be a favourite in this year’s late November and early December tax loss selling.
As such, we do not believe now is the time to begin buying energy related stocks. While our analysts will re-evaluate the landscape at the time, we expect to see some value in this segment near the end of 2015. This does not guarantee we will be buyers however, as we look for both value or reasonable prices and growth. The latter may not present itself again for quite some time.
Broader Markets
Broader North American markets remain fixated on the U.S. Federal Reserve.
Canada’s main stock index fell on Friday in a broad retreat led by heavyweight energy and financial stocks as oil prices recorded their sixth straight weekly loss and North American jobs data highlighted Canada’s relatively flaccid economy.
Canadian employment data showed a small gain in June, but a loss of full-time positions, while U.S. numbers were close enough to forecast to stoke bets the Fed will raise interest rates, perhaps as early as September.
In the U.S., investors have been negatively reacting to positive economic news, as it increases the likelihood of a rate hike in September.
Historically, investors have a wide variety of investment options. Many believe the low rate environment has made stocks the only game in town. Raising rates puts a crimp in this.
The theory is that when comparing the average dividend yield on a blue-chip stock to the interest rate on a certificate of deposit (CD) or the yield on a U.S. Treasury bond (T-bonds), investors will often choose the option that provides the highest rate of return – on a risk adjusted basis. With rate held to zero, stocks have been the preferred vehicle. The current federal funds rate tends to determine how investors will invest their money, as the returns on both CDs and T-bonds are affected by this rate.
Rising or falling interest rates also affects consumer and business psychology. When interest rates are rising, both businesses and consumers will cut back on spending. This can cause earnings to fall and stock prices to drop. On the other hand, when interest rates have fallen significantly, consumers and businesses will increase spending, causing stock prices to rise.
As we get closer to September, the data reports will be more and more important, and July’s U.S. job data was consistent with the trend the Fed wants to see before they decide to pull the trigger on the first rate hike. Many believe the market is now putting a greater probability on the Fed raising rates in September. However, today’s number was spot on consensus, and it’s not really spectacular enough to make a September rate hike a foregone conclusion.
All eyes will be on August data, and unless there is a surprise to the downside, a September hike seems increasingly probable.
|
KeyStone’s Latest Reports Section 7/9/2015 |
Disclaimer | ©2015 KeyStone Financial Publishing Corp.
Bloomberg just posted an analysis of the recent correction in media stocks (Another major pillar of the bull market is collapsing) that contains some surprising, occasionally amazing stats. Consider:
-
The 15-company S&P 500 Media Index has posted annualized returns of more than 33% since 2009. Prior to Tuesday, these stocks had risen 531%, from an aggregate market cap of $135 billion in March 2009 to about $650 billion.
-
This index has fallen by 11% in the past two days, led by Disney and Viacom, which are down 12% and 18% respectively. Five stocks — Disney, Time Warner, Fox, CBS and Comcast — lost almost $65 billion of value in two days.
-
Many of these companies are reporting lower sales while propping up their earnings per share with stock buybacks. Investors are finally seeing through the con.
-
One analyst observes that “An argument can be made that [the media bust] is an indicator of consumer sentiment, because that’s where media revenues come from.”
-
Now an already thin market — where most stocks were down while the major indexes were making new highs — has virtually no support. “More than 100 percent of this year’s increase in the S&P 500 is attributable to two sectors, health-care and retail, the tightest clustering for an advancing year since at least 2000.”
Among the many interesting things about the rise and fall of the old media stocks is that these companies were supposed to be the victims of technology. Everyone is replacing cable services with Netflix and Hulu, while movies, being digital files, are supposed to go the way of records and books, easy to make and download and therefore increasingly hard to sell at a profit.
But there they were, dominating the market. If this was a fluke — i.e., the last gasp of an industry about to be swamped by digitization — then it’s hard to know what these guys are really worth.
And with heath care and retail all that remain to prop up the market, it’s hard to know where the overall bottom might be.
…also:
Here Comes The Next Trillion-Dollar Bailout
![]()

-
I know Mike is a very solid investor and respect his opinions very much. So if he says pay attention to this or that - I will.
~ Dale G.
-
I've started managing my own investments so view Michael's site as a one-stop shop from which to get information and perspectives.
~ Dave E.
-
Michael offers easy reading, honest, common sense information that anyone can use in a practical manner.
~ der_al.
-
A sane voice in a scrambled investment world.
~ Ed R.
Inside Edge Pro Contributors

Greg Weldon

Josef Schachter

Tyler Bollhorn

Ryan Irvine

Paul Beattie

Martin Straith

Patrick Ceresna

Mark Leibovit

James Thorne

Victor Adair