
Stocks & Equities
The low-yield environment manufactured by central banks has encouraged and precipitated yield-seeking speculation. Investors and speculators alike have taken up a near-religious conviction in the demi-god status of central bankers. Will these central bankers continue to enjoy their god like status indefinitely or will they disappoint their followers?
In one of our earlier articles, US Equities: Overvalued or Undervalued, we surveyed the historical experience of valuation tools. In that article, we observed that the U.S. equity markets are priced for very low subsequent investment returns. This article adds to the historical experience by providing an overview of the potential risk that investors face, should we enter a bear market.
A market on steroids
Since the depth of the March 2009 bottom, the U.S. stock markets have more than trebled, having risen by about 215%[2] over a period of 75 months. Figure 1 shows the 75-month rate of change for the S&P500 Index for the last 140 years. The reason for using a 75-month rate of change is that the length of market’s current move from its trough is 75 months. Clearly, the current rate of change is in extreme territory and is exceeded only by three other market up-moves: the roaring bull market of twenties leading into the Great Depression, the bull market of the fifties and the technology boom. Further, the trajectory of the up-move is similar to that of the market leading into the highs of 1929 and the highs in 1938[3].
We have had a market on potent steroids.
Figure 1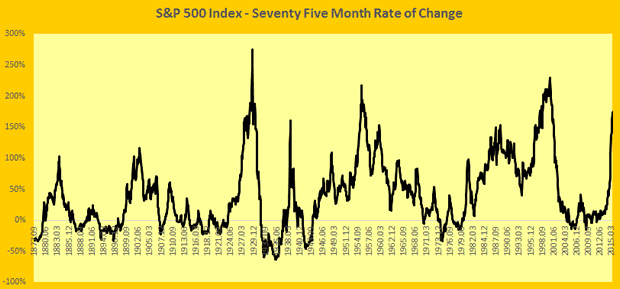
Sub-par economic growth
Interestingly, this strong performance of the U.S. equity markets has taken place while the broader economy hasn’t really done all that well. Economic growth rates have been sub-par for much of this equity market rally. Table 1 shows the average real GDP growth rates experienced during the three market up moves discussed earlier where the rate of change exceeded that of the current market. For comparison,we have provided the GDP growth rates experienced thus far during this up move.
Table 1[4] 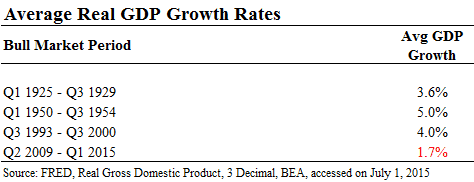
A bull market or a new market?
Naturally, this has prompted many astute market participants to raise questions about the sustainability of current price levels. John Hussman, Jeremy Grantham and others have pointed out the significant overvaluation of U.S. equities. On the other hand, many find the markets to be fairly valued based on a different set of valuation tools. The key point of contention between these two groups is the selection and application of valuation tools. However, there is a much more basic issue that investors have to contend with. As Benjamin Graham so eloquently put it, “The main issue before the investor may be expressed this way: Have we been in a bull market or in a new sort of market?[5]“
If we are in a bull market, we will indeed have a bear market following it. It is much like how night is inevitable after day. However, if you believe that we are in a new market where central bankers’ superpower is sufficient to fend off any bearish inclinations without regard to valuations, then the valuation question is irrelevant. In such a case, the inevitability of the bear market doesn’t hold.
Assuming we are in a bull market, it will pay to understand the kind of declines we could experience if we were to enter a bear market. Table 2[6] shows the declines experienced during the last 20 bear markets over the past 140 years[7]. The right-most column applies these declines to the recent S&P500 high of 2,100.
Table 2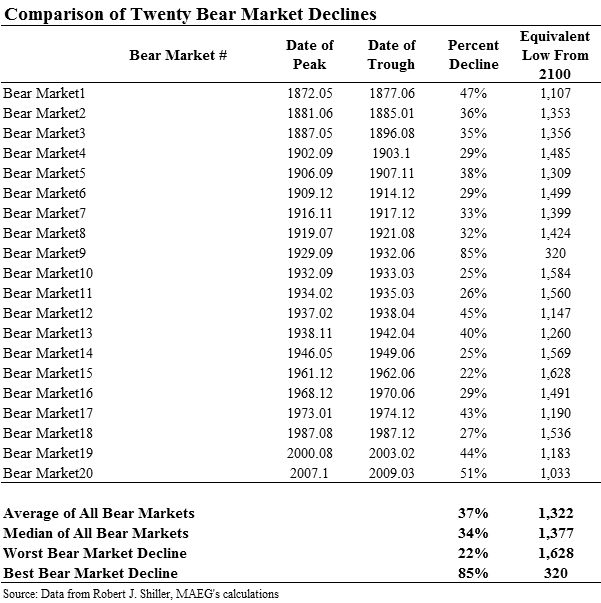
As shown in Table 2, a decline that is equivalent to the average of all 20 bear markets will indicate a market low of about 1,300 in the S&P 500, a fall of nearly 40%. None of this analysis means that a decline of this extent, or any decline at all, is imminent. However, an investor will do well to prepare herself mentally for such a decline and understand that a ≈40% decline in a bear market is a rather normal event.
That is not all that we can learn from past experience. As we would have expected, there is a significant relationship between valuation levels at the beginning of a bear market and the subsequent decline experienced. Table 3 shows the level of cyclically adjusted price to earnings (CAPE) ratio at the beginning and end of each one of the past 20 bear markets except for the first one[8].
Table 3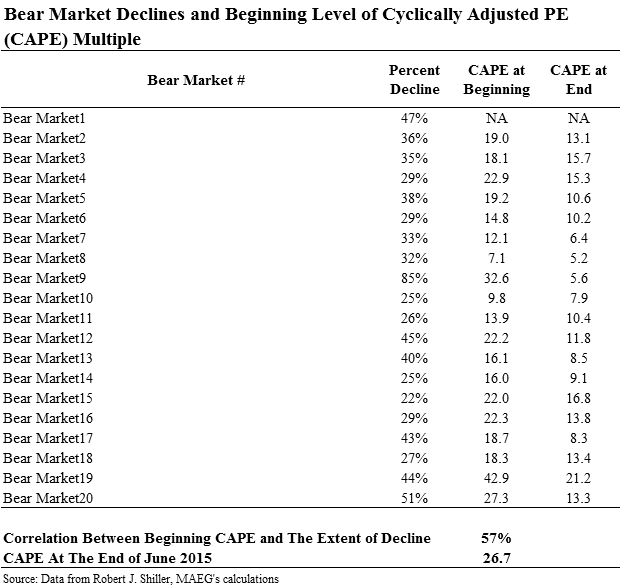
The correlation between beginning CAPE levels and the subsequent declines experienced is 57%. What this means is that the higher the CAPE at beginning, the larger the subsequent decline. The CAPE multiple at the end of June 2015 was nearly 27, higher than 17 of the past 20 bear markets.
Investors will be well served to keep in mind and mentally prepare for what historical experience has taught us regarding market fluctuations during a bear market. We don’t recommending jumping ship. But ensure that you have your life jackets and safety boats ready and at your disposal.
[1] This article is inspired by the talk delivered by Benjamin Graham at University of California, Los Angeles, on December 7, 1959. You can find an article based on Benjamin Graham’s talk here.
[2] As evidenced by S&P 500’s move from the lows in March 2009 to recent highs in June of 2015.
[3] Do not be fooled by the Rate of Change (RoC) chart in Figure 1. Just because the RoC peaked doesn’t mean that the markets had a decline immediately afterward. All it means is that the rate of advance slowed.
[4] Data for 925 – 1929 is taken from following link: http://www.usstuckonstupid.com/sos_downchart.php?year=1920_1939&units=s&chart=gdp&bar=1&stack=1&size=m&title=&color=c#sos302
[5] Talk delivered by Benjamin Graham at University of California, Los Angeles, on December 7, 1959.
[6] The calculations in this table are based on monthly closing price data. As the intra-month highs and lows are likely to have been higher and lower respectively when compared to the month end numbers, this table likely understates the extent of full declines experienced.
[7] Nerdy Details: For the purposes of this analysis, we have defined a bear market as any period during which the peak to bottom decline equaled or exceeded 20% on a monthly closing basis. Further, we have defined a bull market which resulted in an upward move of 25% or more from the lows on a monthly closing basis.
[8] The CAPE data is available from 1881 onwards. As the Bear Market #1 took place before 1881, the CAPE data is not available for this bear market move.

For 114 straight trading days, starting on February 3, the S&P 500 has closed every session between 2,040.24 and 2,130.82. That’s one of the tightest trading ranges ever for a period of that length—a trading band of just 4.44%.

The “buy every dip” rally that characterized last year’s market has gone away. Here’s a fascinating stat: The market has had more down days this year to date than in any year since 2002, but the drops are getting smaller. The average loss this year has been just 0.57%, compared with 0.80% since 2009. Despite the market’s lack of direction, we’ve seen a lot of drama this summer with the popping of China’s bubble and the ongoing mess in Greece. I promise you that this will be a Greece-free issue.
….continue reading including more market analysis and seven of CWS’s Buy List stocks HERE

![]()
Excellent 5 4 3 2 1 No good
By voting every day you help us get you the charts you want to see.
![]()
“If you board the wrong train, it is no use running along the corridor in the other direction.” – Dietrich Bonhoeffer
Events of the Day
July 19, 2015 – British Open golf tournament begins (ends July 20th)
Stocks of the Day
— Find out which stocks investors are focused on with the most active stocks today.
— Which stocks are making big money? Find out with the biggest stock gainers today.
— What are the largest companies? Find out with the largest companies by market cap.
— Which stocks are the biggest dividend payers? Find out with the highest dividend paying stocks.
— You can also quickly review the performance, dividend yield and market capitalization for each of the Dow Jones Industrial Average Companies as well as the performance of the Dogs of the Dow.
Mailing List Info
Chart of the Day is FREE to anyone who subscribes.
To ensure email delivery of Chart of the Day, add mailinglist@chartoftheday.com to your whitelist.
Notes:
Where’s the Dow headed? The answer may surprise you. Find out right now with the exclusive & Barron’s recommended charts of Chart of the Day Plus.
 Posted on
DOW + 76 on 850 net advances
NASDAQ COMP + 33 on 1200 net advances
SHORT TERM TREND Bullish
INTERMEDIATE TERM TREND Bullish
STOCKS: On Tuesday, the uptrend seemed to be based on a couple of things. No bad news from China or Greece and some decent bank earnings.
And, of course, the action of the past couple of days seemed to provided momentum.
GOLD: Gold was down another $1. It just keeps dropping albeit modestly.
NEXT DAY: Wednesday – No prediction.
CHART: Five day RSI is just peeking into the overbought range (arrow). Let’s keep a close eye here. My estimate is that there is still unfinished business on the upside.

BOTTOM LINE: (Trading)
Our intermediate term system is on a buy. We are long the SPY from 206.42. Hold for now.
System 7 We are long the SSO from 65.70. Hold for now.
System 8 We are in cash. Stay there.
GOLD We are in cash. Stay there.
News and fundamentals: Retail sales dropped 0.3%. The expectation was for a rise of 0.3%. On Wednesday we get PPI – FD, the Empire State mfg. survey, industrial production and the Fed Beige Book.
Interesting Stuff A year ago, Janet Yellen said that bio techs were somewhat over extended. At that time the appropriate ETF, the XBI, was at 139. Today it closed at 265. Economists are wrong a lot. It’s nice to be able to occasionally quantify their wrongness.
TORONTO EXCHAN GE: Toronto was up 66.
S&P/TSX VENTURE COMP: The TSX was higher by 2.
BONDS: Bonds were up modestly.
THE REST: The dollar fell back. Silver was down mildly. Crude oil curled up.
We’re on a buy for bonds as of June 11.
We’re on a sell for the dollar and a buy for the euro as of July 10.
We’re on a sell for gold as of July 2.
We’re on a sell for silver as of June 23.
We’re moving to a buy for crude oil as of July 14.
We’re on a sell for the Toronto Stock Exchange as of May 6.
We’re on a sell for the S&P\TSX Venture Fund as of October 30.
We are on a long term buy signal for the markets of the U.S., Canada, Britain, Germany and France.
|
Mon. |
Tue. |
Wed. |
Thu. |
Fri. |
Mon. |
Tue. |
Evaluation |
|
|
Monetary conditions |
+ |
+ |
+ |
+ |
+ |
+ |
+ |
+ |
|
5 day RSI S&P 500 |
34 |
49 |
27 |
26 |
54 |
66 |
70 |
– |
|
5 day RSI NASDAQ |
33 |
36 |
19 |
25 |
58 |
68 |
70 |
– |
|
McCl- lAN OSC. |
-68 |
-34 |
-123 |
-67 |
+41 |
+110 |
+140 |
– |
|
Composite Gauge |
13 |
8 |
17 |
13 |
7 |
3 |
7 |
0 |
|
Comp. Gauge, 5 day m.a. |
12.2 |
10.4 |
11.6 |
12.4 |
11.6 |
9.6 |
9.4 |
0 |
|
CBOE Put Call Ratio |
1.07 |
1.25 |
1.44 |
1.17 |
1.00 |
.57 |
.97 |
0 |
|
VIX |
17.01 |
17.09 |
19.64 |
19.97 |
16.83 |
13.90 |
13.37 |
0 |
|
VIX % change |
+1 |
-5 |
+4 |
+2 |
-16 |
-17 |
-4 |
0 |
|
VIX % change 5 day m.a. |
+5.0 |
-2.8 |
-1.4 |
+1.2 |
-2.8 |
– 6.4 |
-2.2 |
0 |
|
Adv – Dec 3 day m.a. |
-35 |
-104 |
-778 |
-311 |
+113 |
+1233 |
+1322 |
– |
|
Supply Demand 5 day m.a. |
.40 |
.58 |
.52 |
.40 |
.48 |
.57 |
.54 |
0 |
|
Trading Index (TRIN) |
1.53 |
.81 |
3.21 |
.81 |
.88 |
.60 |
.73 |
0 |
|
S&P 500 |
2069 |
2081 |
2047 |
2051 |
2077 |
2100 |
2109 |
Plurality -3 |
INDICATOR PARAMETERS
Monetary conditions (+2 means the Fed is actively dropping rates; +1 means a bias toward easing. 0 means neutral, -1 means a bias toward tightening, -2 means actively raising rates). RSI (30 or below is oversold, 80 or above is overbought). McClellan Oscillator ( minus 100 is oversold. Plus 100 is overbought). Composite Gauge (5 or below is negative, 13 or above is positive). Composite Gauge five day m.a. (8.0 or below is overbought. 13.0 or above is oversold). CBOE Put Call Ratio ( .80 or below is a negative. 1.00 or above is a positive). Volatility Index, VIX (low teens bearish, high twenties bullish), VIX % single day change. + 5 or greater bullish. -5 or less, bearish. VIX % change 5 day m.a. +3.0 or above bullish, -3.0 or below, bearish. Advances minus declines three day m.a.( +500 is bearish. – 500 is bullish). Supply Demand 5 day m.a. (.45 or below is a positive. .80 or above is a negative). Trading Index (TRIN) 1.40 or above bullish. No level for bearish.
No guarantees are made. Traders can and do lose money. The publisher may take positions in recommended securities.

-
I know Mike is a very solid investor and respect his opinions very much. So if he says pay attention to this or that - I will.
~ Dale G.
-
I've started managing my own investments so view Michael's site as a one-stop shop from which to get information and perspectives.
~ Dave E.
-
Michael offers easy reading, honest, common sense information that anyone can use in a practical manner.
~ der_al.
-
A sane voice in a scrambled investment world.
~ Ed R.
Inside Edge Pro Contributors

Greg Weldon

Josef Schachter

Tyler Bollhorn

Ryan Irvine

Paul Beattie

Martin Straith

Patrick Ceresna

Mark Leibovit

James Thorne

Victor Adair