
Stocks & Equities
 In her speech from Providence, Rhode Island this Friday, Federal Reserve Chair Janet Yellen said the central bank is on track to raise interest rates this year but will likely proceed cautiously because the job market hasn’t fully healed, inflation is low and growth has again disappointed.
U.S. job growth did rebound in May and the unemployment rate dropped to a near seven-year low of 5.4 percent, suggesting modest but continued positive underlying strength in the economy at the start of the second quarter and helping to keep alive prospects for a Federal Reserve rate hike later this year.
Nonfarm payrolls increased 223,000 as gains in services sector and construction jobs offset weakness in mining, the Labor Department said on Friday. The one-tenth of a percentage point decline in the unemployment rate to its lowest level since May 2008 came even as more people piled into the labor market. However, wage growth was tepid and March payrolls were revised downward.
The Fed expects economic growth to pick up in the months ahead. Her speech came a few hours after the Labor Department reported signs inflation is stabilizing, which should give the central bank more confidence about the economy’s strength.
With many suggesting the market strength of late has been driven by the ultra low rate environment, the more real the prospect for a hike becomes the better a chance the party could be over. But how real is the prospect of a hike in 2015? Or more importantly, in the grand scheme of the markets, how truly impactful would a quarter point increase be?
From a fundamental perspective, a quarter point hike really should have little impact on the markets. However, from a market psychology perspective, it could signal a shift from easing and a hold at ultra low levels to a tightening bias. This may actually be a good thing for the health of the markets in general as it can serve to keep the “froth” in check.
Fed officials have held the rate near zero for more than six years in a financial experiment that investors were originally told would be short-term and temporary in nature. Six years and counting is by no means short term. Now, the Fed sees the rate someday getting to 3.75% or what it considers to be normal in the long run. Their March forecasts showed that even at the end of 2017, they expected the rate to still be below that level.
In fact, on Friday, Yellen stated it could be “several years” before the Fed’s benchmark short-term rate is back to that range. Some believe several years could stretch into a decade. Again, given the unprecedented nature of the financial experiment the North American economy is currently participating in, even the most educated on these matters would just be guessing to provide any realistic timeframe or the eventual outcome.
In the U.S., the consumer-price index rose for the third consecutive month in April, reversing a three-month slide largely associated with falling energy prices. Consumer prices were still lower than they were a year ago after the earlier declines, but underlying inflation outside of the volatile food and energy sectors has stabilized. That could be a sign that broader consumer-price declines have run their course and that the economy, even after a weak first quarter, is not in a deepening slump.
U.S. consumers are spending, but more selectively, which in our minds is not a bad thing. Sectors such as the auto, restaurant and home have been the benefactors. We have seen shares in our top Small-Cap auto-parts manufacturer benefit greatly from this trend over the past 3 years and continue to see strength for the next 12-18 months.


Weakness In Transports In 2015
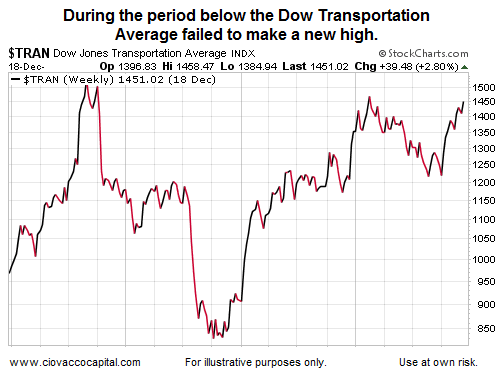
If you follow the markets, you have probably heard about the “non-confirmation” warning being flashed by the fact the Dow Transportation Average has failed to post a new high simultaneously with the Dow Jones Industrial Average.
Dow Theory Is Useful
We have written about Dow Theory many times in the past; a July 2014 article explains the economic rationale behind the theory. We believe Dow Theory is useful, but it is one of many sources of information.
Is It A Showstopper?
We will answer the question above with a few historical charts. Charts allow us to reference facts rather than
human bias or emotions. If I showed you the chart below, it would represent a “non-confirmation” period since the Dow Transportation Average has failed to push to a new high. We have removed the dates from the chart below to minimize historical bias.
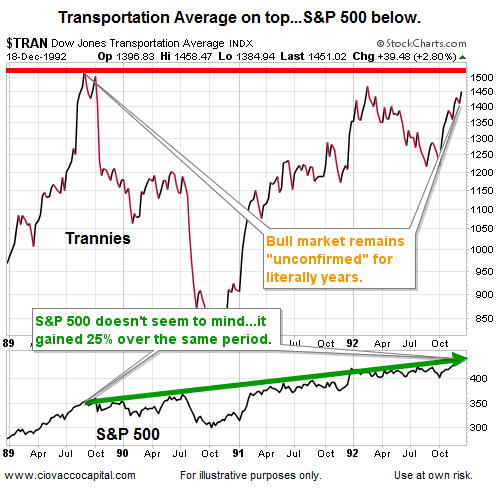
How Did The S&P 500 Do Over The Same Period?
The chart below shows the exact same period as the Transportation chart above. Did a new bear market start during the period of non-confirmation? Would it have made sense to sell all our stocks because the Dow Transports failed to make a new high? Answers: No and No. In fact, the non-confirmation was not particularly insightful or helpful at all since the S&P 500 gained 25% over the same period.

Bringing The Charts Together
The chart below allows you to see both indexes together. Dow Theory is relevant, but the fact that the Transports have not made a new high in 2015, taken in isolation, is not a reason to sprint for the equity exits.
You Can Always Find Bearish Data
If you are bearish, you can always find a chart that supports your personal outlook. The same can be said for the bullish side of the ledger. It is prudent to look at any information (bullish or bearish) in the context of a broader array of useful inputs. Our concerns about the Transports in 2015 would be greater if more inputs were singing off the same hymnal. That may happen, but we need to see that data, rather than anticipate it.
Some Other Takes On Trannies
This is a hot topic on Wall Street. You may want to see what others have been saying:
- Dow Theory signaling market doom? Nah
- Dow Divergences Part 1: Transports
- Why Dow Theory isn’t a red flag for the market
The Weight Of The Evidence Takes Precedence
We can learn something about the market and economy via the recent weakness in the Transportation Average, but it is not prudent to make decisions in any field based on one input viewed in isolation. The links below allow you to look at the 2015 stock market through a broader lens:
- 2015 And Historical Bear Market Triggers
- Is The Smart Money Running For Cover?
- Stock Correction Odds Increasing?

published on May 21, 2015, 6:19 AM:
Briefly: In our opinion, speculative short positions are favored (with stop-loss at 2,140, and profit target at 1,980, S&P 500 index)
Our intraday outlook is bearish, and our short-term outlook is bearish:
Intraday outlook (next 24 hours): bearish
Short-term outlook (next 1-2 weeks): bearish
Medium-term outlook (next 1-3 months): neutral
Long-term outlook (next year): bullish
The U.S. stock market indexes were virtually flat on Wednesday, as investors hesitated following recent move up. The S&P 500 index has managed to reach yet another new all-time high at the level of 2,134.72, before closing down 0.1%. The nearest important level of resistance is at around 2,130-2,135. On the other hand, support level is at 2,115-2,120, marked by previous resistance level. There have been no confirmed negative signals so far. However, we can see negative technical divergences:

Expectations before the opening of today’s trading session are slightly negative, with index futures currently
down 0.1-0.3%. The main European stock market indexes have been mixed so far. Investors will now wait for some economic data announcements: Initial Claims at 8:30 a.m., Existing Home Sales, Philadelphia Fed number, Leading Indicators at 10:00 a.m. The S&P 500 futures contract (CFD) trades within an intraday consolidation, following yesterday’s move down. The nearest important level of support is at around 2,110-2,115, marked by recent local lows. On the other hand, resistance level remains at 2,125-2,130, as the 15-minute chart shows:

The technology Nasdaq 100 futures contract (CFD) follows a similar path, as it fluctuates along the level of 4,490. The nearest important level of support is at around 4,480, and resistance level is at 4,500-4,520, among others, as we can see on the 15-minute chart:

Concluding, the broad stock market extended its fluctuations along its record highs yesterday. There have been no confirmed negative signals so far. However, we continue to maintain our speculative short position (2,098.27, S&P 500 index), as we expect a downward correction or an uptrend reversal. Stop-loss is at 2,140, and potential profit target is at 1,980. You can trade S&P 500 index using futures contracts (S&P 500 futures contract – SP, E-mini S&P 500 futures contract – ES) or an ETF like the SPDR S&P 500 ETF – SPY. It is always important to set some exit price level in case some events cause the price to move in the unlikely direction. Having safety measures in place helps limit potential losses while letting the gains grow.
Thank you.
115 Yrs of Dow Rallies Shows This One Well Below Average in Duration & Magnitude
The Dow just made another all-time record high. To provide some further perspective to the current Dow rally, all major market rallies of the last 115 years are plotted on today’s chart. Each dot represents a major stock market rally as measured by the Dow with the majority of rallies referred to by a label which states the year in which the rally began. For today’s chart, a rally is being defined as an advance that follows a 30% decline (i.e. a major bear market). As today’s chart illustrates, the Dow has begun a major rally 13 times over the past 115 years which equates to an average of one rally every 8.8 years. It is also interesting to note that the duration and magnitude of each rally correlated fairly well with the linear regression line (gray upward sloping line). As it stands right now, the current Dow rally that began in March 2009 (blue dot labeled you are here) would be classified as below average in both duration and magnitude.
Quote of the Day
“Managers are people who do things right, and leaders are people who do the right thing.” – Warren G. Bennis
Events of the Day
May 24, 2015 – French Open tennis tournament begins (ends June 7th) – Indianapolis 500
May 25, 2015 – Memorial Day (observed)
Stocks of the Day
— Find out which stocks investors are focused on with the most active stocks today.
— Which stocks are making big money? Find out with the biggest stock gainers today.
— What are the largest companies? Find out with the largest companies by market cap.
— Which stocks are the biggest dividend payers? Find out with the highest dividend paying stocks.
— You can also quickly review the performance, dividend yield and market capitalization for each of the Dow Jones Industrial Average Companies as well as the performance of the Dogs of the Dow.
Notes:
Where’s the Dow headed? The answer may surprise you. Find out right now with the exclusive & Barron’s recommended charts of Chart of the Day Plus.
STRATEGY OF THE WEEK
Finding stocks that nobody cares about which suddenly come alive with buyer support is a great way to swing trade your way to profitability. Each morning, I seek out stocks that meet the criteria of my Simple Swing strategy, looking for those with the right chart pattern for a run higher in the relative short term. Some recent examples of stocks meeting my rules are ELNK, MNGA, CAS and CALM.
This strategy tends to have a lower success rate but a higher reward. When it works, it can work really well.
I found a few more this morning, here are three to check out:
STOCKS THAT MEET THE FEATURED STRATEGY
1. OPTT
OPTT started its move from the open this morning, its run higher was pretty swift so I like this one better if it can pull back a bit first. With a few days, it can be lower but looking out a week or two and it has good potential to be higher. Support at $0.65

2. PRAN
PRAN had a jump in volume and price at 10:35 this morning and that allowed it to break its downward trend line. Support at $1.20.

3. ATEN
ATEN broke out of a cup and handle pattern today with strong volume. I picked it up at 9:44ET and the stability in to the close makes me think it has good potential to continue higher. Support at $5.40.

…..read Tylers full newsletter entitled “SEVEN PROBLEMS, SEVEN SOLUTIONS

-
I know Mike is a very solid investor and respect his opinions very much. So if he says pay attention to this or that - I will.
~ Dale G.
-
I've started managing my own investments so view Michael's site as a one-stop shop from which to get information and perspectives.
~ Dave E.
-
Michael offers easy reading, honest, common sense information that anyone can use in a practical manner.
~ der_al.
-
A sane voice in a scrambled investment world.
~ Ed R.
Inside Edge Pro Contributors

Greg Weldon

Josef Schachter

Tyler Bollhorn

Ryan Irvine

Paul Beattie

Martin Straith

Patrick Ceresna

Mark Leibovit

James Thorne

Victor Adair