
Stocks & Equities
I have been discussing over the last couple of months the potential resolution of the consolidation pattern that has confined the markets to a fairly narrow trading range, to wit:
“Despite the recent weakness seen since the beginning of this year, the market has remained solidly in its uptrend that began in December of 2013. Since that time, the markets have proceeded in one of the longest stretches in history without a 10% correction or more. This is abnormal by any measure and has been a function of investor exuberance and continued hopes of ongoing Central Bank interventions globally.
The daily chart of the S&P 500 below clearly shows that the 150-day moving average has formulated the underlying support of the current bull trend. The break of that support this past October should have culminated in a much bigger decline. However, that V-shaped recovery back into the bull trend, spurred by Federal Reserve member Bullard’s comments and Japan’s expansion of its QE program, kept the overall momentum alive.”

…..read much more HERE

 When we think of investor fraud, many of us will automatically conger images of infamous stories such as Enron and WorldCom. While fraud can be very difficult to identify in foresight, if we adhere to a few fundamental rules, we can substantially reduce our susceptibility to the dangers of financial trickery and mismanagement of fiduciary duty.
Follow the Cash Flow
We have long been proponents of limiting investments to profitable companies. But when people hear the word profit, they automatically think of net earnings. The problem is that net earnings are an accounting figure
and can be subject to manipulation. Cash flow on the other hand, is less subject to misstatement. Often we will see companies that report a history of net profit on the income statement but routinely fail to generate cash flow on the cash flow statement. A significant and prolonged differential between accounting profit and cash flow is an indication of poor earnings quality. While this does not necessarily indicate outright fraud it should be viewed with skepticism.
Invest In What You Understand
The greatest investor of all time, Mr. Warren Buffett, routinely discusses his adherence to the “simple and understandable business” tenant as fundamental and to his investment strategy. He will not invest in any company that he does not fully understand. At times (notably during the dotcom bubble) he has been criticized for missing opportunities, but in the long run his focused discipline has made fools of his critics. More than just the business, it is also important to understand the financial statements. Highly complex financials with nebulous accounting items make it easier for unscrupulous managers to hide facts or inflate figures.
Don’t Overexposure Yourself to Speculative Regions
In the recent past, we have seen fraudulent activities and scandals uncovered in companies whose base of operations are in emerging markets – notably China. There are two issues at work here. One is that in emerging markets, the regulatory framework and oversight has not had as long to develop as it has in the developed world. Secondly, when a company’s operations are located entirely in emerging market, it makes it more difficult for our regulators to monitor them effectively. We are not trying to say that fraudulent activities are exclusive to emerging markets – they absolutely are not. But we do believe that structurally there is a greater chance that fraud can be developed and concealed at a larger magnitude and longer amount of time in the emerging world. For this reason, we strongly suggest that investors confine the majority of their activities to developed regions.
Read the Footnotes
Many investors, and even analysts, confine their analysis strictly to the financial statements (income statement, balance sheet, and cash flow statement) and ignore the financial footnotes. However, the financial footnotes, which are typically provided after the financial statements, provide a wide range of information and clues about the assumptions and policies used by management (e.g. revenue recognition, depreciation and amortization policy, treatment of derivatives, off balance sheet items, financial covenants, etc). Understanding the information beneath the headline numbers makes those numbers more meaningful and allows the investor to develop a better comparison amongst companies in the same industry. It is also a little known fact that if a management team is trying to hide a piece of information then they will probably put it in the middle or at the end of a long document. Remember… if these notes are impossible to understand then maybe you should question whether or not this is a company you want to invest in.
Diversify your Stock Holdings
For most typical investors, diversification may be the best defense against fraud. The fact of the matter is that fraud does exist in the world of investing and it can be extremely difficult to uncover. By spreading your capital amongst a group of quality companies that adhere to these principles you substantially reduce your susceptibility to both fraud and poor financial performance. This is not to say that we think investors should over diversify into dozens of companies. Such a strategy could make your portfolio unmanageable. But we do strongly suggest that you hold enough companies so that your overall success does not hinge on one or two individual stocks – no matter how good they may look.


In all that has happened over the past 7 years, in all the trillions that have been wasted to re-inflate asset bubbles worldwide, the Canadian stock market still remains below its June 2008 cyclical peak. What’s more….
Investors Intelligence: “Despite the indexes still trading near record levels there was a further contraction in advisor optimism and even some new bear projections. While index highs could be retested medium term investors should be cautious after the recent lofty readings for the bulls.
The index selloff to lows on 6-May caused a new contraction for the bulls to 47.5%. It was 52.5% and 57.4% the prior two weeks. That latter reading almost hit historic danger levels suggesting many advisors were near fully invested. Bulls above 50% show elevated risk and that has persisted since Nov-14 with only a few weeks of exceptions.
Sentiment Chart
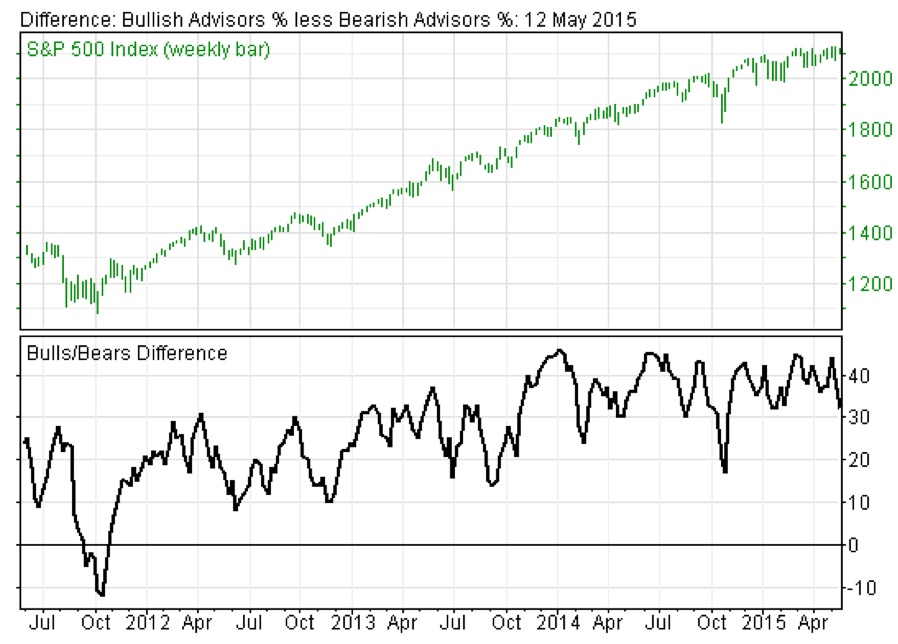
There was a small increase for the bears at 15.8%, up from the 2015 low a week ago at 13.9%.
The spread between the bulls and bears further contracted to 31.7%, down from 38.6% a week ago. It is also down 11.8% from the 43.5% difference before that, a dangerously high reading last seen late Feb. Differences over 30% are a worry and above 40% signal major caution. Bears haven’t outnumbered bulls (a negative spread) since Oct-2011. IMPORTANT – To subscribe to Investors Intelligence CLICK HERE.
***ALSO JUST RELEASED: Gerald Celente – This Historic Move By China Will Have Massive Global Ramifications CLICK HERE.
The big disconnect in the US stock market just keeps getting bigger.
A new Bank of America Merrill Lynch survey published Thursday finds that US investors have pulled $99 billion out of equities year-to-date — including net outflows in 11 of the past 12 weeks — despite stock prices continuing to break record highs.
This week also saw the biggest outflows from equity ($17.2 billion) and high-yield bond funds ($2.6 billion) this year. This data follows a similar report from BAML last month that showed investors pulled $79 billion from the stock market this year and nine of 10 weeks to that point.
As this imbalance grows, Bank of America writes, so does the risk of something we haven’t seen in the market in years: a correction.

Bank of America Merril Lynch
SEE ALSO: Unemployment rate falls to 5.4%
NOW WATCH: How to invest like Warren Buffett

-
I know Mike is a very solid investor and respect his opinions very much. So if he says pay attention to this or that - I will.
~ Dale G.
-
I've started managing my own investments so view Michael's site as a one-stop shop from which to get information and perspectives.
~ Dave E.
-
Michael offers easy reading, honest, common sense information that anyone can use in a practical manner.
~ der_al.
-
A sane voice in a scrambled investment world.
~ Ed R.
Inside Edge Pro Contributors

Greg Weldon

Josef Schachter

Tyler Bollhorn

Ryan Irvine

Paul Beattie

Martin Straith

Patrick Ceresna

Mark Leibovit

James Thorne

Victor Adair