
Stocks & Equities
If you knew (or thought) a bear market in stocks was just around the corner, would you prefer to be invested in 100% stocks or 100% bonds? Since the S&P 500 lost over 50% in the last two bear markets (2000-2002 and 2007-2009), the answer is easy. Therefore, we can learn something about the market’s tolerance for risk by monitoring the ratio of stocks to bonds.
Dot-Com Yellow Flag
Since the aggregate bond ETF (AGG) was not trading in 1999, we will use the highly correlated Vanguard Total Bond Market Fund (VBMFX) for this exercise. The chart below shows the performance of the S&P 500 relative to a diversified basket of bonds. Since some investors became concerned about the sustainability of the dot-com bubble in late 1999, the demand for stocks started to wane relative to bonds, which was indicative of increasing concern about stocks and the economy (see slope of orange line below).

Financial Crisis Warning
The same “risk-on vs. risk-off” logic can be applied to the stock market peak in October 2007. The ratio peaked 5 months before the S&P 500 (compare slope of orange and green lines below).

How Does The Same Ratio Look Today?
Rather than waving “be careful with risk” flags in 2015, the same stock/bond ratio posted a new monthly closing high in February. The blue and red moving averages also look much healthier in 2015 than they did in the higher-risk stages of 2000 and 2007.

Investment Implications – The Weight Of The Evidence
Do the charts above provide an “all clear” signal for stocks? No – the present day stock/bond ratio simply tells us the probability of a new bear market kicking off in the next several weeks is quite a bit lower than it was in March 2000 or October 2007. Since the ratio studied here is not foolproof, our market model uses a wide array of inputs. A February 27 video covers the concepts above, as well as other risk measures, in more detail.

A new milestone for the bull market in stocks was passed this week as the technology-heavy Nasdaq Composite Index closed above the 5,000 level for the first time in 15 years.
The last visit above this level was on the way down for the Nasdaq in March 2000 as the tech bubble burst. The Nasdaq went on to lose an astonishing 90 percent of its value in just two years.
Inevitably there have been scores of comparisons this week between “then” and “now” for the Nasdaq, and times have indeed changed.
Back in 2000, the Nasdaq was priced at more than 500 times profits … profits that would prove illusory when earnings collapsed during the tech-wreck bear market that followed.

Fifteen years ago, only 68 of the 100 largest Nasdaq stocks had profits, the rest traded on metrics such as “clicks”
“page-views” or “eyeballs.” Ah, those were the days: Who needs profits when you have unlimited possibilities?
Today, the Nasdaq Composite is trading at just over 30 times trailing earnings, and only 21 times this year’s expected profits; not much higher than the “old-economy” stocks in the S&P 500 Index trading at 17 times estimated earnings. Today’s valuation may be a bit on the high side, but certainly no signs of “irrational exuberance” at present.
What’s more, Nasdaq companies earn a higher valuation today because aggregate earnings for the index are poised to grow 49 percent over the next 12 months.
The most valuable company in the Nasdaq today, Apple (AAPL) is priced at just 14.4 times profits, which seems quite reasonable when you realize AAPL profits have grown more than 30 percent over the past five years.
Here’s another AAPL fun-fact to ponder. Shares have soared 73.7 percent over the past year, and last week AAPL’s market cap surpassed $770 billion — larger than the market cap of ALL the stocks listed in the S&P Small Cap 600 Index, combined!
That may seem somewhat irrational but it shows just how far some of Nasdaq’s leading stars have come since the dark days of the tech-wreck almost 15 years ago.
This fact also points out the opportunity in small-cap technology shares, new up-and-coming companies that have bright futures ahead, and yet look quite undervalued today compared with tech titans like AAPL.
In fact, small-cap tech shares have slightly outperformed larger tech companies in the S&P 500 Index so far this year, perhaps because that’s where cheaper valuations and the best opportunities can be found.
As my colleague Jon Markman will attest, there are plenty of dynamic new technology developments on the horizon. Many of them will be pioneered by as yet unknown small cap technology companies, stocks that have the potential to become the AAPL of tomorrow.
Good investing,
Mike Burnick
A possible 3PDh formation can be seen on the Dow Industrials index chart. The peaks in Dec’13, July’14, and Sept’14 are the three peaks. At 9mo, the distance between peaks one and three meets Lindsay’s requirement that they be no more than 10mo apart.

The Sept/Oct. decline is the separating decline and is the only weak park of the formation. Lindsay was adamant that there be a base composed of two tests of the low. If the base was descending (lower lows), it indicated a longer than normal domed house. If the base was ascending, it indicated a market that was in a hurry to get to its final high. In this case there is no base. If we remind ourselves that history rhymes but it doesn’t repeat, we can think of the Oct rally as more closely resembling an ascending base. In this case we need to count the 222-day interval from the low of the separating decline. This count points to a final high for the bull market near May 25.
I’m willing to accept a missing base as the formation does contain the requisite five-wave reversal(first floor roof) in January (see roman numerals).
A 107-day interval (from the 2/2/15) low counts 112-days to May 25.
If the hybrid forecast for a low on Mar. 30 is correct, that will set up a low-low-high interval of 56 days pointing to a top on May 25.
A high in May matches the 35wk cycle high expected then.
Caveat: A Domed house at the top of a bull market seldom lasts as long as a formation that begins at a bear market low. Also, an ascending base reflects a market that is in a hurry to get to the top. These counts may be pointing the right shoulder of the domed house.

About the Author: Ed Carlson
Ed Carlson, author of George Lindsay and the Art of Technical Analysis, and his new book, George Lindsay’s An Aid to Timing is an independent trader, consultant, and Chartered Market Technician (CMT) based in Seattle. Carlson manages the website Seattle Technical Advisors.com, where he publishes daily and weekly commentary. He spent twenty years as a stockbroker and holds an M.B.A. from Wichita State University.

In This Week’s Issue:
In This Week’s Issue:
– Stockscores’ Market Minutes Video – Understanding Corrections
– Stockscores Trader Training – The Best Trades Are Not Hard to Find
– Stock Features of the Week – Abnormal Activity
Stockscores Market Minutes Video –
It is important to understand why market corrections happen and some of the early signs that one is imminent. This week, I explain how to spot a correction plus do my regular weekly market analysis.Click here to watch
Trader Training – The Best Trades Are Not Hard to Find
Traders, particularly those who need to make money rather than those who would like to make money, tend to have a fear of missing out. They hear about a trading idea or find an opportunity with their own effort and make the trade with less thought than they might put into buying a microwave. They can invest thousands of dollars on an impulse, much like the drunken gambler who throws down $1000 on Five Red.
One reason for this sort of reckless approach to trading is the belief that trading ideas are like gifts. They only come along from time to time and you should feel grateful for the opportunity. If you spend 10 hours researching a company or receive the occasional bit of insight from someone who should know more than the rest of us, it’s easy to understand why you wouldn’t want to let a seemingly promising trade slip through your fingers. The problem is that this gratitude for trading ideas leads you to lower your standards and place trades that are not much more than a gamble.
Have you ever made a trade and then, just a few minutes or days later, asked yourself what the heck you were thinking? If you are normal, then it’s likely that you have because it is easy to focus on the dream of making a profit. You should focus your attention on the trading situation as it has been presented to you by the market rather than the words of an expert. Some trading opportunities are so well marketed that it’s hard to see the truth because you fixate on the profit potential that has been dangled before you as the prize.
It is critical to only take trades that meet the criteria of a strategy that you have found to have a positive expected value. Rather than look for a reason to take the trade, which is easy, look for a reason not to. Ask yourself, “If I buy this stock, who will be selling to me, and what does she know that I don’t know?” Looking at the other side of the argument will often highlight considerations that you have missed.
Being fussy is a lot easier when you recognize that the market-even a slow market-will give you opportunities. The markets have been pretty quiet this year but there are still stocks outperforming the market every day.
And if you can’t find a trade today, tomorrow or in the next week, eventually you will. There is always another bus coming down the road. If you miss one, just wait for the next.
I have found that you will actually make more money by trading less. If you maintain a very high standard for what trades you make, you will always pass on some trades that end up doing very well. By being selective, however, you will also avoid many marginal trades that would tie up your capital and then incur a loss. By being fussy and trading less, you end up taking only the very best trades and your results will be better overall.
It is easy to be fussy when the market is strong and there are lots of opportunities. It’s like fishing when every time you cast your line you get a bite. With that kind of success, you will quickly throw back any fish that is too small because you know there’s going to be something better coming along soon. You only take the best of the best.
When the fish stop biting and you spend hours with no bounty, you take the first fish that grabs your hook. It could be a tiny fish that you would never keep on even an average day, but with your desire to catch something, you keep it anyway. It would be better to have just not gone fishing at all.
You’ll do the same thing when trading a slow market. Eager to make a profit, you will take trades that show some potential even if they don’t meet all of your requirements. You will work hard to uncover a trade rather than wait for the obvious no-brainer trades that you take when the market is in a giving mood.
I like to say that in trading, when the going gets tough, the tough get lazy. You can’t control the market, so if the market is not giving you opportunities, it’s better to do nothing. Your hard work will not change what the market does.
This is hard for many people who have been programmed to relate hard work to success. If you try harder than the next person in a sport, you should get a better result. If you study harder for an exam, you should get a better mark. If you work longer hours at your job, you should make more money. In the stock market, if you work harder to find good trades, you will probably lose money.
The best trades are easy to find. Working hard to uncover something leads you to find questionable trades that you have to talk yourself into. It’s better to walk away when you have doubts.
This is not to say that hard work is not rewarded in trading. Traders who work hard at practicing their analytical skills or developing new strategies will be rewarded. People who devote their time and effort to improving their emotional control will be better traders. These are things that you can control and affect with hard work, but hard work won’t change what the stock market does.
![]()
Where there is smoke, there is fire. Stocks that make an abnormal price gain with abnormal volume after a period of generally complacent trading are often set to start a new trend. This week, I scanned the market for stocks trading abnormally using the Stockscores Market Scan and found the following stocks that have good potential.
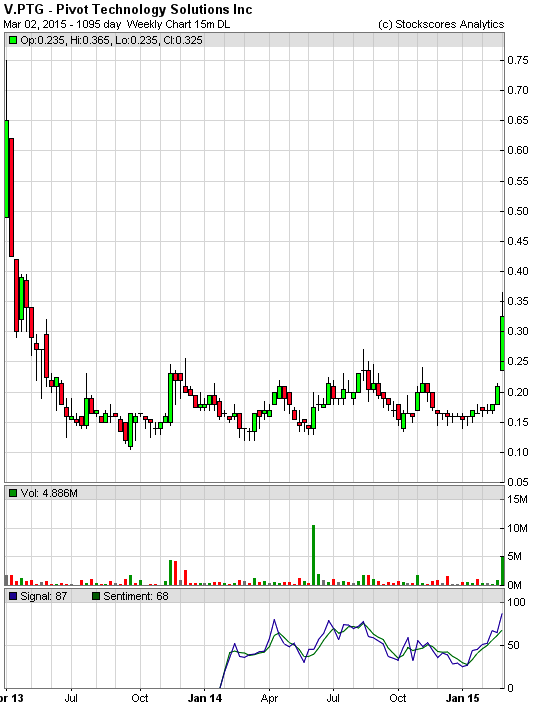
1. V.PTG
V.PTG has been trending sideways for two years but came alive with very strong volume and price action today indicating the market has found something to be excited about. Support at $0.19.
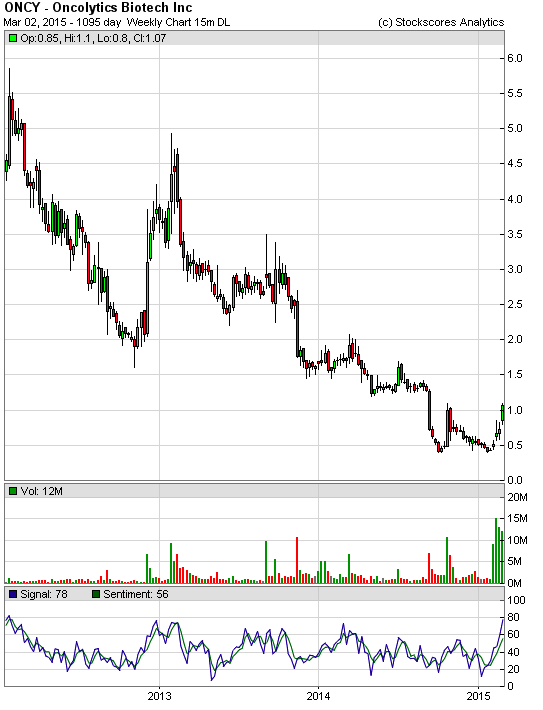
2. ONCY
ONCY (T.ONC) made a big break higher today that broke the long term downward trend line. This is a good sign that the downward trend is over but it could take time for the stock to build upward momentum. The abnormal activity today is a sign that the buyers have taken an interest in the stock again. Support at $0.57.
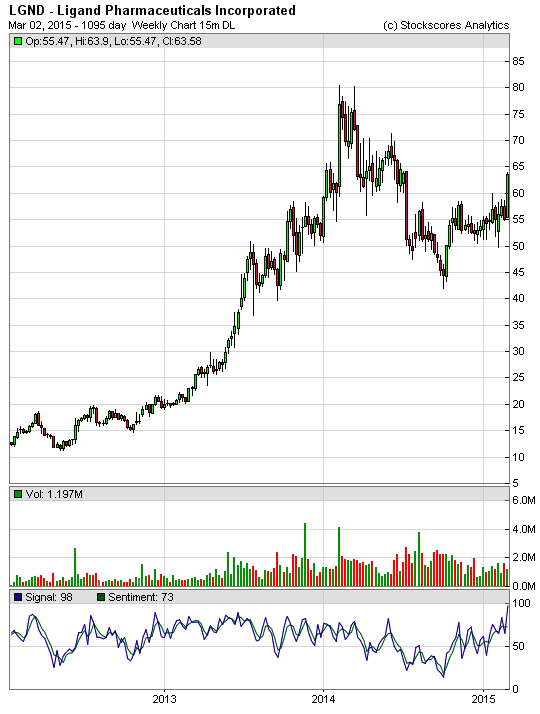
3. LGND
LGND went quiet for the last year after being very strong in 2013. This week, it is breaking higher from a decent pattern and appears to be starting the resumption of a long term upward trend. Support at $55.
References
- Get the Stockscore on any of over 20,000 North American stocks.
- Background on the theories used by Stockscores.
- Strategies that can help you find new opportunities.
- Scan the market using extensive filter criteria.
- Build a portfolio of stocks and view a slide show of their charts.
- See which sectors are leading the market, and their components.
Disclaimer
This is not an investment advisory, and should not be used to make investment decisions. Information in Stockscores Perspectives is often opinionated and should be considered for information purposes only. No stock exchange anywhere has approved or disapproved of the information contained herein. There is no express or implied solicitation to buy or sell securities. The writers and editors of Perspectives may have positions in the stocks discussed above and may trade in the stocks mentioned. Don’t consider buying or selling any stock without conducting your own due diligenc
 After a brief respite during December and January, the bull market has now reconfirmed its bullish trend. Buy signals are back in place and my recent moves to fully increase exposure in the portfolio model in advance of the recent breakout are performing well.This week I am going to review the current technical status of the market to provide a better understanding of the risk/reward that currently exists in the markets.
Importantly, just because I am discussing the resumption of the “bullish” trend in the market, it does NOT mean there is NO RISK of a meaningful and crippling mean reverting event in the near future.
You should remember that when you are investing there is NO SUCH THING as LONG TERM. All you have as an investor is the capital that you are speculating with today and the time you have until you need it. Investors have lost almost 6-years of their investment time horizon simply “getting back to even” following the last market decline. While the capital has been recovered, the time lost can never be. This is why so many retirees are now unprepared to retire which explains why the number of individuals over the age of 64 is at the highest level on record.
When you are told “you are a long term investor” and you should just “hold” investments for an indefinite period it suggests one of two things: 1) It is due to laziness; or 2) there is no real understanding of how to invest or control risk.


-
I know Mike is a very solid investor and respect his opinions very much. So if he says pay attention to this or that - I will.
~ Dale G.
-
I've started managing my own investments so view Michael's site as a one-stop shop from which to get information and perspectives.
~ Dave E.
-
Michael offers easy reading, honest, common sense information that anyone can use in a practical manner.
~ der_al.
-
A sane voice in a scrambled investment world.
~ Ed R.
Inside Edge Pro Contributors

Greg Weldon

Josef Schachter

Tyler Bollhorn

Ryan Irvine

Paul Beattie

Martin Straith

Patrick Ceresna

Mark Leibovit

James Thorne

Victor Adair