Stocks & Equities

Stock Trading Alert: Stocks Extended Short-Term Fluctuations Along Record Levels – No Weakness Yet

Briefly: In our opinion, speculative short positions are favored (with stop-loss at 2,150 and profit target at 1,980, S&P 500 index)

Our intraday outlook is now bearish, and our short-term outlook is bearish:

Intraday outlook (next 24 hours): bearish
Short-term outlook (next 1-2 weeks): bearish
Medium-term outlook (next 1-3 months): neutral
Long-term outlook (next year): bullish

The U.S. stock market indexes were virtually flat on Wednesday, as investors continued to hesitate following last week’s rally. The S&P 500 index remains relatively close to its Tuesday’s all-time high of 2,101.30. The nearest important resistance level is at around 2,100. On the other hand, level of support is at 2,070-2,080, marked by some previous local highs, among others. There have been no confirmed negative signals so far. However, we can see overbought conditions accompanied by negative technical divergences:

36718 a

Larger Image

Expectations before the opening of today’s trading session are virtually flat. The main European stock market indexes have been mixed so far. Investors will now wait for some economic data announcements: Initial Claims at 8:30 a.m., Philadelphia Fed, Leading Indicators at 10:00 a.m. The S&P 500 futures contract (CFD) extends its short-term consolidation, following last week’s move up. The nearest important resistance level remains at around 2,100. On the other hand, level of support is at 2,080-2,090, among others, as we can see on the 15-minute chart:

36718 b

Larger Image

The technology Nasdaq 100 futures contract (CFD) follows a similar path, as it extends its short-term consolidation along the level of 4,390. The nearest important resistance level is at 4,400 and support level is at 4,350-4,370, among others, as the 15-minute chart shows:

36718 c

Larger Image

Concluding, the broad stock market extended its short-term fluctuations on Wednesday, following last week’s rally. There have been no confirmed negative signals. However, we continue to maintain our speculative short position (2,099.16, S&P 500 index), as we expect a downward correction or an uptrend reversal. Stop-loss is at 2,150, and potential profit target is at 1,980. It is always important to set some exit price level in case some events cause the price to move in the unlikely direction. Having safety measures in place helps limit potential losses while letting the gains grow.

Thank you.

StockScores Weekly Perspective: Information Pitfalls

perspectives header weekly

perspectives commentary

In This Week’s Issue:


In This Week’s Issue:

– Stockscores Active Trader Webinar – Tuesday Feb 17 6pm PT, 9pm ET
– Stockscores’ Market Minutes Video – How Resistance Works
– Stockscores Trader Training – Information Pitfalls
– Stock Features of the Week – Flag Breaks on the Weekly

Stockscores Active Trader Webinar
Tuesday Feb 17 6pm PT, 9pm ET
Learn how the Stockscores Approach works for day and swing trading with this free, one hour webinar.
Click here to register

Stockscores Market Minutes Video – How Resistance Works
How price action behaves around resistance helps to determine whether a trend will evolve out of a breakout through resistance. This week, I explain how this works plus provide my analysis of the markets for the week ahead.Click here to watch

Trader Training – Information Pitfalls
In theory, information should make the stock market’s world go round. Information about companies and their ability to make money in the future is what should determine share price. As the market learns of new information, price is adjusted up and down to reflect the value of that information.

This implies that investors should focus their analysis on information so they can predict where share prices should go in the future.

While this makes good sense, I have found it to be extremely rare that investors who use information are able to consistently beat the stock market. With smaller retail investors (you and I) in particular, the use of information for making investing decisions is more destructive than it is beneficial. Here are ten reasons why:

1. Information is Usually Already Priced In – most investors use publicly available information. That means it is widely known and available to anyone considering the stock. If information is available to a large number of investors then we should expect that the market will have priced that information in to the stock. Therefore, the information has not value to us.

2. Information Usually Comes with a Bias – as a general rule, people do what they are financially motivated to do. If someone is encouraging you to purchase a stock, there is a good chance that they have some financial motivation to do so. Before you trust the information you receive, understand the financial motivation. If you find the reason, you will often usually find that there is a strong bias in the information being provided to you.

3. Trading on Truly Insider Information is Illegal – there are few risk free trades in the stock market, but trading on significant, inside information is one. You stand to make a lot of money buying stock in a company that will be acquired by another at a premium tomorrow. If you have that information and act on it, you are trading on inside information and that can land you in jail.

4. Gathering Good Private Information is Expensive and Time Consuming – there are investors who are able to uncover information that is not priced in to a stock but is not considered inside information. This private information is valuable because it can lead to market beating returns. However, gathering private information typically requires significant resources, knowledge and time. For small investors, it is not feasible to do this kind of work across a broad range of stocks.

5. Information Causes You to Ignore the Market’s Message – when you have an understanding of a company’s story, there is a tendency to fall in love with that story and ignore new information that goes against your outlook for the stock. This leads the committed shareholder to hang on to a losing position, allowing the loser to bog down the performance of the overall portfolio.

6. You May Not Have All of the Information You Need – the market tends to focus on two or three key information points that affect the price investors are willing to pay for it. An investor who does a thorough fundamental analysis of the stock may still have an incomplete understanding of the company’s business. If missing one of the key points, this investor can make a gross error in valuing the stock.

7. The Market May Not Be Trading On Fundamentals – in theory, stock price is based on the present value of future earnings expectations. In practice, there are often very non fundamental influences on share price. A large investor that has a liquidity crisis may be forced to unload a large position with little regard for price. Often, the laws of supply and demand affect share price even though theory tells us that they should not have an influence.

8. Your Interpretation May Not Be the Same as The Market’s – Our mood affects how we judge information and the same can be said for the market in general. Your fundamental analysis may be correct in an optimistic environment, but if the market is in a pessimistic mood, the investment can lead to losses. Even the market is wrong, it is right.

9. There Is No Standard for What Information is Worth – There are many formulas for determining what a company’s share price should. Many fundamental analysts look for stocks to trade at a certain multiple of their earnings with that multiple to be based on growth. However, there are great variations in accounting methods that can have a profound effect on how earnings are reported. More importantly, there is no rule that a company should trade at a certain multiple of earnings, that target multiple is just an opinion.

10. We Tend to Focus On Information That is Easy to Get – we often looks for the easiest way to achieve a goal. With information, there is a tendency to focus on the information that is front of us. Rather than work to find something to disprove our thesis on a stock, we instead look for information to strengthen our thesis. In doing so, we present our own biased outlook for our investment decisions that can often be very incomplete and wrong.

Ultimately, I look at the market’s interpretation of all available information when I look at a chart of price and volume. It shows not only every bit of information detail but also what the market thinks of it.

perspectives strategy

This week I ran the Stockscores Simple Weekly Market Scan but I went in search of flag pattern breaks. A flag pattern is an uptrend continuation pattern where there is a break higher after a short pull back. It allows for risk management at the low of the pull back and has a high probability of success because there is strong momentum in the chart. I day trade these patterns daily but they are also worth considering on the longer term weekly chart.

Here are two stocks in strong upward trends that made flag breaks last week:
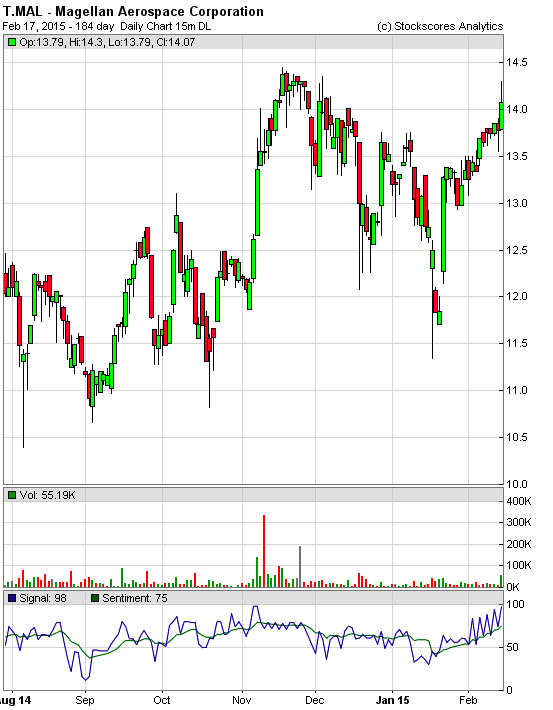
perspectives stocksthatmeet

1. T.MAL
T.MAL moved up well over the past week and has defined support at $12.90. It may stall at the old highs of $14.40 but the long term trend is strong and up.
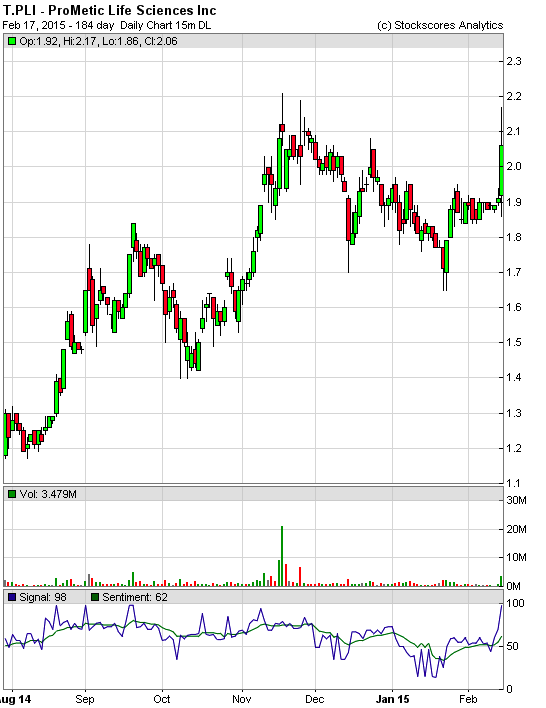
Screen Shot 2015-02-17 at 6.47.04 AM

2. T.PLI
T.PLI made a strong break on Friday but was halted before the close. The long term chart is showing a good flag break but wait to see how it opens after it resumes trading, a big gap up could hinder the reward for risk of the trade. Support at $1.82.

Screen Shot 2015-02-17 at 6.48.40 AM

References


Disclaimer
This is not an investment advisory, and should not be used to make investment decisions. Information in Stockscores Perspectives is often opinionated and should be considered for information purposes only. No stock exchange anywhere has approved or disapproved of the information contained herein. There is no express or implied solicitation to buy or sell securities. The writers and editors of Perspectives may have positions in the stocks discussed above and may trade in the stocks mentioned. Don’t consider buying or selling any stock without conducting your own due diligenc

Bull Trend Salvaged?

Screen Shot 2015-02-16 at 6.21.10 AMAfter a couple of rough months in the markets where volatility rose quite dramatically, it now seems as if the bull trend will remain intact at least for a while longer.

It is interesting to note that despite the geopolitical risks (Russia, Iran), financial risks (Greece) and rapidly deteriorating economics and earnings, that the market has sustained only a 3%ish correction over the last couple of months.

This is, of course, due to the extreme level of complacency in the markets like the “irrational exuberance” witnessed in the late 90’s.  Now, like then, the level of overconfidence can last for quite some time and should not be underestimated.

What is important to understand, is “when” the eventual correction comes there will be no safe place to hide. In the coming financial reversion, the only save place will be in “cash.”

DO NOT misunderstand me. I am not suggesting that the world is about to end economically and that all you should own in gold, ammo and a can of “beanie-weenies.”

……Read more here

Three Technical Signs to Watch for a Major Peak in Stocks & Impending Bear Market

It is said that an image is worth a thousand words. This chart conveys a very important message when it comes to the future direction of the stock market and whether investors should be concerned about a coming bear market. We explain the chart in more detail below.

Larger Image

technical-signs-bubble-bear-market


In the very top panel of the chart you’ll notice that the stock market as measured by the S&P 500 is overbought on a long-term basis. This is no surprise and shows that we are now trading at levels seen during the two prior bubbles. That said, the stock market can remain in overbought territory for an extended period of time, which is why we need to focus on more timely signals for when this condition may reverse.

One

The first technical warning sign that we should heed is marked by a significant divergence between the relative strength index (RSI) and the market itself. This is noted by a declining pattern of lower highs in the RSI as stocks continue to make higher highs, a sign that the market is “topping out”. In the late ‘90s this divergence persisted for around two years each time the market pushed higher and began to signal alarm starting around 1998. In 2007 this divergence took place over a much shorter period (around six months) before the market finally succumbed to massive selling. Starting around late 2013 we’ve seen the RSI flatten while the market has pushed higher. At this point, it will be important to monitor whether this divergence is resolved or confirmed in subsequent moves. Again, such a divergence can persist for longer than expected (as in the late ‘90s), but does raise a red flag and indicate the market is in a topping process.

Two

The second technical sign to look for is a major crossover in the MACD (moving average convergence-divergence) indicator shown in the bottom panel. This is often used by technical analysts as a buy and sell signal. As Investopedia explains, “when the MACD falls below the signal line, it is a bearish signal, which indicates that it may be time to sell.” As shown by the dotted lines, a MACD crossover occurred in May of 2000 and December of 2007. Currently, the MACD is close to giving a crossover sell signal and will likely do so if the market again breaks below its 12-month moving average. That brings us to the third technical signal.

Three

When a major line of support becomes resistance, you now have confirmation of a trend change in the market. This occurred around January-February of 2001 and May-June of 2008 (see red circled regions on the chart) when the S&P 500 failed to break back above its 12-month moving average. After that point in time, the market persisted in a bearish downtrend until a confirmed change of direction with a new bull market. Currently, the market is trading above this major line of support but did briefly break below in October of last year.

Summary

The market is overbought and showing signs of divergence, which may indicate a market peak. Since this condition can persist, we will want to confirm whether any subsequent highs (if they occur) coincide with lower RSI readings. Secondly, we will want to see a major sell signal triggered by a crossover in the MACD, as occurred at both prior tops in 2000 and 2007. Thirdly, it will be important to confirm a major trend change in stocks when the 12-month moving average no longer acts as support, but now becomes a line of major resistance.

Again, we should not presuppose this pattern will play out on an immediate timeframe. The market may make new highs and remain in overbought territory longer than anticipated. As always, opinions are quite divided on whether stocks are already in a bubble or, conversely, in the beginning stages of a much larger advance. There are too many moving parts to predict such outcomes with any certainty. Instead, we must monitor market action, incoming data, and make adjustments as the situation requires. The chart presented is one of many tools for doing just that.


The end of the 1-year sideways trend

Investors are starting to feel numb by the lack of action in the broad market.  Since December, the Dow and SPX have settled into sideways trading ranges.  The NYSE Composite (NYA) has been range-bound since last summer while the Russell 2000 (RUT) has been stuck in a lateral ranges for the past year.  While trading ranges don’t necessarily result in the loss of capital, its effect on the minds of market participants tend to be significant.  Trading ranges are frustrating.  When trading ranges become established over a period of months the effects upon investor and mass psychology can even be devastating. 
 
Consider that some of the most devastating social, political and military revolutions in history have occurred during prolonged periods of stagnation in both the economy and the equity market of the countries concerned.  Human nature is dynamic and demands continual movement – whether in the form of progress or even regress.  A long period of stagnation where neither progress nor regress is seen has a profound impact on the human psyche in the aggregate and can lead to psychosis if the stagnation continues for very long.  
 
There is also the effect of the trading range to consider upon the mind of the individual.  The celebrated stock trader Jessie Livermore is a case in point.  After making a fortune selling short the stock market prior to the 1929 crash, he found himself at the mercy of the dull market conditions of the late ‘30s and early ‘40s and was unable to make his accustomed living from the market.  He ended his life by blowing his brains out in a hotel coat closet in 1940.  
 
Trading ranges also tend to be characterized by increased volatility.  It’s easy to be fooled by the periods of increasing market volatility during the times when stocks are visiting the lower end of the trading range.  Many (falsely) assume that the volatility spikes mean that the market is primed for a bear market.  But periodic volatility spikes are part and parcel of any drawn out sideways movement in the major indices and nothing can be inferred by the temporary rallies in the Volatility Index.
 
It’s certainly understandable that investors, particularly small-cap investors, are feeling frustrated right now.  After all, they’ve had to sit through more than a year of seeing their portfolios going virtually nowhere, if the Russell 2000 chart is any indication.  It’s no wonder that active participation among retail traders has dwindled in the last several months.
 
rut
 
Trading ranges serve a distinctive purpose, however, and they tend to be beneficial for the longer-term health of the stock market.  Sideways trading ranges can either represent distribution (i.e. informed selling) or else accumulation (buying).  More often than not, they represent a period of consolidation for a bull market that has over-exerted itself and needs rest.  Lateral trading ranges typically serve as an intermission before the next phase of the bull market.  As a rule, the longer the duration of the range, the more powerful the subsequent rally tends to be.
 
A good example of a trading range year which gave way to a solid breakout performance for stocks occurred 10 years ago.  Below is a chart of the Dow 30 index.  Note the overall lateral trading pattern for much of that year.
 
2005
 
Here is how the Dow resolved that range in 2006.
 
2006
 
This is not to say that stocks will spend most of 2015 in a sideways trading range.  As we talked about in the 2015 forecast edition, there are several likely inflection points this year for tradable trends – possibly lasting 2-3 months at a time.  Another point worth mentioning: unlike in 2005, the longer-term yearly cycles are up, not down.
 
This brings us to the ultimate question: when will the current trading range period for the stock market finally end?  That question is very much an open one for which the market hasn’t yet provided an answer.  However, the indicators suggest that a breakout attempt above the trading range ceiling will likely be made in this quarter.  Moreover, the odds strongly favor of an upside resolution to the lateral trading range by mid-year by virtue of this being: a.) an up year in the alternate 2-year cycle; b.) a Year Five Phenomenon year; and c.) a year when the Kress yearly cycles all kick in to the upside. 

Mastering Moving Averages

The moving average is one of the most versatile of all trading tools and should be a part of every investor’s arsenal.  The moving average is one of the most versatile of all trading tools and should be a part of every investor’s arsenal.  Far more than a simple trend line, it’s a dynamic momentum indicator as well as a means of identifying support and resistance across variable time frames.  It can also be used in place of an overbought/oversold oscillator when used in relationship to the price of the stock or ETF you’re trading in.  


About Clif Droke:

is a recognized authority on moving averages and internal momentum. He is the editor of the Momentum Strategies Report and Gold & Silver Stock Report newsletters, published since 1997.  He has also authored numerous books covering the fields of economics and financial market analysis.  His latest book is “Mastering Moving Averages.” For more information visit www.clifdroke.com