
Stocks & Equities
As we commented last Wednesday, this close up view of the VIX is showing a triangular pattern that has morphed into a secondary triangular pattern.
Yesterday, the VIX closed at 17.33 which was inside the new triangular formation, but with an up and down breach of the prior formation.
The medium term negativity has not been erased yet because we still have July to January up trend … so that means go forward with trepidation.

About Marty Chenard
Marty Chenard is an Advanced Stock Market Technical Analyst that has developed his own proprietary analytical tools and stock market models. As a result, he was out of the market two weeks before the 1987 Crash in the most recent Bear Market he faxed his Members in March 2000 telling them all to SELL. He is an advanced technical analyst and not an investment advisor, nor a securities broker.


In This Week’s Issue:
– Stockscores’ Market Minutes Video – Short Term Outlook
– Stockscores Trader Training – Changing the Chart Time Frame
– Stock Features of the Week – Gold Breakouts
Stockscores Market Minutes Video – Short Term Outlook
The shorter your forecast outlook, the shorter the time frame of the chart you study. This week, Tyler applies his analysis of the markets in a shorter term time frame with an outlook for where the markets will go next week.
Trader Training – Changing the Chart Time Frame
Stock chart analysis is becoming more and more popular every day; investors are realizing that the chart is a graphical representation of what thousands of investors believe about a stock and is often more reliable than the opinion of just one person’s fundamental analysis.
The problem is that there is a lot of incorrect chart analysis happening and one of the most common mistakes I see is the use of the wrong chart for making a decision.
Do you look at monthly, weekly, daily, hourly or even minute by minute charts when doing chart analysis? The answer should be motivated by the type of investor you are.
A long term trader, someone trying to maximize the return of their long term retirement portfolio should not get too caught up in the day to day gyrations of the market. It is the big picture trend of the market that should matter the most, making the gain or loss for the stock or the overall market on a single day quite irrelevant to the trading decision.
On the other end of the time frame spectrum are the day traders who should really be concerned with what is happening on the 2 minute, 5 minute or 15 minute charts. For the short term trader, these time frames are the most relevant and yet the decisions of many short term active traders are swayed by the headlines they read about big macro economic issues that could affect the long term direction of the market. The level of debt that the US Government has does not have a lot of relevance to what a hot bio tech stock is going to do over the next day.
On Stockscores.com, it is possible to set the default time from of the charts you look at to suit your trading time horizon. If you are a long term trader, set the default to a three year weekly chart. Medium term? Focus on the daily chart. A swing trader can set his or her default time frame to the 15 minute time frame.
Doing this is relatively simple.
- First, pull up the chart for any stock by entering the symbol in the upper right corner of the site. Remember that Canadian symbols need a prefix, T. for the TSX and V. for the Venture.
- Go to the charting tab, this is either beside the small chart view or below the large chart view.
- Make sure that the chart type is set to Quick.
- Set the interval to the time frame that suits you.
- Set the lookback period. I like to look back as far as possible without having the resolution of the chart degraded.
- Click on Create Chart
This has now established a new chart default which will remain as your default each time you log in using that computer. If you use a different device, you will have to reset the chart settings on that machine as well.
While it is important to focus on the time frame that suits your style the best, it is also wise to look at other time frames for confirmation. A person focused on the daily chart should check the weekly and the hourly for confirmation. A day trader may be focused on the two minute but a quick check of the 15 minute and daily will be helpful as well.
You can do that using the fast time frame links that you will see at the top of the chart. Click on one of these to change the time frame quickly without changing default chart.
![]()
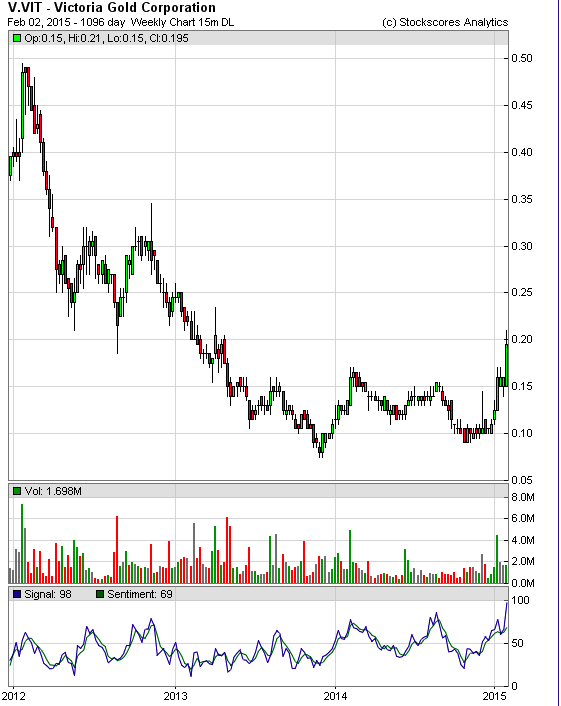
This week, I ran the Stockscores Simple Weekly Market Scan for the Canadian market in search of stocks that are in the early stage of an upward trend. There are many strong stocks which have been going up for some time. It is harder to find those that are just starting to break from a predictive chart pattern on the weekly chart. I found the best potential in a couple of Gold stocks, a sector that has been making a comeback so far in 2015.
1. V.VIT
V.VIT traded strong volume and made a good gain today, breaking it out through resistance going back over a year. This stock is not very liquid and highly speculative so smaller positions are only appropriate. Next level of resistance is at $0.30, support at $0.14.
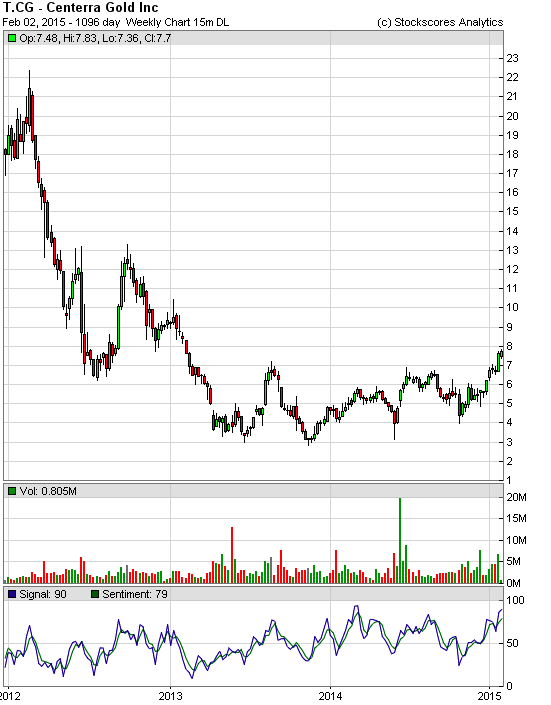
2. T.CG
T.CG broke through $7 resistance last week after a lengthy period of sideways trading and base building. Support at $6.60, resistance at $12.
References
- Get the Stockscore on any of over 20,000 North American stocks.
- Background on the theories used by Stockscores.
- Strategies that can help you find new opportunities.
- Scan the market using extensive filter criteria.
- Build a portfolio of stocks and view a slide show of their charts.
- See which sectors are leading the market, and their components.
Disclaimer
This is not an investment advisory, and should not be used to make investment decisions. Information in Stockscores Perspectives is often opinionated and should be considered for information purposes only. No stock exchange anywhere has approved or disapproved of the information contained herein. There is no express or implied solicitation to buy or sell securities. The writers and editors of Perspectives may have positions in the stocks discussed above and may trade in the stocks mentioned. Don’t consider buying or selling any stock without conducting your own due diligenc
Briefly: In our opinion, no speculative positions are justified.
Our intraday outlook remains neutral, and our short-term outlook is neutral:
Intraday outlook (next 24 hours): neutral
Short-term outlook (next 1-2 weeks): neutral
Medium-term outlook (next 1-3 months): neutral
Long-term outlook (next year): bullish
The U.S. stock market indexes lost between 0.8% and 1.5% on Friday, as investors reacted to economic data announcements, quarterly corporate earnings releases. The S&P 500 index is at its support level of 1,990-2,000. On the other hand, level of resistance is at around 2,020-2,025, marked by recent local highs. It still remains within three-month long consolidation, as we can see on the daily chart:
 Larger Image
Expectations before the opening of today’s trading session are slightly positive, with index futures currently up 0.2%. The main European stock market indexes have been mixed so far. Investors will now wait for some economic data announcements: Personal Income, Personal Spending, PCE Prices – Core number at 8:30 a.m., ISM Index, Construction Spending at 10:00 a.m. The S&P 500 futures contract (CFD) is in an intraday consolidation, following Friday’s decline. The nearest important level of support remains at around 1,980-1,985. On the other hand, resistance level is at 1,995-2,000, among others:

The technology Nasdaq 100 futures contract (CFD) follows a similar path, as it trades along the level of 4,150. The nearest important level of support is at around 4,130, marked by Friday’s local low, as the 15-minute chart shows:

Concluding, the broad stock market sold off on Friday, following some uncertainties, ending of the relatively volatile month, among others. It continues to look like a medium-term consolidation following last year’s October-November rally, however, the index trades at this consolidation’s lower limits. We still prefer to be out of the market, avoiding low risk/reward ratio trades. We will let you know when we think it is safe to get back in the market.
Thank you.
Briefly: In our opinion, no speculative positions are justified.
Our intraday outlook remains neutral, and our short-term outlook is neutral:
Intraday outlook (next 24 hours): neutral
Short-term outlook (next 1-2 weeks): neutral
Medium-term outlook (next 1-3 months): neutral
Long-term outlook (next year): bullish
The main U.S. stock market indexes lost between 0.6% and 1.4% on Wednesday, as investors reacted to FOMC Rate Decision release, among others. The S&P 500 index got closer to the level of 2,000, retracing most of its recent gains. The nearest important level of support is at 1,990-2,000, marked by previous local lows. On the other hand, resistance level remains at 2,050-2,065. For now, the broad stock market trades within its medium-term consolidation, as we can see on the daily chart:

Larger Image
Expectations before the opening of today’s trading session are positive, with index futures currently up 0.2-0.4%. The European stock market indexes have been mixed so far. Investors will now wait for some economic data announcements: Initial Claims at 8:30 a.m., Pending Home Sales at 10:00 a.m. The S&P 500 futures contract (CFD) is in a relatively narrow intraday consolidation, following yesterday’s sell-off. The nearest important resistance level is at 2,000, and support level is at 1,985-1,990, marked by local low:

Larger Image
The technology Nasdaq 100 futures contract (CFD) is in a similar intraday consolidation, as it fluctuates above the level of 4,100. The nearest important level of resistance is at around 4,130-4,150, among others, as the 15-minute chart shows:

Larger Image
Concluding, the broad stock market extended its sell-off yesterday, retracing most of January’s rebound. It continues to look like a volatile medium-term consolidation following last year’s October-November rally. We still prefer to be out of the market, avoiding low risk/reward ratio trades. We will let you know when we think it is safe to get back in the market.
Thank you.

ARTICLE OF THE WEEK
As Martin showed you in his Monday column, the world is a mess, a sorry state of affairs that is getting worse by the day.
This was all foretold by the cycles of war that I have been writing about for over two years now … cycles that show the world splintering apart, cycles that will not even come close to ebbing for another five years.
It’s the result of several different cycles coming together in time and space, and in a way that hasn’t been seen in at least 150 years. Since the 1860s, according to my research.
You have first, the Kondratieff Wave, a super economic cycle that peaked on cue in 2007/2008, a cycle that has been sped up by the impact of technology on the world — and a cycle which will not reach a bottom until 2025.
Symptoms: Slower business formation, debts going bad, plunging velocity or turnover of money and credit, and deflation, with a capital D.
You can see my graph of the K-wave here.

You have the Juglar Cycle, a cycle that tracks fixed investment by business, a cycle that also peaked with the real estate crisis and now points down into roughly 2025.
Symptoms: Slower business investment, a “risk-off” mentality by businesses, leading to slower job formation, slower spending and more.
You can see my chart of the Juglar Cycle here:

You have the Kitchen Cycle, discovered in the 1920s by Joseph Kitchen, a shorter cycle of 40-months, but also related
to the inventory cycle of commercial businesses. It also peaked during the real estate crisis, then plunged, then rallied into last year … and is now pointing down into 2016, followed by a bounce, then another decline into 2025.
You can see the chart here:

Symptoms: Like the Juglar Cycle, slower business formation, slower inventory turnover, lackluster employment growth, and more.
You have the Armstrong Economic Confidence Cycle, pointing to a major turning point this October. Marty Armstrong, a close friend of mine and to a very major degree, my mentor in cycles, says it will be a doozy, the beginning of a “Sovereign Debt Big Bang” — where the patently unplayable debts and IOUs of Europe, Japan and the United States all begin to crumble, right before our eyes.
Symptoms: Collapsing bond markets in Europe, the United States and Japan; soaring interest rates, and more.
You have the Kuznets Cycle, discovered by Simon Kuznets, an approximate 18-year cycle that vacillates between periods of low and high income inequality.
It bottomed in 2013, showing that despite government efforts to redistribute wealth, income inequality, not just in the United States but almost everywhere, will get much worse in the years ahead and not reach a climax until 2025.
Symptoms: Rising social discontent, class warfare, rising attacks on the rich, rise of third-party neo-Nazi groups, and more.
You can see my chart of the Kuznets Cycle here:

The thing is, income inequality normally declines during recessions and rises during booms.
Yet during this turn of the cycle, we’re seeing the opposite: Income inequality is rising during a period of slow global economic growth. So if you think income inequality is bad now, fasten your seatbelts. According to the Kuznets Cycle, it’s going to get worse: The rich are going to get richer in the years ahead, and the poor, poorer.
So the question then becomes “Why?” Why is income inequality worsening, despite slow global economic growth and despite government efforts to redistribute wealth?
It has to do with what I call the “granddaddy of all cycles,” the major war cycle of 53.5 years in duration, a cycle that has pinpointed every major war since the beginning of time.
You can see my chart of this major war cycle here. It’s pointing up into 2020, the earliest date it can peak.

Make no mistake: It is this war cycle that is now driving — consciously or unconsciously — nearly every government decision that is being made.
- It is why we are seeing attacks on the rich in Europe and the United States, not to mention China.
- It is why we are seeing governments in Europe and the United States tax the rich, to allegedly redistribute wealth, but in reality, is backfiring, sending the rich fleeing, causing income inequality to worsen, and killing business formation.
- It is why we are seeing battles between religions, between civilizations, between groups within nations and between nations.
- It is why we are seeing rampant cyber espionage, between nations as well as governments spying on their own people.
- It is why we are now seeing the world in such a mess that even Pope Francis has recognized that the world is already in World War III, an acknowledgement he made last September at a speech in Italy.
Make no mistake: The world is indeed a mess, but it’s also about to get a whole lot worse.
Markets will continue to gyrate wildly. Europe will go down the tubes. Japan will default as well in the years ahead, and the biggest of them all, our own government, will also succumb to the forces I describe above.
You will see gold plunge on further deflation, then suddenly turn around and soar to over $5,000 an ounce.
You will see the U.S. stock markets similarly plunge, but then soar like an eagle as they become the last bastion of capitalism, as frightened money from all over the place, including sovereign bond markets, pours into equities like never before.
You will see bond markets lose 30 percent, 40 percent, even 60 percent on the dollar, wiping out pensions and untold millions of unsuspecting investors.
You will see the value of the dollar soar, as investors from other areas of the world, run for cover … and then, when the process is complete and everyone realizes the Emperors of Washington also have no clothes …
You will see the dollar crash and burn, forcing the world’s leaders to convene a new Bretton Woods, a new monetary system, a new reserve currency.
Mark my words: All of the above, and more, is coming. You must do everything you can to protect and grow your wealth.
Stay safe, stay protected, and be open to mega profits …
Best wishes,
Larry
P.S. For more than 35 years, I’ve made studying the Great Depression of the 1930s and economic cycles — and trading the financial markets based on my knowledge of both — my passions in life.

-
I know Mike is a very solid investor and respect his opinions very much. So if he says pay attention to this or that - I will.
~ Dale G.
-
I've started managing my own investments so view Michael's site as a one-stop shop from which to get information and perspectives.
~ Dave E.
-
Michael offers easy reading, honest, common sense information that anyone can use in a practical manner.
~ der_al.
-
A sane voice in a scrambled investment world.
~ Ed R.
Inside Edge Pro Contributors

Greg Weldon

Josef Schachter

Tyler Bollhorn

Ryan Irvine

Paul Beattie

Martin Straith

Patrick Ceresna

Mark Leibovit

James Thorne

Victor Adair