
Stocks & Equities

In This Week’s Issue:
– Stockscores’ Market Minutes Video – Small Cap vs. Large Cap
– Stockscores Trader Training – Small Cap vs. Large Cap
– Stock Features of the Week – Stockscores Simple Weekly
Stockscores Market Minutes Video – Small Cap vs. Large Cap
There are two important factors which affect how we trade small cap stocks versus large cap stocks. This week, a focus on that before my regular weekly market analysis.
Trader Training -Small Cap vs Large Cap
Investors often group stocks by their market capitalization, the total value of the company based on the price of their shares multiplied by the number of shares outstanding. Microcap stocks might have 20,000,000 shares out with a price of $0.50 – these tend to dominate the TSX Venture Exchange. A company with a few hundred million is more of a real business but still considered a small company compared to the large cap stocks that dominate the major market indexes, each valued at many billions of dollars. Apple, currently the largest company listed in North America, has a market cap of $659 Billion.
There are significant differences in how stocks small cap stocks trade compared to large caps. It is important to understand these difference so you can approach trading the in the right way. Here are some things to consider:
Liquidity – liquidity is a measure of how actively a stock trades and how smooth the price movements are for a stock. Generally, large cap stocks are more actively traded and make less volatile changes in price. Small cap stocks don’t have as many investors which makes them subject to a higher level of price volatility. This means that the reduced liquidity of small cap stocks makes them riskier. A stock that does not trade actively can make big price swings because of the actions of one large investor.
From a practical standpoint, this means you can suffer a bigger loss than you plan for in your risk management. You may plan to exit a trade if the stock hits your stop loss point at $5. However, if the stock is not very liquid and many investors try to exit at the same time, you could end up getting out at a much lower price than what you had planned for.
Correlation – every stock has some correlation to what the overall market is doing. If the general market is going up in value, most stocks will also go up. Large cap stocks tend to be more closely correlated to the market index. If you look at a chart comparing Microsoft (MSFT) with the Nasdaq 100 (QQQ) you will find that they move all most exactly the same way.
This makes it important to analyze the market index as well as the stock when considering the purchase of large cap stocks. Even if the large company you are considering is doing great things in its business, it may not perform well if the overall market heads lower.
This also means that large cap stocks can outperform small cap stocks when the overall market is strong. We have seen this over the past year; small cap stocks have been flat while the large cap stocks have moved in a strong upward trend with the overall market.
If the overall market breaks its long term upward trend, we may see money look for market beating returns in small cap stocks because this group is not so closely correlated to what the overall market is doing.
Performance – small cap stocks have a greater capacity for percentage return, up or down. Smaller companies tend to have a less diverse business which means they can go up or down rapidly based on the performance of their products or services. Consider how a company making a smart watch would do if it was successful. For a company like Apple, the launch of a smart watch might bring in a few billion dollars in sales but that, in the context of their overall business, will not have a huge impact on earnings. If a small cap company had the same success with the same product (and it was their only product), the effect on their stock price would be massive.
Of course, the failure of a business can also have a huge effect on share price. We often see small cap biotech stocks suffer painful and sudden sell offs when a drug that they are developing fails to get approval.
This defines the risk reward trade off that comes with selecting between market caps when investing. Large stocks have a hard time significantly beating the overall market. Small caps can achieve this but they can also suffer significant losses. With smaller cap stocks, risk management is more important.
Yield – many investors like stocks that pay a dividend since they rely on their portfolio for income. Most small cap stocks are working to grow earnings and use their capital to reinvest in their business. Once companies get large, they begin to return their earnings to shareholders as dividends. If you want to collect dividends, you will generally focus on larger cap stocks.
Fun – historically, I have found that trading smaller cap stocks is more fun. It is enjoyable to buy a stock at $5 and watch it go to $10 in a few days. That can happen with small cap stocks, it is rare with large cap.
Of course, making good returns is always going to be fun and you ultimately have to go to where the trend is strong. Large cap stocks have been in an upward trend for a number of years making it likely that any investor in boring, large cap stocks has felt pretty good watching them go up, even it has been slow and steady.
![]()
This week, I ran the Stockscores Simple Weekly Market Scans for the US and Canada. I found a lot of stocks that are well in to their upward trends and then another large group that had good gains last week but which are fighting long term pessimism. There were not many that seem to be initiating a new upward trend, but here are two that are worth considering:
1. BV
BV has been building rising bottoms in recent months, indicating that optimism is improving. This week, it broke to highs not seen for almost a year and the stock looks like it can move up toward the $11

2. BX
BX is breaking to new highs after trading sideways for a year, a good indication that it will continue its long term upward trend. The stock has a healthy historical yield of 5.5%.eks as investors bottom fish the oversold Gold Mining stocks. Since it is a leveraged ETF, be careful with longer term holds.

References
- Get the Stockscore on any of over 20,000 North American stocks.
- Background on the theories used by Stockscores.
- Strategies that can help you find new opportunities.
- Scan the market using extensive filter criteria.
- Build a portfolio of stocks and view a slide show of their charts.
- See which sectors are leading the market, and their components.
Disclaimer
This is not an investment advisory, and should not be used to make investment decisions. Information in Stockscores Perspectives is often opinionated and should be considered for information purposes only. No stock exchange anywhere has approved or disapproved of the information contained herein. There is no express or implied solicitation to buy or sell securities. The writers and editors of Perspectives may have positions in the stocks discussed above and may trade in the stocks mentioned. Don’t consider buying or selling any stock without conducting your own due diligenc

Stock Trading Alert originally published on January 26, 2015, 6:39 AM:
Briefly: In our opinion, no speculative positions are justified.Our intraday outlook remains neutral, and our short-term outlook is neutral:
Intraday (next 24 hours) outlook: neutral
Short-term (next 1-2 weeks) outlook: neutral
Medium-term (next 1-3 months) outlook: neutral
Long-term outlook (next year): bullish
The U.S. stock market indexes were mixed between -0.8% and +0.2% on Friday, as investors took some profits off the table following Thursday’s European Central Bank’s monetary policy decision release. The S&P 500 index remains within its three-month long consolidation, as it continues to trade along the level of 2,000. The nearest important resistance level is at around 2,060-2,065, marked by previous local highs. On the other hand, level of support is at 2,020, among others, as we can see on the daily chart:

Larger Image
Expectations before the opening of today’s trading session are negative, with index futures currently down 0.2-0.4%. The main European stock market indexes have been mixed so far. The S&P 500 futures contract (CFD) is in an intraday uptrend following a lower opening. The nearest important support level remains at around 2,025-2,030, and level of resistance is at 2,040, marked by Friday’s local low. For now, it looks like a downward correction within a short-term uptrend:

Larger Image
The technology Nasdaq 100 futures contract (CFD) follows basically the same path, as it trades along the level of 4,260. Resistance level remains at around 4,280-4,300, and the nearest important level of support is at 4,230, as the 15-minute chart shows:

Larger Image
Concluding, the broad stock market retraced some of its earlier gains on Friday, as investors took profits off the table. It still looks like a volatile medium-term consolidation following last year’s October-November rally. We prefer to be out of the market, avoiding low risk/reward ratio trades. We will let you know when we think it is safe to get back in the market.
Thank you.

The bad news hitting the tape has not forced the SP500 to crack, buy the dip folks are very pleased.
Bad news
- Oil crash, increased risk of debt accidents
- Swiss peg break to the Euro, funds blowing up
- US retail sales, fundamentals dont matter any more
The ECB is buying more stuff, the game of musical chairs moves on FED to BOJ to ECB. A Citi bank analyst has stated that world wide markets need $200 to $250 billion a quarter to ‘NOT CRASH’, so far the order has been met.
This cycle continues to work and should show a risk on market by the end of Jan 2015.

Larger Image
Investing Quote…
“Tape reading is rapid-fire horse sense…The Tape Reader aims to make deductions from each succeeding transaction — every shift of the market kaleidoscope; to grasp a new situation, force it lightning-like through the weighing machine of the brain and to reach a decision which will be acted upon with coolness and precision”~ Richard D Wyckoff
“Investing should be like watching paint dry or watching grass grow. If you want excitement…go to Las Vegas.” ~ Paul Samuelson
Although many energy stocks are starting to stabilize, oil has yet to find a bottom and base. Most analysts agree that, in the short run, oil prices may go lower.
However, longer-term demand increases and cuts in capital spending and production will eventually cut supplies. After all, companies just can’t spend and produce like they did when prices were $100 per barrel — now, those are below $50, and their costs remain above $50.
This means that, ultimately, production will decline, especially from the U.S. and Canada. We are already hearing about big layoffs in this space.
Just yesterday, Baker Hughes (BHI) announced it would cut 7,000 jobs. Halliburton (HAL), which is acquiring BHI in a $35 billion deal, managed to beat earnings estimates this week after cutting 1,000 jobs last quarter.
It’s not the first time we’ve seen this boom-bust story before, and it won’t be the last. Yet, this certainly creates opportunities for investors.
We’re Not There Yet. But
Are We Getting Closer?
As I have mentioned before, price discovery for oil is made in the futures market, and the futures market is dominated by speculators due to the significant leverage (about 8-to-1).
I have my commodity brokerage license, and used to work at a famous, managed futures firm. So, I can tell you firsthand that futures managers and speculators think and act very differently than investors.
Here’s a simple difference: Individual investors generally focus on fundamentals, while technicals are more important to futures participants than fundamentals.
So today let’s take a look at …
What Futures Traders See for Oil
Fundamentally, there is a global surplus of about 3%, but prices are down over 50%. With this relatively small surplus, on a fundamental basis, prices should be at $70 to $80, and not below $50.
Yet, as evidenced by the acceleration in the price decline, the technicals are bearish, which means the futures traders are in control.
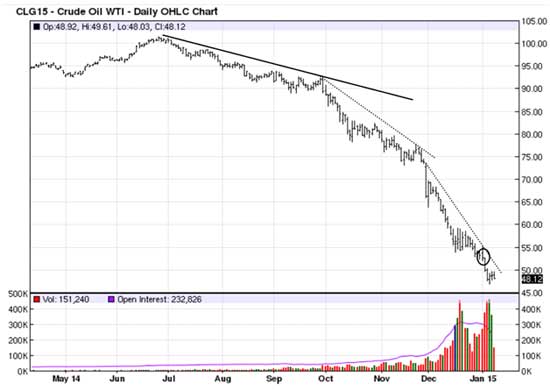
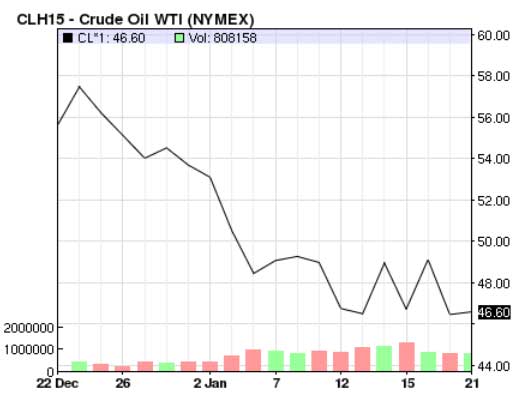
On a technical basis, we can look at round numbers for the next support. Prices did not hold at $70, $65 … even $50. Let’s see if prices hold at $45. If they don’t, the next round number would be $40.
If prices held at the $40 area for a sustained period, then oil production would have a high probability of being shut down.
Then, supply and demand would be in equilibrium, with a chance of having shortages.
Now, notice the surge in trading volume on the chart — and most of it selling. Longs were probably forced out due to margin calls as well as shorts being added.
We also saw two big days of buying which may be short-covering. But, we can see most of the volume is selling, and some of that are probably the shorts. When prices reverse eventually, these shorts will have to cover to take profits to avoid losses.
What Earnings Season Will Tell Us About Oil Prices
Oil prices at the end of 2014 are important, as companies that can’t produce economically at those prices or below will have to write down those reserves.
will write more about this after earnings season when we can see the impact on income statements and balance sheets.
Earnings for energy companies normally come late in the earnings season, late February to March.
Also, we still have to be concerned about the Saudis and OPEC, as they can still talk down prices and produce more oil (not much more).
I will write more about this once we understand what will be the production cuts in the U.S. and Canada. Most capital spending and production cuts will be announced during earnings seasons.
Some companies are announcing capital spending cuts before earnings season. At $50 oil, there is sure to be more cuts.
Currently, the Saudis are reducing discounts to certain customers and raising prices for others.
Fortunately, many energy companies are finding bottoms and are basing. Here, we have investors similar to ourselves who realize the bargains with energy companies and the upside these companies have.
Energy Company Outlook
One of the good things about this bear market in energy is that now we can own higher-quality companies with better management, reserves and fundamentals — especially balance sheets.
Previously, these companies were more expensive and would probably not be bought out. I prefer investing in companies that have the potential to be acquired.
I recently recommended such a company, EOG Resources (EOG).
Below is a current chart:
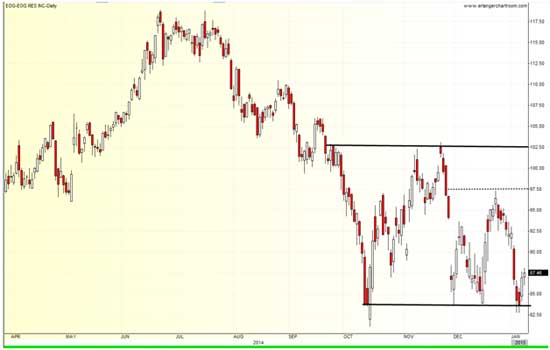
As you know, I have been writing about how energy stocks need to find a bottom and base, but EOG found a bottom in October and has been basing ever since, despite the continued fall in prices.
This is a bullish sign for EOG. Most basing periods last about seven months.
Remember, bases are like diving boards: The longer the board, the greater the next move.
I will probably trade the basing range several times (support $84, resistance $97.50) for the next few months until oil prices find a bottom.
It is normal during a basing period for prices to test support, or even make a new low. This could happen to EOG if oil prices fall to $45 and especially if prices fell to $40.
Unfortunately, most energy stocks don’t look like EOG. Most energy stocks look like the SPDR S&P Oil & Gas Exploration & Production ETF (XOP).
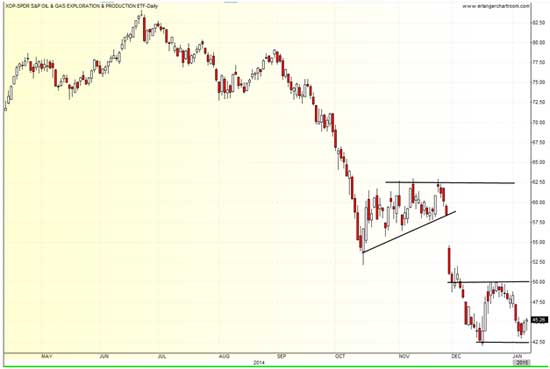
In October through November, XOP was starting to base and had a bullish ascending triangle as participants were buying the pullbacks.
But, once OPEC announced that it would not support prices, most energy stocks took another leg down.
Prices are starting to base again, but with oil prices still bearish, energy stocks could possibly get another leg down — creating even better bargains.
There is still downside risk with energy stocks, but the upside is much greater.
We have to be patient and let oil prices find a bottom.
I have listed many catalysts for oil and energy stocks to move higher. These are worth listing again. Take a look:
- Lower prices could increase oil and gas demand.
- Lower prices will cause cuts in capital spending and production.
- Oil supply disruptions from wars, terrorist attacks, oil spills, weather, and maintenance could occur at any time.
- Normally, oil prices have a risk premium. At this point there is none. Eventually, there should be.
- Most analysts see equilibrium between supply and demand by summer or by the latest the end of the year. Remember, the market is forward-looking, so we need to be invested before equilibrium occurs.
- The best bargains in the markets are among energy stocks and this will attract investors. This is one of the reasons why energy stocks prices are reacting better than oil.
- Most analysts are anticipating more mergers and acquisitions. As you recall, we did see this happen with Talisman Energy (TLM) and with Baker Hughes.
Once oil has found a bottom and starts to base, it will be time to add to existing positions to bring down the cost-per-share basis, or to initiate new ones.
Remember, a base is like a diving board: the longer the diving board, the better and bigger the bounce. So, when prices start to settle and gain some traction, get your shopping list ready because that’s when it will be time to buy again.
Good Gold and Energy Investing,
Dan Hassey
While the financial media is absolutely infatuated with stocks hitting new highs everyday, we would do well to pay attention to some ongoing bear markets:
1) Japanese stocks continue to languish under the effects of deflation following a well over 26 year old bear market, down over 50% from the highs set in 1989.

2) Despite some great innovation out of the U.S from the likes of Apple, Google, Facebook e.t.c the NASDAQ continues to remain in a 15 year bear market down over 10% from the highs in 2000.

3) Despite going parabolic yet again, Chinese stocks continue to remain in a 7 year bear market down well over 50% from the highs set in 2008.

4) US bank stocks are entering a 7 year bear market despite all the QE money and super low interest rates down over 40% from their highs set in 2008.

5) The Euro is also in a 7 year bear market down over 25% against the dollar from it’s highs set in 2008.

6) Gold and gold ETF’s continue to be in bear markets down well over 35% from their highs set in 2008.

7) The more recent casualty oil and oil ETF’s are down well over 60% from their highs set in 2008.

It is well worth noting that it is no strange coincidence that there are major bear markets in several key asset classes and despite recent bear market rallies caused by the FED’s QE for ever policies the hibernating bear is all set to emerge with a vengeance.

-
I know Mike is a very solid investor and respect his opinions very much. So if he says pay attention to this or that - I will.
~ Dale G.
-
I've started managing my own investments so view Michael's site as a one-stop shop from which to get information and perspectives.
~ Dave E.
-
Michael offers easy reading, honest, common sense information that anyone can use in a practical manner.
~ der_al.
-
A sane voice in a scrambled investment world.
~ Ed R.
Inside Edge Pro Contributors

Greg Weldon

Josef Schachter

Tyler Bollhorn

Ryan Irvine

Paul Beattie

Martin Straith

Patrick Ceresna

Mark Leibovit

James Thorne

Victor Adair