
Stocks & Equities
Uncertainty Following Recent Move Up – Will Uptrend Extend Even Further?
Sent Nov 13, 2014, 6:02 AM:
Briefly: In our opinion, speculative short positions are favored (with stop-loss at 2,085 and profit target at 1,950, S&P 500 index).
Our intraday outlook is bearish, and our short-term outlook is bearish:
Intraday (next 24 hours) outlook: bearish
Short-term (next 1-2 weeks) outlook: bearish
Medium-term (next 1-3 months) outlook: neutral
Long-term outlook (next year): bullish
The U.S. stock market indexes were virtually flat on Wednesday, as investors continued to hesitate following recent move up. The S&P 500 index remains close to Thursday’s all-time high of 2,041.28. The nearest important resistance level is at around 2,040-2,050. On the other hand, the level of support is at 2,020-2,025, marked by previous local extremes. There have been no confirmed negative signals so far, however, we can see short-term overbought conditions:
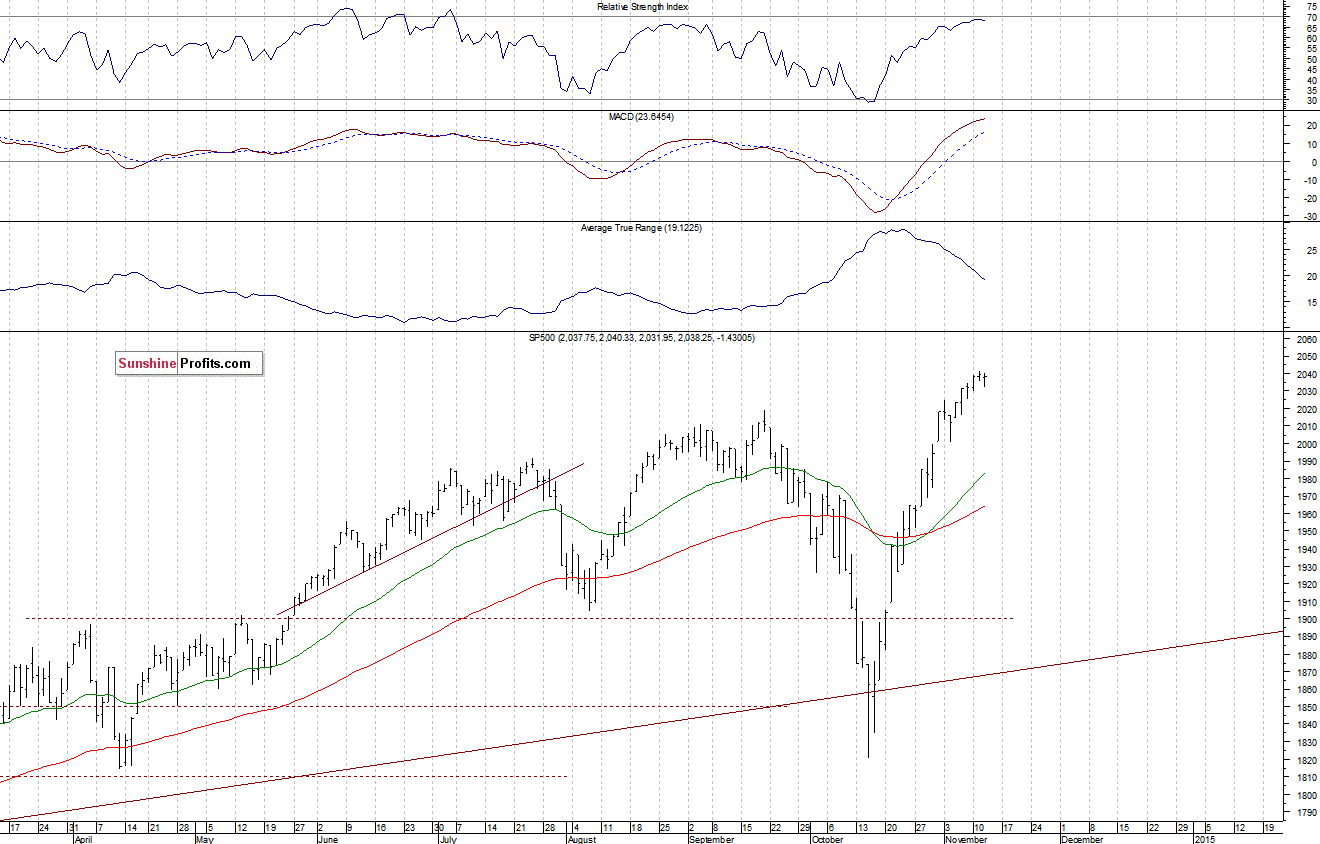
Expectations before the opening of today’s trading session are positive, with index futures currently up 0.3%.
The main European stock market indexes have gained 0.4-0.9% so far. Investors will now wait for some economic data announcements: Initial Claims at 8:30 a.m., JOLTS – Job Openings at 10:00 a.m. The S&P 500 futures contract (CFD) is in an intraday uptrend, as it trades close to new all-time high. The resistance level is at around 2,050, and the nearest important level of support is at around 2,035-2,040, marked by previous local extremes, as we can see on the 15-minute chart:

The technology Nasdaq 100 futures contract (CFD) is relatively stronger, as it trades above the level of 4,200. The nearest important support level is at around 4,180, marked by previous level of resistance. There have been no confirmed negative signals so far, as the 15-minute chart shows:

Concluding, the broad stock market remains close to all-time highs, as it extends recent fluctuations. We expect a downward correction or an uptrend reversal. Therefore, we continue to maintain our speculative short position. Stop-loss is at 2,085 and potential profit target is at 1,950 (S&P 500 index). It is always important to set some exit price level in case some events cause the price to move in the unlikely direction. Having safety measures in place helps limit potential losses while letting the gains grow.
Thank you.
Paul Rejczak
Stock Trading Strategist
* * * * *
Disclaimer
All essays, research and information found above represent analyses and opinions of Paul Rejczak and Sunshine Profits’ associates only. As such, it may prove wrong and be a subject to change without notice. Opinions and analyses were based on data available to authors of respective essays at the time of writing. Although the information provided above is based on careful research and sources that are believed to be accurate, Paul Rejczak and his associates do not guarantee the accuracy or thoroughness of the data or information reported. The opinions published above are neither an offer nor a recommendation to purchase or sell any securities. Mr. Rejczak is not a Registered Securities Advisor. By reading Paul Rejczak’s reports you fully agree that he will not be held responsible or liable for any decisions you make regarding any information provided in these reports. Investing, trading and speculation in any financial markets may involve high risk of loss. Paul Rejczak, Sunshine Profits’ employees and affiliates as well as members of their families may have a short or long position in any securities, including those mentioned in any of the reports or essays, and may make additional purchases and/or sales of those securities without notice.


Volatility, as measured by the CBOE VIX index VIX, +0.15% after spiking higher in October, dropped back to year’s lows and at around 13 is well below historical averages.
The exact “V” shaped recovery in both the VIX and S&P 500 seems unnatural. Previous pullbacks took much longer to recover from.
Jeffrey Saut, chief investment strategist at Raymond James, says the reasons to expect higher volatility are simple: historically, after long periods of low volatility, markets experience higher volatility. Others think it is the Fed’s exit from QE that will contribute to higher volatility. But whatever the reason, most people on Wall Street agree that volatility is going to be higher in the months to come, which means we are likely to see more pullbacks. Click HERE or Image for next Chart
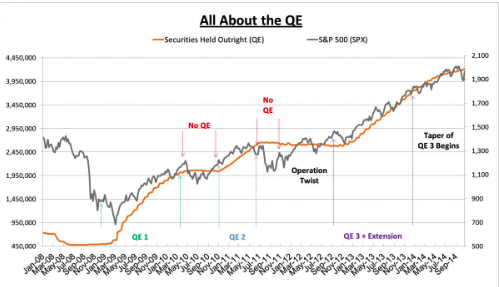
 The day after the Fed announced the end of QE 3, Paul Richards, the head of FX for UBS said on CNBC that he is “so bullish on stocks that it hurts.” One wonders if he had ever seen a chart like the one produced for this article. But Mr. Richards is not far off from the vast majority of U.S. stock analysts who see clear sailing ahead.
The Wall Street crowd liked what they heard last week and pushed the Dow Jones to a new high. In particular, the trio of the Republican landslide victory, an overall positive Q3 earning season, and a good jobs report that showed unemployment dropping to 5.8% was behind the rally.
And what a rally it was. Since the start of earnings season on October 8, the S&P 500 has increased by 3% and has bounced by an eye-popping 9.1% from the October 15 low.
Many of my peers have already popped the champagne and drunkenly declared a coast-is-clear resumption of the great bull market.
Not so fast. There was a trio of negative news pieces last week that tells me there is more to be worried about than there is to celebrate.
“V” Is for Vulnerable… Not Victory
You shouldn’t trust “V”-shaped bottoms.
Instead of being encouraged by the 9% moonshot since the October 15 low, I am even more skeptical. The S&P 500 shot up by 220 points in just three weeks, which tells me that the rubber band of stock market psychology is overstretched.

The stock market’s massive mood swing from fear to greed can change just as quickly to the other direction. Sharp trend reversals followed by sharp rebounds is not a kind of bottom building behavior.
The rally has been accomplished with low trading volume—a classic definition of an unsustainable bounce because it shows that the rally was more from a lack of sellers rather than an abundance of buyers.
And don’t forget about the drastic underperformance of small stocks. The Russell 2000 is up less than 1% for the year compared to 11% for the Nasdaq and 10% for the S&P 500.
Earnings: Look Ahead, Not Behind
Overall, corporate America had an impressive third quarter. 88% of the companies in the S&P 500 have reported their third-quarter earnings; of those, 66% exceeded Wall Street expectations.
Impressive, right? Not so fast!
When it comes to earnings, you need to be looking through the front-view windshield and not the rear-view mirror.

Even the perpetually bullish analytical community is getting worried. The average estimates for Q4 earnings as well as Q1 2015 are being downwardly adjusted. Since October 1:
- Q4 earnings growth have been lowered from 11.1% to 7.6%;and
- Q1 2015 earnings growth has been chopped from 11.5% to 8.8%.
Don’t give Wall Street too much credit for being rational. Those downward revisions are largely based on the cautious outlook given the corporate America itself. The ratio of negative outlooks to positive outlooks is 3.9 to 1!
Both Wall Street and corporate America are concerned, and so should you be.
Don’t Ignore Central Bankers’ Warnings
Many of the world’s central bankers gathered in Paris last week to figure out how to keep the world’s leaky financial boat from sinking, as well as spending more of their taxpayers’ money on fine wine, cuisine, and luxury hotels.
All those central bankers are eager to keep their economies afloat, but judging from the comments, they’re worried that they are running out of monetary bullets.
“Normalization could lead to some heightened financial volatility,” warned Janet Yellen.

“This shift in policy will undoubtedly be accompanied by some degree of market turbulence,” said William Dudley, president of the Federal Reserve Bank of New York.
“The transition could be bumpy … potential for financial market disruption,” cautioned Bank of England Governor Mark Carney.
“Paramount risk of very low interest rates is to entertain the illusion that governments can continue to borrow rather than make difficult and yet necessary choices and indefinitely put off the implementation of structural reforms,” admitted Bank of France Governor Christian Noyer.
“The bottom line is there is a very good question about whether more stimulus is the answer,” said Reserve Bank of India Governor Raghuram Rajan.
Perhaps the most honest and telling statement from Malaysian central banker Zeti Akhtar Aziz: “In this highly connected world, you would be kindest to your neighbors when your keep your own house in order.”
That’s a whole lot of central banker warnings—and it’s always a mistake to ignore the people who control the world’s printing presses.
30-year market expert Tony Sagami leads the Yield Shark and Rational Bear advisories at Mauldin Economics. To learn more about Yield Shark and how it helps you maximize dividend income, click here. To learn more about Rational Bear and how you can use it to benefit from falling stocks and sectors, click here.

“I think 2015 will be the start of a new micro-cap stock bull market. Sure it could take more than a year to base and start to rally, but the time will come when ridiculous amounts of money will be made in this corner of the market”
Canadian Venture Index Gold & Penny Stocks
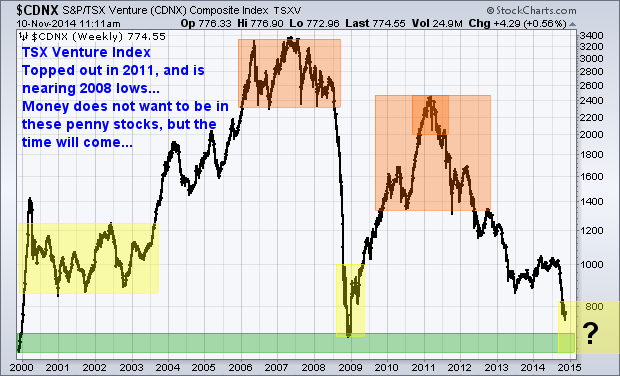
Last week I met with a local professional trader who specialized in trading only Canadian stocks. While he mainly trades the 75 large cap stocks on the TSX which have the liquidity requirements he needs, he also trades penny stocks on occasion.
When he pulled up the TSX Venture index and reviewed our outlooks, we both came to a similar conclusion on what to expect moving forward.
We all know what happens to boats when the tide goes down… This index shows very clearly why most penny stocks have been losing value the last three years. Money has and continues to flow out of these equities and if fighting this major trend it will likely cause you frustration and financial pain.
See my gold forecast and charts from a year ago: Click Here
Overall gold and silver mining stocks are now entering a key long term investment level, but don’t jump the gun and buy yet…
Knowing that most of the largest moves based on percent happen during the last 10% of the trend, we must expect micro-cap stock prices will be extremely volatile for many months. Another 30-60% hair cut could still be ahead.’
Canadian Equities Market:
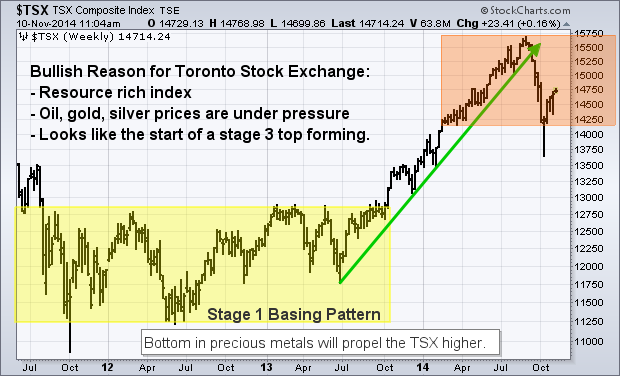
The TSX Composite is heavily resource-weighted and this market has lagged its counterparts around the world in the last year. This year the Canadian index played catch-up as seen in the chart below and was the strongest index in 2014 until this recent correction.
These equities may hold up well when the US market starts to top/correct. This is because the TSX’s is heavily weighted in late-cycle stocks (resources), it’s not unusual for the Canadian market to lag in the early stages of a bull market in the USA, catch up in the late stages, and then outperform toward the end.
Trading & Investing Conclusion:
In short, I think 2015 will be the start of a new micro-cap stock bull market. Sure it could take more than a year to base and start to rally, but the time will come when ridiculous amounts of money will be made in this corner of the market.
We all hear stories about how a couple thousand dollars in a particular stock would now be worth $250,000, $1,000,000 etc… well times like that will happen again. But we must wait and watch for this perfect storm to unfold.
Be sure to join my gold newsletter at: www.TheGoldAndOilGuy.com
Chris Vermeulen

-
I know Mike is a very solid investor and respect his opinions very much. So if he says pay attention to this or that - I will.
~ Dale G.
-
I've started managing my own investments so view Michael's site as a one-stop shop from which to get information and perspectives.
~ Dave E.
-
Michael offers easy reading, honest, common sense information that anyone can use in a practical manner.
~ der_al.
-
A sane voice in a scrambled investment world.
~ Ed R.
Inside Edge Pro Contributors

Greg Weldon

Josef Schachter

Tyler Bollhorn

Ryan Irvine

Paul Beattie

Martin Straith

Patrick Ceresna

Mark Leibovit

James Thorne

Victor Adair