
Stocks & Equities
Briefly: In our opinion, no speculative positions are justified.
Our intraday outlook is neutral, and our short-term outlook is neutral:
Intraday (next 24 hours) outlook: neutral
Short-term (next 1-2 weeks) outlook: neutral
Medium-term (next 1-3 months) outlook: neutral
Long-term outlook (next year): bullish
The main U.S. stock market indexes gained between 1.1% and 1.4%, extending their uptrend, as investors reacted to the Bank of Japan stimulus program announcement. The S&P 500 index got very close to the September 19th all-time high of 2,019.26. The nearest important resistance level is at around 2,020, marked by an all-time high. On the other hand, the level of support is at 2,000, among others. There have been no confirmed negative signals so far, however, we can see some short-term overbought conditions:

Expectations before the opening of today’s trading session are virtually flat, with index futures currently down 0.1%. The European stock market indexes have lost 0.1-0.3% so far. Investors will now wait for some economic data announcements: ISM Index, Construction Spending at 10:00 a.m. The S&P 500 futures contract (CFD) is in an intraday consolidation, as it trades close to all-time high. The nearest important level of resistance is at around 2,010-2,015, and the support level is at 2,000, as we can see on the 15-minute chart:

The technology Nasdaq 100 futures contract (CFD) follows a similar path, as it moves along the level of 4,150. The nearest important level of resistance seems to be at 4,160-4,170. There have been no confirmed negative signals so far, as the 15-minute chart shows:

Concluding, the broad stock market extended its uptrend, following better-than-expected economic data releases. There have been no confirmed negative signals so far. However, we can see some short-term overbought conditions which may lead to a downward correction. We prefer to be out of the market, avoiding low risk/reward ratio trades. We will let you know when we think it is safe to get back in the market.
Thank you.

 Once a year, the man running the world’s biggest sovereign wealth fund travels around China for a week.
Though assets from that country only make up about 1.5 percent of the $860 billion Norwegian wealth fund’s portfolio, Yngve Slyngstad, its chief executive officer, says almost all investment decisions are affected by what happens in China.
Understanding what’s poised to become the world’s largest economy is crucial for Slyngstad as he manages a fund that Norway predicts will reach $1 trillion in less than three years. He’ll be in China this month, visiting Beijing and other cities.
“Every time I come back, my perception of China has changed,” Slyngstad, who turned 52 today, said in an Oct. 29 interview in his fifth-floor office in Oslo. “There has been more and more of a question mark over what’s the next step for that economy. The uncertainty among investors is partially due to the very simple fact that it’s more difficult to know what’s happening in that large economy than in any other.”
The composition of the global economy, including the future of emerging markets such as….continue reading more on:

As noted in detail on May 14, it is always important to understand both the bullish and bearish case for stocks. We recently noted two potentially bullish developments: an unprecedented drop in investor fear, and what appears to be a successful retest of a long-term breakout for the broad NYSE Composite Index. While the headline number for Thursday’s GDP report was impressive, the report contained something that may keep the Fed in a market-friendly mode.
A Dovish GDP Report?
 A case can be made that this week’s GDP report was skewed favorably by Uncle Sam. From Bloomberg:
“The GDP number’s fine, not spectacular,” Michael Block, chief equity strategist at Rhino Trading Partners LLC in New York, said by phone. “The inflation data isn’t great and the quality of the GDP beat isn’t great as a lot of it is from government and defense spending. It adds to dovishness.”
Fear Of Deflation Impacts Fed
Low inflation can eventually slip into deflation territory. Once deflation takes hold, it can morph into a negative feedback loop know as a deflationary spiral. If you were surprised that bonds started strongly Thursday after what appeared to be a strong GDP report, there is a logical explanation. Bond buyers were focused on the inflation data. From The Wall Street Journal:
The lack of inflation in the U.S. and around the world remains a concern for economy watchers and a key factor keeping bond buyers around. Within Thursday’s GDP report, the price index for personal consumption expenditures rose at a 1.2% annual rate in the third quarter, from 2.3% in the second quarter.
Investment Implications – The Weight Of The Evidence
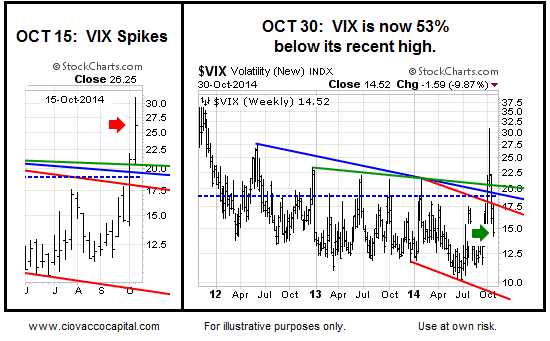
As noted in last week’s video, the improvement in the hard evidence has allowed us to scale into equity positions numerous times in the past two weeks. The “fear reset” in the VIX is still holding in a bullish manner for equities (see below). If the market can continue to gain traction based on earnings, GDP, and tame inflation data, we will most likely continue to increase equity exposure.
Concerns Remain
Europe’s economy and low inflation could eventually impact the USA. We must also continue to keep an open mind about all outcomes as the Fed begins to normalize interest rates.
European stocks are all climbing Friday morning after a big boost in Asia following Japan’s unexpected decision to extend its quantitative easing stimulus program.
Here’s the scorecard:
France’s CAC 40 is up 2.02%
Spain’s IBEX is up 1.74%
Italy’s FTSE MIB is up 1.78%
Britain’s FTSE 100 is up 1.15%
Germany’s DAX is up 1.60%
Asian markets saw a massive rally. The Nikkei closed up 4.83%. The Hang Seng closed up 1.25%.
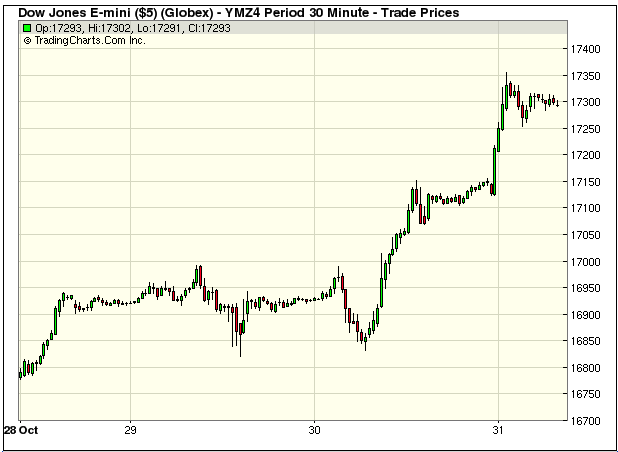
US futures are climbing, too: The S&P is up 16.75 points, and the Dow is up 149 points.
On Friday morning, we’ve already had some terrible retail sales figures for Germany: with a 3.2% drop in September, they are the worst since 2007.
European inflation data just released showed a small rise, up to 0.4% in October. That’s one month of room to breathe for the European Central Bank, a small step away from deflation.
At 8:30 a.m. ET from the US, personal spending data is out. Analysts are expecting a 0.3% boost to personal income and a 0.1% boost to spending for September.
This post was updated at 6:30 a.m. ET.
Read more: http://www.businessinsider.com/market-update-oct-31-2014-10#ixzz3Hj4B7eU4
How to Gain a Hedged Trading Edge
For now, we can rest somewhat easy that the stock market has whistled through the graveyard and emerged into the sunshine.
This allows us to get back to our discussion of hedge funds that we started several weeks ago but had to postpone.
A couple of weeks ago, we talked about how the California Public Employee Retirement System (Calpers) decided to quit investing in hedge funds.
Many in the media have proclaimed the death of hedge funds. As we discussed, this is far from the case, but there are problems in the traditional hedge-fund business model that need to be addressed.
The thing is, hedge funds impact stock prices much more than they have in the past. That’s because “hedgies” are such active traders that they can move markets quickly and sometimes in a big way.
By contrast, mutual fund managers and traditional managers for the most part adopt much more of a buy-and-hold strategy and trade less.
My thinking is that, by understanding how hedge fund managers operate, we can better take advantage of their inefficiencies.
Why Hedge Funds Work
First, let’s define a hedge fund. It’s a fund that is both long and short stocks — and/or other asset classes like bonds or commodities.
Its goal is to reduce the exposure of only owning stocks by shorting stocks.
Most mutual funds only buy stocks. So, when the market is moving higher, a mutual fund that is 100% invested generally gets rewarded with almost a 100% gain of the major equity indexes like the S&P 500.
That’s the good news for mutual funds and the investors who have money in them.
The bad news is that, when markets correct, a mutual fund will probably lose as much as the S&P 500 — or more, depending on the stock-selection process used.
Meanwhile in an up market, a hedge fund may not make 100% of the gain of the index … but it also won’t lose as much when the market corrects.
The hedge fund’s goal over time is to generate 1%-2% in gains, month after month. That is easier said than done, and this year validates that statement.
Hedge Funds’ Secrets to Trading Success
Hedge funds can move from net long (greater long exposure minus short exposure) to net short (greater short exposure minus long exposure) if the fund believes that the market is overvalued.
There are several variations on this style.
- The first is long/short, as described above.
- The second is market-neutral long/short. This means the fund is always long the same amount the fund is short. The goal here is that stock picking works leading to consistent gains.
- The third is a macro hedge fund. A macro hedge fund drives its stock selection on its economic outlook.
Let’s look at how these styles have fared this year …
The S&P 500 was up 7.25% year-to-date through Wednesday’s close. Meanwhile, the Russell 2000 was down 1.48%.
The average long/short fund is up 3.22% through the end of September. Market-neutral is down -1.52% and global macro is down 2.63%.
The best hedge return has come from managed futures, which have returned 6.37%. The conclusion is that hedge funds as an asset class are lagging the market.
Why Aren’t Hedge Funds
Rolling in Profits Right Now?
The lag is due to just more than the volatility seen in the second half of the year. Much of it has to do with the parameters set on how they can invest.
Many long/short managers have to have an equal beta on the long and short side. Beta is defined as risk.
A beta of 1 would have the same risk as the S&P 500. If that index fell 5%, then a stock with a beta of 1 would drop 5%.
This leads to a potential problem where the long and short always cancel each other out.
A better approach would be to have a higher beta on the long side when the market is rising and a lower beta on the short side. This would enable the hedge to produce better returns.
Conversely, in a market that is falling, the beta on the short side would be higher and the beta on the long side would be lower.
TSLA, PG: A Hedged Edge
A great analogy would be to be shorta high-beta stock like Tesla (TSLA) when the market is falling and be long a low-beta name like Procter & Gamble (PG).
In the chart below you can see that this pairing worked well as a hedge during the drop in September into mid-October. This hedge made 19.41% as it rose in value from a starting price of $0.31 to an ending price of $0.37.
The takeaway here is to not pair stocks with the same beta (i.e., both long or both short).
Another issue that hedge fund managers run into is confirmation bias. We will aim to pick up that topic next week. In the meantime, let’s review our thinking on a few ideas we have been tracking in our weekly column.
A big plus is that the S&P 500 has moved above its 200-day moving average and all other key moving averages.
However, the Russell 2000 and the iShares Russell 2000 (IWM) are still below their 200-day moving averages as well as key retracement levels from the August low to September high and the May low to July high.
The conclusion we remain with is we would love to be bullish here, but the models tell us this move still has the potential to be a head fake and that some type of retest in the offing.

However, the worst case for the Russell 2000, which was IWM retesting the May low at $107.44, may have played out. I noted that I remained neutral on this small-cap index and would turn positive if IWM overtakes the 61.80% retracement at $112.61.
It has done that … and then some.
The key for many stocks going forward continues to be the greenback. But with the recent trading action, the U.S. dollar is not a problem for the stock market … or for some of the trades we’ve been following together.
As such, we are done tracking the U.S. dollar for now and will alert you if it becomes a problem down the road.
We also remain with a recommendation on United Parcel Service (UPS). The cost basis is $97.25. The stock is at $102.30, as of Wednesday night’s close, so we are up on the trade nicely after some but not a great deal of angst.
Stay long the stock — the economy is in good shape, which means business is good for the delivery business.
Our last open buy idea is gold via SPDR Gold Shares (GLD), which I introduced this summer at $126.53 this summer. GLD is lower now at $117.61.Gold is stuck in a range here of $114 to $126 but as we’ve been discussing, a breakout may be forthcoming.
GLD has now almost completely retraced its entire move from Dec. 31, 2013. The dollar remains key to gold and GLD.
Bottom line: In this market, it makes sense to remain patient. And when you do trade, continue to just nibble for now.
Cheers and Hit ’Em Straight,
Geoff Garbacz
P.S. Six years ago, my colleagues James DiGeorgia, Dan Hassey and I teamed up to create the ultimate stock trading system. And simply put, the results we’ve been able to achieve have been pretty amazing.
In that time, my Morning Matters stock portfolio posted a 72% win-rate, and over 840% in gains … crushing the S&P 500 many times over!
….more:
Do Oil & Oil Stocks Have More ‘Overreaction’ Left in Them?

-
I know Mike is a very solid investor and respect his opinions very much. So if he says pay attention to this or that - I will.
~ Dale G.
-
I've started managing my own investments so view Michael's site as a one-stop shop from which to get information and perspectives.
~ Dave E.
-
Michael offers easy reading, honest, common sense information that anyone can use in a practical manner.
~ der_al.
-
A sane voice in a scrambled investment world.
~ Ed R.
Inside Edge Pro Contributors

Greg Weldon

Josef Schachter

Tyler Bollhorn

Ryan Irvine

Paul Beattie

Martin Straith

Patrick Ceresna

Mark Leibovit

James Thorne

Victor Adair