
Stocks & Equities
Emotionally shattered from seeing their wealth cut in half twice – once in 2000 and again in 2007-2008, 55% of Americans have no money in the stock market at all, according to a Federal Reserve Board analysis from last year.
According to Keith Fitz-Gerald, that would be different if only those people would look at this chart of the Dow Jones over the last 114 years:
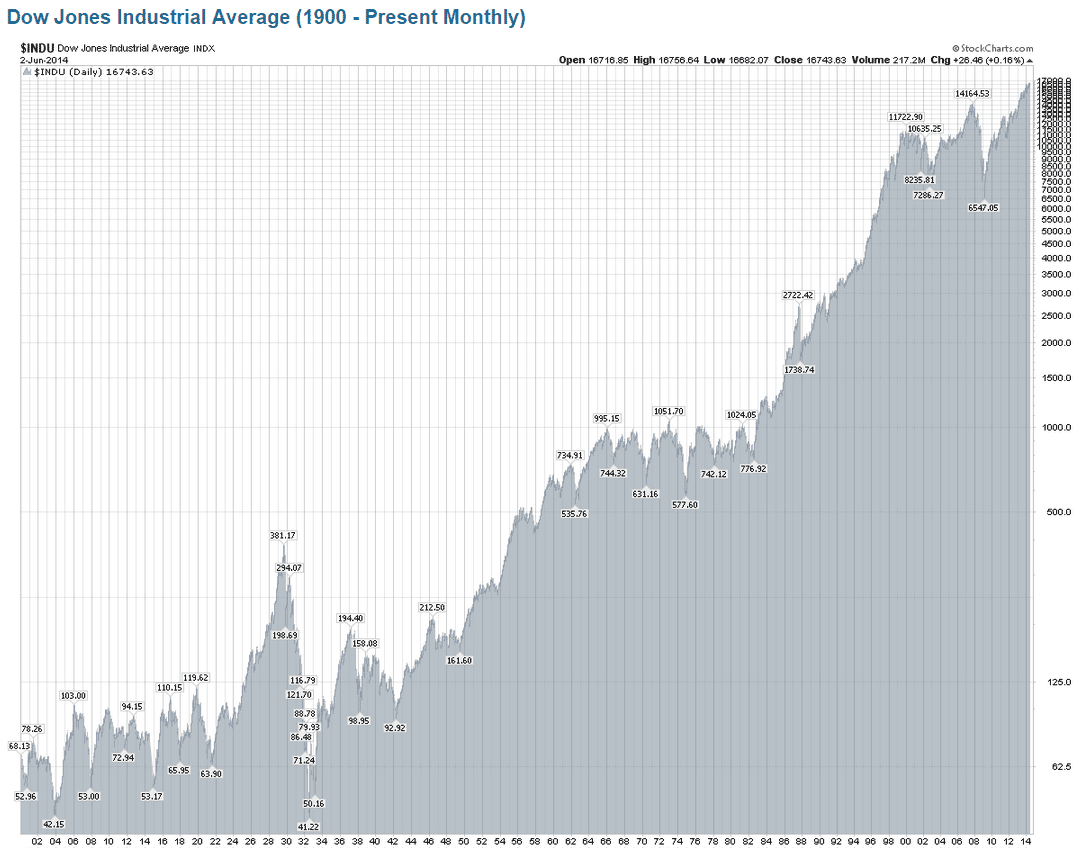
Despite two world wars, multiple invasions, presidential assassinations, the Cold War, hot wars, recession, depression, and all manner of events that no doubt seemed “catastrophic” at the time, it continued to push higher.
Since 1900, it rose a staggering 24,285%.
Why did it keep going up?
…continue reading HERE

 sIBM went down hard on its quarterly earnings report this week. This made a splash in the news because, well, it’s IBM, and also Warren Buffett owns it, so it was a rare moment of human fallibility for him. But there is a lot more to the story than that. Very sophisticated people have been keeping an eye on IBM for some time.
In particular, Stanley Druckenmiller—former chairman and president of Duquesne Capital, former portfolio manager of Soros’s Quantum Fund, and, honestly, one of the greatest investors in modern times—went public about a year ago saying that IBM was his favorite short (which says a lot) and that it was the poster child for, well, the type of stock market we have nowadays.
What was Druckenmiller referring to?
Some Quick History
Ten years ago, during the housing boom, the consumer was the most leveraged entity, taking out negative amortization mortgages, cashing out home equity, things like that. The consumer got a margin call, which was ugly—you know the story—and has spent the last six years deleveraging.
While the consumer was taking down leverage, the US government was adding leverage, taking the deficit to over 10% of GDP at one point. But even the government is deleveraging (for the moment), and now it is America’s corporations that have been adding leverage, at a furious pace. We’ve had trillions of dollars in corporate bond issuance in the last few years.
So when corporations sell bonds, what do they typically use the proceeds for?
In theory, the proper use for debt is to finance capital expenditures. Growth. But in this last cycle, that’s not what the money has been used for. It’s primarily been used for stock buybacks and dividends.
Robbing Peter to Pay Paul
Now, there are good corporate finance reasons to lever up a balance sheet and conduct stockholder-friendly actions, like buying back stock or paying dividends. You can read about it in the corporate finance textbooks. For any company, there is an optimal amount of leverage. It’s even possible to be underleveraged.
But you see (and this is the important thing), when you take out debt to buy back stock, leveraging the balance sheet in the process, you may be increasing the optics of how profitable the business is by increasing earnings per share—but you are not actually changing the fundamentals of the business.
You are not actually increasing profitability. You are just rewarding one tranche of the capital structure (common stockholders) at the expense of another one (bondholders).
IBM just happened to be a particularly egregious example. IBM—whose core business was basically flat over six years—well, you’d never know it from looking at a chart of the stock. (Hint: it went straight up for years.)
What happened?
They tripled their debt over time, retiring stock, taking the share count under a billion, ramping up the earnings per share. The goal was to get it over $20, which they abandoned on the last earnings call.
Financial Engineering Works, to a Point
So what can we learn about financial engineering? It works, up to a point. In the short term, you can conceal from investors the fact that your business model is broken and you don’t have a plan. You can conceal it for a number of years, in fact. That is the thing about finance: you can suspend the laws of economics in the short term. But not forever. It will always come back to haunt you.
IBM is by no means alone. There are dozens, even hundreds of buybacks going on as we speak. One of my favorites is GameStop (NYSE:GME). It is an open secret that GME is the next Blockbuster, now that the technology exists for games to be downloaded over the Internet with no interruption of play. Everyone knows that unless there is a radical change in strategy, GME is doomed. But you couldn’t short the stock because of… a buyback.
So with a good portion of the S&P 500 buying back stock, it’s no surprise that it wants to keep going up, and hindsight being what it is, it has been very foolish to try and short it.
This Can’t Go On Forever
There is good news, though (or bad news, depending on your point of view). IBM might be the canary. Put another way, there is a limit to how many bonds can be issued, and for sure, the credit markets have been less accommodative lately. Maybe that is how it ends—the credit markets shut down, no more bonds, no more buybacks.
People kind of forget what it’s like when the credit door slams shut. I remember writing bullishly on Gannett (NYSE:GCI) back in 2008. The stock was in the low single digits. The market was very worried that the company would not be able to refinance an existing bond issue maturing in 2009. GCI did manage to refinance, and stockholders have been rewarded. But it was looking very sketchy there for a moment.
The credit markets are kind of my hobby horse, and it is the right of anyone with a hobby horse to ride that thing as long as possible. There’s been so much debt issued—at such unfavorable terms and at such low interest rates—that the credit markets are more vulnerable than at any point in history. A mild recession, and we are looking at 20% default rates. All it takes is a push.
Just last week, it looked like we were going to get it. A hint of QE4, and the market seems to have changed its mind. We shall see. I tend not to use phrases like “smoke and mirrors” to describe the stock market, because that is very tinfoil-hatty.
Put more thoughtfully, I would say that much of this 200% move in the stock market off the lows has been divorced from economic fundamentals, and based solely on financial engineering, which can be ephemeral.
It’s a self-reinforcing process that has worked for a while, but I don’t want to be around when it stops working.

Jared Dillian
The market shows that investors have been following the wrong narratives for two years.
For the better part of two years, US markets have dominated investor interest on the belief that the Federal Reserve finally got it right with Quantitative Easing 3. T
The economy was about to hit escape velocity, economic growth would decouple from the rest of the world, and all would be well as we normalized interest rates.
The most important thing people did for me was to expose me to new things.
-Temple Grandin
Of course, the world is finally coming around to the idea that none of these narratives seems to be holding true, as US large-caps finally begin to falter and other areas of the investable landscape go down less in this environment.
And what the other narrative that didn’t pan out?
An emerging market crisis that caused those stock markets to collapse on the taper tantrum of 2013. It was argued that a rising rate environment in the US would result in emerging markets being toast. We never got the rising rate environment everyone was convinced would break those economies.
Now clearly, their economic growth is weak, but this has been known for some time and pessimism has dominated investor flows.
Yet, into the most recent period of stock market volatility, emerging markets seem to have held up well.
Our alternative ATAC Inflation Rotation Fund (ATACX) has the ability to position aggressively into emerging markets out of Treasuries once this period passes, given a subtle rotation into the volatility that seems to be happening.
Take a look below at the price ratio of the iShares MSCI Emerging Markets ETF (EEM) relative to theMSCI ACWI Index Fund ETF (ACWI).
A rising price ratio means the numerator/EEM is outperforming (up more/down less) the denominator/ACWI. Note the recent strength on the far right, and the ratio making higher lows recently into the Fall Epiphany where investors have suddenly begun to refresh the fear.

Emerging markets outperforming does not necessarily mean the secular bull market will continue. Rather, after a prolonged period of negativity around those countries’ economic activity, it is now repricing of prolonged period of optimism in developed markets that has caused them to outperform.
I believe commodities likely need to stabilize and the US Dollar likely needs to fall for a real period of absolute price gains to take place, but the crisis talk may change from emerging markets to developed ones.
That alone is a substantial new theme which could last years to come.
….also from Michael Gayed: The Wrong Rates Are Rising

“Fear” blew out Wednesday (Oct 15) but not before investors realized that, “When markets are falling hard you have no idea how far down, down is.” They also learned what “lack of liquidity” feels like…and it feels awful…and certainly they learned that, “Risk Happens Fast!” All that, and the DJIA was only down ~8% top to bottom.
We’ve been “skeptical” of the stock market for months and have traded it from the short side…thinking that it had gone WAY too high too quickly without even a small correction…that it was WAY overdue for a break. After months of ultra-low volatility and record new highs Market Psychology had become enthusiastically “risk on”…and had become extremely vulnerable to a “shock”…it was indeed, as Mohammed Ali might have said, “Cruisin for a bruisin!”
In early September capital began to retreat from the more speculative “reaching for yield” type investments…it began to move from the periphery to the core…it began to concentrate in BIG CAP investments…which continued to rally and made All Time Highs on September 19…a date we believe was a Key Turn Date…a date when Market Psychology across asset classes registered a definite shift to “risk off”…and that shift intensified (!!!) over the next 4 weeks.
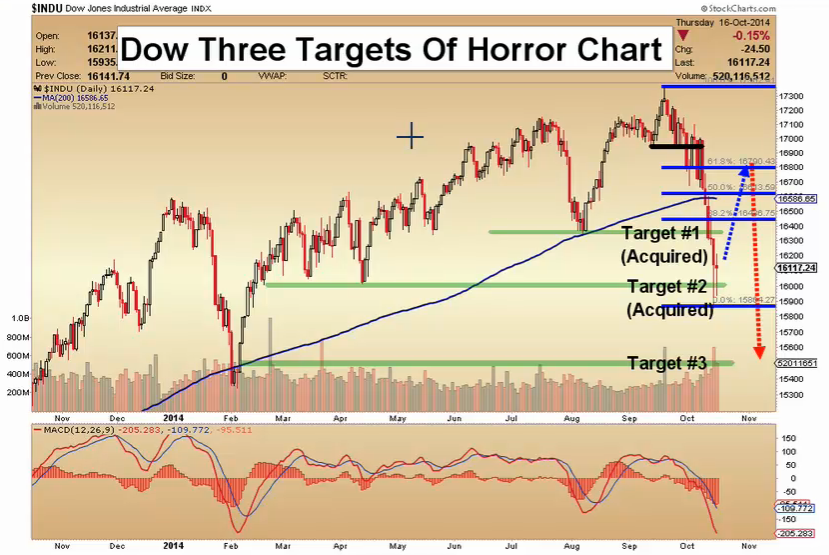
September 19 may well have marked the 2014 highs for the stock market. Bullish Market Psychology has been hit hard…and Fear showed up (Big Time!) for the first time in a long time. We’ve been expecting the market to roll over with “topping action”…price breaks and rallies…but no new highs…rather than to just “turn on a dime” and start down. We weren’t expecting the DJIA to drop nearly 1,500 points just for openers, but given that it has we would not be surprised to see it rally back 50% to 70% of that break…which would take it into the 16,600 to 16,900 range. We will be looking for an opportunity to get short if/when any “bounce back” rally runs out of gas. The harder trade will be to get short if there is no “bounce back” rally…to get short if the market just breaks lower from here.


The VIX (fear index) hit 3 year highs Wednesday…fell back…but still closed the week at 2 year highs.

Interest Rates: A mid-week panic drove Treasury prices sharply higher last week…while junk tumbled. As the panic subsided Treasuries fell back…but still closed at their best levels in over a year.

The nightly news is all about the drama in the stock markets…but the action in the credit markets may be far more important…junk bond issuers, who have feasted on cheap capital provided by “reaching for yield” investors may have to “pay up” for money in the future…and some “investment grade” issuers may get marked down to “speculative.”

Currencies: The CAD registered its lowest close in 5 years last week…the recent Big Break in Crude helped to drag it down. Note that the 2011 CAD high of 1.06 was made as the commodity indices topped out…and as the Bull Market in the US Dollar began.

The US Dollar Index closed lower for the 2nd week in a row…but it’s still very close to 4 year highs. We had a great run long the Dollar…we think it goes much higher over the next couple of years…we are looking for a spot to reestablish long positions. We realize that both the Fed and the Treasury are “concerned” about the effects of the Dollar’s rally. We believe that “currency wars” will intensify if global growth remains weak. We see capital “coming to America” for safety and opportunity…regardless of what American authorities may prefer.

Gold rallied almost $70 from its early October lows….creating a triple bottom on the charts…as Gold Bulls hoped that the stock market scare would inspire Central Banks to “keep printing.” The weaker US Dollar also gave gold a lift the past couple of weeks…BUT…we think King Dollar will prevail…and new lows lie ahead for gold.

WTI Crude briefly fell below $80 BBL last week…a 5 year low…while the Canadian benchmark…Western Canada Select…briefly traded below $70 BBL.
HUGE speculative long positions in Crude Oil (over 450,000 contracts…each for 1,000 BBL WTI) were accumulated as crude rallied to 3 year highs in June 2014. When prices began to fall in July we twice noted that the “unwinding” of these huge spec long positions would exacerbate the decline. We had been short WTI in May/June on the “supply/demand” story but were stopped out when prices rallied on the early ISIS successes in Iraq. We failed to reestablish our short positions as crude broke down…probably our worst trading blunder of the year!
At the last “count date” of October 14/14 the large spec long positions totaled ~280,000 contracts…down nearly 200,000 from the June highs. The total is probably lower today as prices dropped further on BIG volume Wednesday and Thursday. Crude may “bounce back” the next week or two IF Market Psychology across asset classes turns less fearful…BUT…if/when crude turns down again liquidation of “under-water” large spec long positions will add to the price decline.

WTI Option volatility hit record lows in June 2014 as prices hit 3 year highs (option volatility was ultra-low across all asset classes this past summer.) WTI option vol has nearly tripled from those lows…as bearish Market Psychology has intensified.

Short term trading:
Currencies: We were out of our long US Dollar positions by the end of September…we’d been long for months but thought that the Dollar had gone up too far too fast. We’ve been short commodity currency calls the past few weeks.
Stocks: We bought S+P puts on September 19 but covered (too early) after 2 weeks and then could not find a “comfortable” place to get re-establish bearish positions.
We looked at selling OTM puts on crude and the S+P late last week…it felt as though those markets “had to bounce”…and option premiums had sky-rocketed as FEAR drove the markets down… but we decided, “We don’t have to make this trade,” and just sat on the sidelines watching the show.
We look for the US Dollar to resume its rally and we will get long again. We think that assets that have run higher on central bank printing will fall and we will look to get short.
Longer term:
We wonder if September 19 will prove to be what George Soros would have called an “Inflection Point”…a point at which “the trend” changes. The BIG trend we are considering here is the Bullish Market Psychology trend…a trend wherein investors were blithely confident that Central Banks “had their backs”…a trend wherein credit spreads got narrower and narrower as desperate “reaching for yield” as investors plunged into questionable offerings…a trend wherein deeply indebted Eurozone countries “tried” to reign in their budget deficits…a trend wherein total outstanding debt grew and grew while global growth didn’t…despite all that “printing” from the Central Banks. For the past few years we’ve said that the “main driver” of Market Psychology was the anticipation of Central Bank actions…at the margin nothing else mattered. Something changed in September 2014…and it might have been the dawning of the realization that, “All of the King’s horses and all of the King’s men couldn’t put Humpty together again.”

Here are today’s videos:
Dow Three Targets Of Horror Charts Analysis
Gold Fibonacci Target Charts Analysis
Silver Fibonacci Target Charts Analysis
GDX Fibonacci Target Charts Analysis
GDXJ Fibonacci Target Charts Analysis
US Dollar Collapse Begins Charts Analysis
Thanks,
Morris
Oct 17, 2014 Super Force Signals special offer for Money Talks Readers:
Send an email to trading@superforcesignals.com and I’ll send you 3 of my next Super Force Surge Signals free of charge, as I send them to paid subscribers. Thank you!
The SuperForce Proprietary SURGE index SIGNALS:
25 Surge Index Buy or 25 Surge Index Sell: Solid Power.
50 Surge Index Buy or 50 Surge Index Sell: Stronger Power.
75 Surge Index Buy or 75 Surge Index Sell: Maximum Power.
100 Surge Index Buy or 100 Surge Index Sell: “Over The Top” Power.
Stay alert for our surge signals, sent by email to subscribers, for both the daily charts on Super Force Signals at www.superforcesignals.com and for the 60 minute charts atwww.superforce60.com
About Super Force Signals:
Our Surge Index Signals are created thru our proprietary blend of the highest quality technical analysis and many years of successful business building. We are two business owners with excellent synergy. We understand risk and reward. Our subscribers are generally successfully business owners, people like yourself with speculative funds, looking for serious management of your risk and reward in the market.
Frank Johnson: Executive Editor, Macro Risk Manager.
Morris Hubbartt: Chief Market Analyst, Trading Risk Specialist.
website: www.superforcesignals.com
email: trading@superforcesignals.com
email: trading@superforce60.com
SFS Web Services
1170 Bay Street, Suite #143
Toronto, Ontario, M5S 2B4
Canada
###
Oct 17, 2014
Morris Hubbartt

-
I know Mike is a very solid investor and respect his opinions very much. So if he says pay attention to this or that - I will.
~ Dale G.
-
I've started managing my own investments so view Michael's site as a one-stop shop from which to get information and perspectives.
~ Dave E.
-
Michael offers easy reading, honest, common sense information that anyone can use in a practical manner.
~ der_al.
-
A sane voice in a scrambled investment world.
~ Ed R.
Inside Edge Pro Contributors

Greg Weldon

Josef Schachter

Tyler Bollhorn

Ryan Irvine

Paul Beattie

Martin Straith

Patrick Ceresna

Mark Leibovit

James Thorne

Victor Adair