
Stocks & Equities

In this week’s issue:
- Weekly Commentary
- Strategy of the Week
- Stocks That Meet The Featured Strategy
In This Week’s Issue:
- Stockscores’ Market Minutes Video – Trading a Correction
- Stockscores Trader Training – Trading Tactics For Corrections
- Stock Features of the Week – Bottom Fishing Energy Stocks
Stockscores Market Minutes Video – Trend Reversals
There are ways you can make money from a market correction, in many ways it is an easy environment to trade profitably. Tyler highlights what he is doing while the market pulls back plus provides his weekly market analysis.
Click here to watch on Youtube
Trader Training – Trading Corrections
For a number of weeks, I have been cautious on the markets. Weakness has been lead by the small caps and commodity stocks and now that weakness has spread to the large caps. This week, the S&P 500 broke its long term upward trend line, setting up for what will likely be another 3 to 5% downward move before the next trend line of support is hit.
Here is a list of things to keep in mind when the market is correcting:
1. Stocks Can Go Down To Zero – I often hear investors tell me that they bought a stock because it had fallen so far already, it just had to bounce back. After all, stocks can not go down forever. Yes, that is true, stocks can only go down to zero and then they stop, but a stock that does go to zero is eternally gone. Do not buy something because it appears to be on sale, you should only buy something if it is more likely to go up than down.
2. Never Average Down – averaging down is the practice of buying more of a stock you are losing on as the price falls. Investment advisors sometimes refer to this as dollar cost averaging, but basically, it is all about buying more of a stock that has proven your original decision wrong. If you were betting on a horse that was in last place half way down the back straight of the Kentucky Derby, would you go back to the wager window and add more to your bet if you were able to? Of course not! Buying more when you are wrong is no different, so just wait until the market proves you right and average up.
3. Trade With Who Is In Control – next time you are in an airport, hop on one of those moving sidewalks that speeds you to the gate. When you get off, turn around and hop back on but this time, going against the traffic to understand what it is like trying to trade against the momentum of the market. Yes, it is possible but it sure is a lot harder than going with the flow. The market is no different; you will always have an easier time if you select strategies that are appropriate for the market condition. To understand whether the buyers are in control or the sellers, look at a chart of the stock or market index. If the tops are falling, the sellers are in control. If the bottoms are rising, the buyers are in control. So long as you can draw a line on the chart with a ruler, you can do this analysis and save yourself from a lot of difficulty.
4. Don’t Apply Logic – many investors make the mistake of using logic to make their trading decisions. The market
will do a lot of things that do not make any sense because the market has information that you don’t have. A stock that “should” be going higher may not because a large shareholder has learned that there are problems that the general public does not know about. Or perhaps a large shareholder has a liquidity problem and has to sell stock whether they like it or not. You can not argue with what the market does and you will never convince the market that it is wrong. You just have to do what the market tells you to do.
5. Don’t Take More Risk Than You Are Comfortable With – the great enemy of every investor is emotion. It makes us break our rules and lose our discipline. We are emotional because we have an attachment to money that we must learn to minimize if we are going to have a chance of beating the market. The first step toward that goal is to find comfort in the risks that you take. If your exposure to financial loss is too great, you will break the rules and forget your discipline because you don’t want to feel the pain of the loss. If all you are facing is a manageable amount of discomfort, you are more likely to trade well.
6. Markets Predict, Not React – the market is a leading indicator for the economy; it tends to move at least six months early. This means you can not look at the world around you and use what you see to make trading decisions. Since the market looks ahead, so too must you and think about what will happen in the future instead of what has already happened.
7. Diversification Does Not Mitigate Risk – this market is a perfect example of how you can not diversify away risk. An investor with money in bonds, commodities, industrials, technology and banking is feeling losses in all areas. The best way to manage risk is to limit losses. If the market proves you wrong on a decision, get out and take the small loss. Never let small losses grow in to big ones.
8. The Market Never Lies – all markets express the opinions of those who trade it and the wisdom of the crowd is far smarter than you or I can ever be. If you learn how to read the true message of the market, you can make money by doing what it tells you to do. If, instead, you try to outsmart the market, you will likely get your ego delivered to you in the form of debits to your trading account. Do you think you are smarter than thousands of people?
9. Everyone is Smart in a Bull Market – riding a trend is the best way to make money, but many investors confuse their trend timing with investment intelligence. The truly good traders are those that can beat the market in all market conditions. Don’t fall in to a false sense of security if you make money while everything is going up because you are likely to give it all back. For most, profits in the market are just short term loans.
10. Leverage is a Double Edged Sword – all of the problems that we are seeing in the market and the economy right now are because of leverage. Yes, you can improve your return if you borrow money to make money, but always remember that you can also increase the loss potential if the market goes against you. If you use leverage, it is even more important to manage risk and have discipline. If you don’t understand the true risk that the leverage of margin, options and other derivatives provide, don’t trade them.
Energy stocks have been in a steep downward trend as Oil has been moving lower over the past month. Oil is near support, the US Dollar is hitting resistance where it may stall, giving some relief to the Oil market. This week, I went in search of Canadian Energy stocks that pay a dividend, were doing well before Oil started its collapse and are now at or near long term support. These stocks have the best potential to make good bounce back in the short term.
Watch the charts, either an hourly or daily chart, for a break of the downward trend and then a break to the upside from a rising bottom. Those are good signs that the selling pressure is reversing.
1. T.ZAR
T.ZAR has fallen from $9.50 to $6 over the past few months and is now at the lows that held in the Spring of 2013. Historical yield 7.8%. Watching for a move up through $6.30.

2. T.BTE
T.BTE has fallen to its 2013 low but showed some strength on Friday, indicating it may be ready to make bottom. Historical yield 5.4%. Watching for a move up through $38.50.

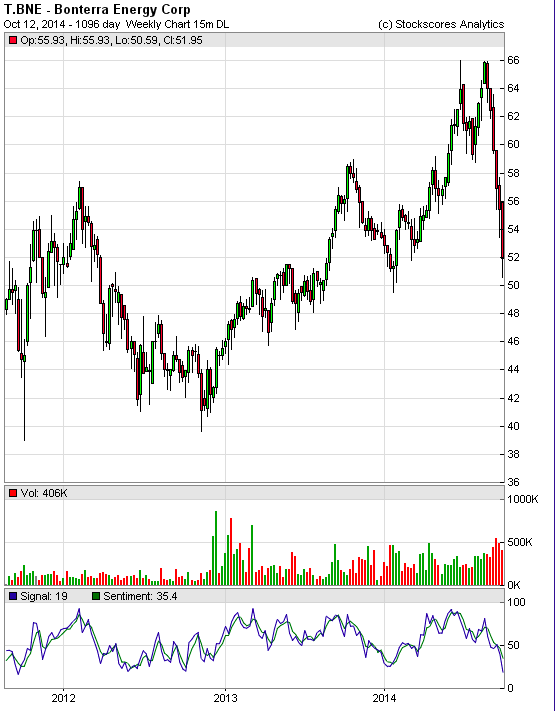
3. T.BNE
T.BNE was in a strong upward trend before the Fall but has now pulled back to test the lows for 2014. Historical yield of 5.4%. Watch for a break up through $53
The New Stockscores Trader Education Center – Sneek a Peek
Stockscores will be launching a new online trader education center in the next two weeks. Those who would like a sneek peek should register for the upcoming webinar:
Wednesday Oct 15 6:00pm PT, 9:00pm ET
Click here to register
I will also do a discussion of the current market and how I am trading it.
The Toronto Money Show
Join Tyler Bollhorn and a star-studded cast of financial experts at The World MoneyShow Toronto (Metro Toronto Convention Center) this October 16-18. Tyler will be speaking on Saturday Oct 18th at 12:45 – 1:30 on How to Find and Trade Hot Stocks.
Attendance is free but you must register. For more information, and to register, click here
References
- Get the Stockscore on any of over 20,000 North American stocks.
- Background on the theories used by Stockscores.
- Strategies that can help you find new opportunities.
- Scan the market using extensive filter criteria.
- Build a portfolio of stocks and view a slide show of their charts.
- See which sectors are leading the market, and their components.
Disclaimer
This is not an investment advisory, and should not be used to make investment decisions. Information in Stockscores Perspectives is often opinionated and should be considered for information purposes only. No stock exchange anywhere has approved or disapproved of the information contained herein. There is no express or implied solicitation to buy or sell securities. The writers and editors of Perspectives may have positions in the stocks discussed above and may trade in the stocks mentioned. Don’t consider buying or selling any stock without conducting your own due diligenc


Today’s videos:
Russell Index Leads Dow Wipeout Charts Analysis
Gold First The Drop And Now The Pop Charts Analysis
Silver Fuel Cells Accumulation Charts Analysis
GDX Support & Resistance Charts Analysis
GDXJ Fuel Cell Volume Charts Analysis
Thanks,
Thanks,
Morris
Super Force Precious Metals Video Analysis
posted Oct 10, 2014
“Our main format is now video analysis…”‘
Oct 10, 2014 Super Force Signals special offer for Money Talks Readers:
Send an email to trading@superforcesignals.com and I’ll send you 3 of my next Super Force Surge Signals free of charge, as I send them to paid subscribers. Thank you!
The SuperForce Proprietary SURGE index SIGNALS:
25 Surge Index Buy or 25 Surge Index Sell: Solid Power.
50 Surge Index Buy or 50 Surge Index Sell: Stronger Power.
75 Surge Index Buy or 75 Surge Index Sell: Maximum Power.
100 Surge Index Buy or 100 Surge Index Sell: “Over The Top” Power.
Stay alert for our surge signals, sent by email to subscribers, for both the daily charts on Super Force Signals at www.superforcesignals.com and for the 60 minute charts atwww.superforce60.com
About Super Force Signals:
Our Surge Index Signals are created thru our proprietary blend of the highest quality technical analysis and many years of successful business building. We are two business owners with excellent synergy. We understand risk and reward. Our subscribers are generally successfully business owners, people like yourself with speculative funds, looking for serious management of your risk and reward in the market.
Frank Johnson: Executive Editor, Macro Risk Manager.
Morris Hubbartt: Chief Market Analyst, Trading Risk Specialist.
website: www.superforcesignals.com
email: trading@superforcesignals.com
email: trading@superforce60.com
SFS Web Services
1170 Bay Street, Suite #143
Toronto, Ontario, M5S 2B4
Canada
fortune by speculation and kept it.” – Andrew Carnegie
The stock market decided to get a whole lot more interesting this week. On Thursday, the S&P 500 fell 2.09% for its worst day in six months. This was surprising, considering how calm the markets had been. Earlier this year, there was a three-month stretch when the index never had a 1% day. Now it’s happened four times in the last five days.
During Thursday’s trading, the Volatility Index spiked to over 19. Just a few days ago, it was less than 12. In the last few issues, I’ve talked about the distorting impact that the strong dollar has had on the markets. Now we’re seeing some of the negative fallout. On Thursday, the S&P 500 closed at 1,928.21. That’s a two-month low, and it’s a loss of 4.13% from the all-time high close of September 18.

That’s not a big loss, but remember, we haven’t had a 10% correction in three years. I should remind all investors that every few years, stocks go down. It’s just the nature of the beast. But now we’re in earnings season, and this is when every stock is judged by the market. For disciplined investors, we also want to pay close attention to the earnings guidance from our stocks.
In this week’s issue, I’ll walk you through what’s been roiling the market. I’ll also highlight three of our Buy List stocks which have earnings reports coming next week. For the broader market, I’m expecting a mild earnings season. Nothing great, but not terrible either. I’ll also have some updates on our Buy List stocks, but first, let’s look at what has the market so rattled lately.
Volatility Makes a Comeback
…..read more HERE
Briefly: In our opinion, speculative short positions are favored (with stop-loss at 1,985 and profit target at 1,900, S&P 500 index)
Our intraday outlook is bearish, and our short-term outlook is bearish:
Intraday (next 24 hours) outlook: bearish
Short-term (next 1-2 weeks) outlook: bearish
Medium-term (next 1-3 months) outlook: neutral
Long-term outlook (next year): bullish
The U.S. stock market indexes lost between 1.4% and 1.6% on Tuesday, retracing last week’s rebound, as investors sold stocks ahead of economic data announcements, quarterly corporate earnings releases, among others. Our yesterday’s intraday outlook has proved accurate. The S&P 500 index bounced off the resistance level at around 1,980-1,985, as it broke below the level of 1.950. The nearest important level of support is at 1,925-1,930, marked by last Thursday’s daily low. There have been no confirmed positive signals so far, as we can see on the daily chart:

Click Chart for Larger Image
Expectations before the opening of today’s session are virtually flat, with index futures currently down 0.1%. The
main European stock market indexes have lost 0.6-0.9% so far. Investors will now wait for the FOMC Minutes release at 2:00 p.m., looking for hints regarding potential monetary policy changes. The S&P 500 futures contract (CFD) trades close to it local low, as it fluctuates along the level of 1,930. The nearest important resistance level is at around 1,930-1,935, and the level of support is at 1,915-1,920, marked by recent local low, as the 15-minute chart shows:

The technology Nasdaq 100 futures contract (CFD) follows a similar path as it trades closer to last week’s local low, testing support level of 4,930-4,950. On the other hand, the level of resistance is at 3,980-4,000, among others:

Concluding, the broad stock market retraced its recent move up and it may continue short-term downtrend. So, we remain bearish, expecting more downside. We continue to maintain our already profitable speculative short position with entry point at 2,000.5 – S&P 500 index. The stop-loss is at the level of 1,985. Potential profit target remains at 1,900 (S&P 500 index). It is always important to set some exit price level in case some events cause the price to move in the unlikely direction. Having safety measures in place helps limit potential losses while letting the gains grow.
Thank you.
As the market goes deeper into corrective mode, we’ll take a look at our weekly indicators and our cycle timer.
Since it’s Wednesday, we get our first updates on weekly sentiment. The bulls/bears data is made up of two parts (obviously). But the divergence in bulls and bears is concerning. The bulls are the fewest in some time.

This leaves the market vulnerable. The bulls are right where they were last time we looked. At the middle of their range. But the following indicator is reaching an extreme:

Now this isn’t the most precise indicator, but when it reaches an extreme, it’s worth considering. This extreme is actually bullish for the market.
Another indicator on the bullish side:

For the past few years, this level has suggested the market is close to a bottom. This is more of a technical indicator than a sentiment indicator because it’s based on price action, so I rank this higher than the above.
And finally, our 10/20/40 week cycle chart:

We have been looking for this 10/1 correction all year, but it’s coming a little late (which is bearish).
So where does that leave us?
At the end of the day (I always say that) the market is vulnerable here, since fear is not growing as prices move lower and we’re still in the window of the crash I predicted a few weeks ago. That being said, we’re approaching a level on some measures where we would begin to expect the markets to rebound. So we’ll watch the markets even closer now for action in our services. I.e. in our QQQtrader, we’re short the Qs. In our options service, we’re still short oil and gold. And we issued our covered call recommendations near the top, so they should all pan out as we move into this expiration.
And expiration will be key – as I believe markets reverse into expiration, so that’d be my target date for the bottom to be set. If fear builds to the right levels, the market could rally strongly out of expirations.
On an administrative note, we’re going to consolidate all our Barometer services as we make room for our next trader, who’ll not only incorporate his techniques on stocks, but on forex and futures as well. His name is Ian Mitchell and we’re excited to have him joining our team later this month. Again, we’re broadening our scope of services to help you profit from the coming markets over the next decade as we are moving into a period where we expect substandard market returns. That means the Buy and Hold strategies that worked since the March 2009 bottom will need to be replaced by strategic portfolio management. So stay tuned!
Regards,
About Stock Barometer
Stock Barometer is a paid subscription service comprised of several newsletters for both investors and traders. Written by our trading experts Stock Barometer specializes in using his sophisticated methods of market analysis to uncover the most promising short-term trading opportunities as well as long-term investments.
Stock Barometer is completely independent. We have never and will not ever accept compensation from any company whose stock we recommend.
Our goal is to make you money. We offer you the tools and information to do so and leave it to you, the individual investor, to apply them in the best way possible.

-
I know Mike is a very solid investor and respect his opinions very much. So if he says pay attention to this or that - I will.
~ Dale G.
-
I've started managing my own investments so view Michael's site as a one-stop shop from which to get information and perspectives.
~ Dave E.
-
Michael offers easy reading, honest, common sense information that anyone can use in a practical manner.
~ der_al.
-
A sane voice in a scrambled investment world.
~ Ed R.
Inside Edge Pro Contributors

Greg Weldon

Josef Schachter

Tyler Bollhorn

Ryan Irvine

Paul Beattie

Martin Straith

Patrick Ceresna

Mark Leibovit

James Thorne

Victor Adair