
Stocks & Equities

Time to Be Selective
In this week’s issue:
- Weekly Commentary
- Strategy of the Week
- Stocks That Meet The Featured Strategy
In This Week’s Issue:
- Stockscores’ Market Minutes Video – Trend Reversals
- Stock Features of the Week – Gold, Oil and The US Dollar
- Stockscores Trader Training – Time to Be Selective
Trader Training – Be Selective
This is the time of year when it is really necessary to be selective with the trades you take. We are at the seasonal end of the weak season for trading, the market tends to improve sometime in October or November.
Before that happens, the market also tends to be its most volatile and difficult. We often get sharp corrections at this time of year so it is essential to be very fussy about the trades you take. We are likely within a few weeks of an improvement in the market, so be patient.
It’s better to miss a good trade than to take a bad one. Missing a good trade doesn’t deplete your capital-it only fails to add to it. A bad trade will not only reduce the size of your trading account, it will eat up emotional capital and your confidence.
A losing trade is not a bad trade. Bad trades are simply taking the trade that doesn’t meet your requirements. Bad trades come from working hard to see something that’s not there, guided by your need to trade rather than the market offering a good opportunity.
I have read very few books about the stock market, but one that I’ve read more than once and that I think is a must-read for every investor is Reminiscences of a Stock Operator by Edwin Lefevre. Here is a wonderful quote from that book that captures the essence of what this chapter is about:
What beat me was not having brains enough to stick to my own game-that is, to play the market only when I was satisfied that precedents favored my play. There is the plain fool, who does the wrong thing at all times everywhere, but there is also the Wall Street fool, who thinks he must trade all the time. No man can have adequate reasons for buying or selling stocks daily-or sufficient knowledge to make his play an intelligent play.
-Reminiscences of a Stock Operator
I advise all my students that they will make more money by trading less, at least so long as trading less is the result of having a high standard for what they trade. If you tell yourself you’re limited to only making 20 trades a year, you’re probably going to be very fussy about what trades you take. With less than two trades to be made each month, only the very best opportunities will pass your analysis. All of the “maybes” or “pretty goods” will get thrown out.
We take the pretty good trades because we’re afraid of missing out. It’s painful to watch a stock you considered buying but passed on go up. You remember this pain and the next time you see something that looks pretty good, you take it with little regard for the expected value of trading pretty good opportunities.
Pretty good means the trade will make money some of the time and lose some of the time, and the average over a large number of trades may be close to breaking even. The fact that one pretty good trade did well is reasonable and expected. In the context of expected value, taking those pretty good trades many times will lead to less than stellar results when the losers offset the winners.
You shouldn’t judge your trading success one trade at a time. You must look at your results over a large number of trades. To maximize overall profitability requires you to have a high standard for what trades you make. Maintaining that standard will be easier if you take the trades that stand out as an ideal fit to your strategy, not by taking those that are marginal and require a lot of hard work to uncover.
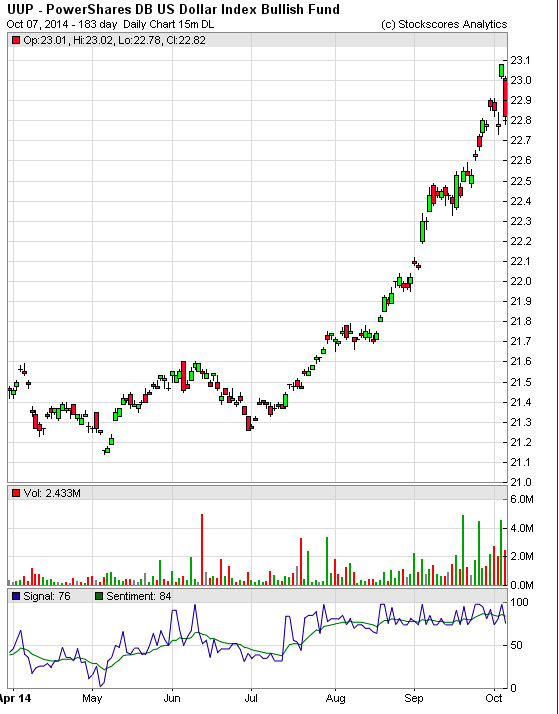
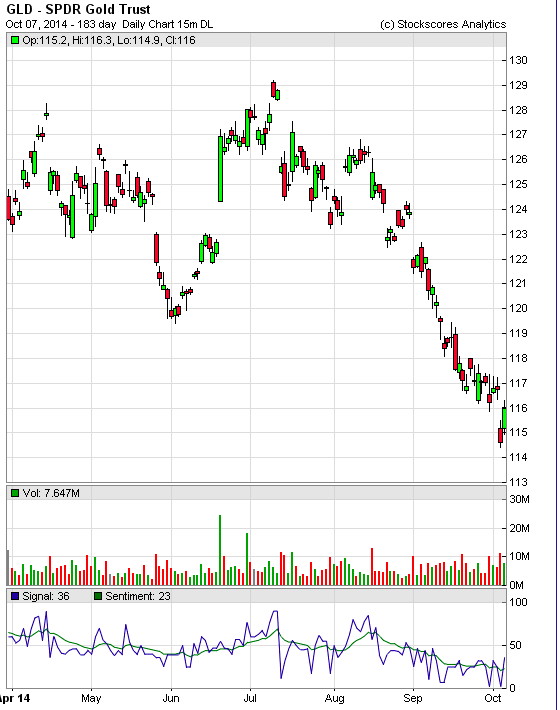
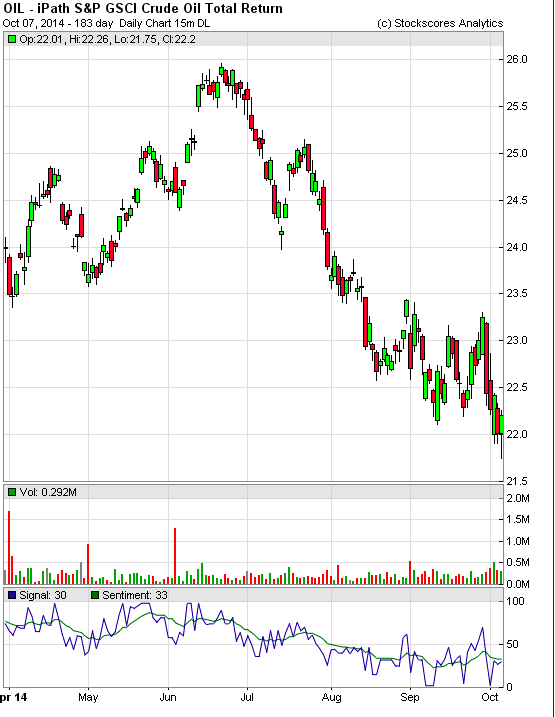
This week’s Market Minutes video is about trend reversals. There is a very steep upward trend in the US Dollar which is causing most commodities to be in very steep downward trends. Eventually these oversold trends will reverse but trying to catch the bottom is like trying to catch a falling knife.
Here are the charts of Gold, Oil and the US Dollar.
To catch the trend reversal, watch for the following three things:
1. Break of the trend line
2. Formation of a rising bottom (or a falling top on the US Dollar)
3. Break from a rising bottom
Until that happens, avoid these sectors. The US Dollar fell sharply today, as it is hitting long term resistance, so we may be very close to a reversal so watch these charts closely.
1. UUP
2. GLD
3. OIL
The New Stockscores Trader Education Center
Stockscores will be launching a new online trader education center in the next two weeks. Those who would like a guided tour should register for the upcoming webinar:
Wednesday Oct 15 6:00pm PT, 9:00pm ET
Click here to register
The Toronto Money Show
Join Tyler Bollhorn and a star-studded cast of financial experts at The World MoneyShow Toronto (Metro Toronto Convention Center) this October 16-18. Tyler will be speaking on Saturday Oct 18th at 12:45 – 1:30 on How to Find and Trade Hot Stocks.
Attendance is free but you must register. For more information, and to register, click here
Stockscores Market Minutes Video – Trend Reversals
What are the important signs of a trend reversal? This week, Tyler shows how both up and down trends tend to reverse and what to watch for. Plus, his regular weekly market analysis.
Click here to watch on Youtube
References
- Get the Stockscore on any of over 20,000 North American stocks.
- Background on the theories used by Stockscores.
- Strategies that can help you find new opportunities.
- Scan the market using extensive filter criteria.
- Build a portfolio of stocks and view a slide show of their charts.
- See which sectors are leading the market, and their components.
Disclaimer
This is not an investment advisory, and should not be used to make investment decisions. Information in Stockscores Perspectives is often opinionated and should be considered for information purposes only. No stock exchange anywhere has approved or disapproved of the information contained herein. There is no express or implied solicitation to buy or sell securities. The writers and editors of Perspectives may have positions in the stocks discussed above and may trade in the stocks mentioned. Don’t consider buying or selling any stock without conducting your own due diligenc

So, for now at least, the “bulls” remain in charge of the current rally that begin the Federal Reserve’s market interventions in late 2012. The seemingly inexhaustible rise, despite rising geopolitical tensions, extremely cold weather and weak economic data, has defied logic and lulled market participants into an excessive state of complacency. In fact, the bulls continually argue that the “retail” investor has yet to jump into the markets that will keep the bull market alive.
The chart below suggests that they are already in. At 30% of total assets, households are committed to the markets at levels only seen near peaks of markets in 1968, 2000, and 2007.

…..continue reading HERE

VIX Voodoo Analysis
The Volatility Index (VIX) seems to be indicating something big is brewing. Let’s investigate taking a bottom up approach beginning with the daily chart.
VIX Daily Chart

Since the low back in July 2014, price has developed a pattern of higher highs and higher lows – a bull trend. The Stochastic and Moving Average Convergence Divergence (MACD) indicators have just turned bearish so perhaps price is now headed down to put in yet another higher low. Where is this next low likely to be?
I have drawn a green highlighted circle which shows a gap. The high of the gap is 13.13 while the low of the gap is 12.61. I expect this gap to be filled before any continuation of the uptrend.
I have added a Fibonacci Fan from the low to recent high. Price looks to show some nice symmetry with this fan. Looking retroactively we can see price has found support a couple of times at the 76.4% angle. Perhaps price is headed back down for another test of the angle support.
I have added Fibonacci retracement levels of the move from low to recent high. The 76.4% fan angle is just above the 76.4 retracement level at 12.08. This is where I’m looking for price to make its higher low and can be seen in the orange highlighted circle.
VIX Weekly Chart

The Bollinger Bands show price bobbing up and down between the upper and middle bands over the last couple of months. Price looks headed back down now and perhaps the middle band will provide support once again. Let’s see.
The Parabolic Stop and Reverse (PSAR) indicator shows a bullish bias after price busted the dots to the upside last week. These dots will be support for any move down now and if this support holds then it can act as a springboard for price to surge higher. The dots are just below the previous low of 11.52.
The MACD indicator shows a recent bullish crossover and this is coming on top of a quadruple bullish divergence. Something big looks set to take place here shortly.
VIX Monthly Chart

If a quadruple bullish divergence on the weekly chart wasn’t enough, how about on the monthly chart?! Both the Relative Strength Indicator (RSI) and MACD indicator are showing quadruple bearish divergences. The MACD is also bullish so conditions are certainly ripe for an explosion higher.
The PSAR resistance held price in its attempt already this month to crack higher. Price looks headed down now but perhaps if price can turn back up this month it will be successful on its second attempt.
As for where price may come back to, I favour price consolidating the September candle. The open price for September was 12.32 and I suspect price can trade back to that level.
Let’s now zoom out for some big picture perspective with the yearly chart.
VIX Yearly Chart

I have added some simple Elliott Wave annotations which show the spike high in 2008 as the end of wave 1. That seems hard to believe but taking out the emotion that was the first major top after the all time low.
Price now looks like it is setting up a higher low which would be the end of wave 2. That implies wave 3 has already begun which should see price explode higher above the all time high of 96.40. I know this seems far-fetched but could it really be possible?
The RSI looks to be building strength with a pattern of higher highs and higher lows.
Momentum also appears to be building and it will be interesting to see if it takes out its own 2008 high. One possibility is price makes a new high while momentum does not. Time will tell.
This VIX analysis suggests something terrible and devastating is likely to happen to the stock market. Bears would be licking their lips.
Let’s quickly look at the yearly chart of the Dow to see if this VIX analysis fits with its long term picture.
Dow Yearly Chart

This yearly chart begins in 1900.
The RSI looks set to show a triple bearish divergence on this top.
The Stochastic indicator looks like it is having one last hurrah in overbought territory.
The MACD indicator shows the averages have diverged wildly which looks in need of some “regression to the mean”.
Momentum looks to have fallen off a cliff.
Hmmm. I don’t really think I need to comment further.
follows religiously the new.” – Henry David Thoreau
The last two weeks have been rough for the stock market. Over the last ten sessions, the S&P 500 has lost 3.24%. The index recently fell below its 50-day moving average, which is a cautious sign, and the 200-DMA is closing in on us. The small-cap Russell 2000 has already lost more than 10% from its high, which is the traditional definition of a correction.
What’s the reason for the slip? That’s always hard to say. It’s probably a mix of bad news: ISIS, Ebola, Hong Kong and some disappointing economic news. I recently predicted such a minor pullback, and I suspect we have a bit more to go. But the big story for investors is the surging U.S. dollar. The greenback is flattening every currency out there.
 In this week’s CWS Market Review, we’ll take a look at how investors should go about investing in a strong-dollar world. I’ll also discuss the lower guidance we got this week from Ford Motor. The shares took a nasty slide this week, but I’m not backing away. On the bright side of our Buy List, eBay wisely decided to spin off PayPal. The shares jumped 7.5% on the news. Later on, I’ll take a look at an important but overlooked part of this rally, which is the tremendous growth of dividends. But first, let’s look at how the strong dollar continues to impact our portfolios.
Investing in a Strong-Dollar World
There’s been a recent rash of worse-than-expected economic data. This week’s ISM report came in a bit light. Personal income missed expectations. Construction spending was unexpectedly negative, and the ADP employment report was below expectations.
I’m writing this to you early on Friday, ahead of the big September jobs report. The last jobs report was a bit weak, but nothing too terrible. I doubt that a larger trend has started, but we always want to focus on the facts, not what we hope.
Despite some troubling economic data, the investing climate is still dominated by the strong dollar. Actually, I understated that. Everybody and everything is massively fixated on the surging greenback. It’s impacting nearly every market. Of course, it’s not so much that the dollar is strong as that everything else is weak, so the dollar looks good by comparison.
Just look at Japan. The yen is getting steamrolled. This week, for the first time since 2008, the yen hit 110 to the dollar. The Japanese stock market just took its biggest plunge in seven months.
The same thing’s happening in Europe. Stock markets there have been sliding downward. It’s as if they’re in a time machine and living through our experiences of three years ago. This week, there was a terrible report on German manufacturing which threw cold water in the face of a lot of traders. Now folks are realizing that the euro-economy is in worse shape than people thought. That’s why the dollar’s been rising and Mario Draghi, the head of the ECB, is going ahead with their bond-buying program. The yield on German 10-year bonds has slipped below 1%. That’s just crazy.
The strong dollar is also squeezing the price of several commodities. I talked about gold recently. This week, the price of oil dropped below $90 per barrel for the first time in more than a year. Production is soaring, and we’re not importing as much of the black gold as we used to. All that oil has to go somewhere, so the big producers have to cut prices. OPEC may try to cut back on production, but I can’t say how much of an impact that will have. As a result, energy stocks have been badly lagging the market.
Investing in a strong dollar world is tricky. Most of the rise in the dollar has probably passed us. Investors should continue to focus on high-quality stocks like the ones you can find on our Buy List. I especially encourage investors to make sure they own stocks with strong and secure dividends. In particular, I like Ross Stores (ROST), Microsoft (MSFT), Wells Fargo (WFC) and Qualcomm (QCOM). Cognizant Technology Solutions (CTSH) also looks very attractive here, although it doesn’t pay a dividend. Now let’s take a closer look at our problem child for this week, Ford Motor.
Ford Motor Drops on Lower Guidance
Shares of Ford Motor (F) got slammed this week when the automaker lowered its profit guidance for this year. By the end of the day on Thursday, Ford closed at $14.56 per share. Only a few weeks ago, Ford was threatening to break through $18 per share.
Before, Ford had said that its pre-profit for this year would range between $7 billion and $8 billion. Now they’re saying it will be $6 billion. There are a few culprits for the bad news. One is Europe — and Russia in particular. The sanctions there are starting to weigh heavily, and the European economy as a whole is still in rough shape. Ford said they expect to lose $1.2 billion in Europe this year. But that will improve to a loss of “only” $250 million next year.
On top of that, Ford said it had to recall 850,000 vehicles to fix an airbag problem. The total cost will be $500 million. Ford also said it projects to lose $1 billion in South America this year. One bright spot is Asia, where Ford projects a profit of $700 million.
In the U.S., Ford sees margins ranging between 8% and 9%, which is at the low end. The recalls are clearly taking a toll. To its credit, Ford remains optimistic for next year. It sees 2015 profits ranging between $8.5 billion to $9.5 billion. That’s about $2.20 to $2.45 per share in pre-tax earnings.
Here’s my take: I’m disappointed by this lower guidance. Ford has been recovering well, but there are clearly more hurdles to overcome. I’m not so concerned about the geopolitical issues; Ford can’t control those. I am, however, concerned by the recalls. They’re not a good sign.
In the longer run, Ford’s core business is still truck sales in North America. The big issue for the next 12 months is how well the new aluminum-bodied car will be received. The company has a lot at stake on this. I apologize for the rough ride in this stock, but I’m still a believer in Ford’s long-term outlook. The stock currently yields 3.43%, which is a very good yield. If Ford’s forecast for next year is right, then Ford is going for a very attractive price here. To reflect this week’s sell-off, I’m lowering my Buy Below on Ford to $17 per share.
Icahn Wins! eBay Will Spinoff PayPal
Earlier this year, Carl Icahn got into a war of words with the board of eBay (EBAY). Icahn is an “activist investor,” which means he buys big blocks of shares in a company, then demands changes to boost the share price. Corporate boards hate him, and that’s not because he’s unsuccessful. When he take a position, Carl’s usually right.
Icahn’s beef with eBay was that they should spin off their PayPal unit. The eBay board said no, and the public feud got nasty. Icahn eventually backed down, and the issue seemed to be settled, but then Apple (AAPL) announced the introduction of Apple Pay. Well, that changes things. Three weeks ago, one shockingly underpriced newsletter wrote:
PayPal is a big money-maker for eBay, and there’s been a lot of pressure on the company to sell the division. As I noted a few weeks ago, just a rumor of that news sent shares of eBay higher. Even though eBay has said they’re not interested in selling PayPal, I think the market’s evident interest will prevail. It usually does. I can’t say whether Apple Pay will crush PayPal, but I think it will add more pressure on eBay to move. The board also has “cover” to make an about-face.
Sure enough, eBay announced this week that it will spin off PayPal sometime next year. Traders loved the news: shares of eBay jumped 7.5% on Tuesday. In 2002, eBay bought PayPal for $1.5 billion. I’m pretty sure the spin-off will be for more than that. A lot more.
By the way, spin-offs are often great investments. Research has shown that once the divisions are freed from the mother ship, they often do well. Perhaps it’s the reverse dynamic at work, which has hampered so many mega-mergers. I wouldn’t surprised if PayPal were bought out not long after its spin-off.
Icahn wrote on his blog, “We are happy that eBay’s board and management have acted responsibly concerning the separation — perhaps a little later than they should have, but earlier than we expected.” I have to agree with Carl. This is good news. Look for another solid earnings report from eBay on Wednesday, October 15. eBay remains a buy up to $55 per share.
Dividends Continue to Rise
Now that three quarters of 2014 are under our belt, I wanted to look at the continuing trend of growing dividends. This has been one of the overlooked parts of the stock market’s rally. The numbers are in, and last quarter was another strong quarter for dividends. For the first time ever, the S&P 500 paid out more than $10 per share in dividends. (That’s the dividend-adjusted number; every $1 on the index is worth about $8.88 billion.)
Dividends for Q3 were $10.02 per share, which is an increase of 12.50% over last year’s Q3. Note that over the same time, the index has increased its price by 17.29%. So in terms of dividend yield, the S&P 500 has a slightly higher valuation, but both dividends and stock prices are growing roughly in line with each other. That’s why I think much of this “bubble” talk is very premature.
Dividends have grown by more than 10% for 14 of the last 15 quarters. The only exception was the fourth quarter of last year, and that’s because the fourth quarter of 2012 had been unusually strong (+22.77%) so investors could take advantage of the new tax laws. Dividends for Q3 are up more than 77% from the third quarter of 2010, while the index is up by 73%. Yes, the dividend yield is slightly higher than what it was four years ago. Some bubble.
I’m a big fan of dividends. There are so many ways a company can play around with corporate earnings, but when you get a dividend, you know it’s something real. Over the last four quarters, the S&P 500 has paid out $38.49 in dividends. Going by the index’s close on Tuesday (1,972.29), that comes to a trailing dividend yield of 1.95%.
In addition to Ford, I’m also lowering my Buy Below prices on a few more Buy List stocks. None of these are sells; I’m merely adjusting our Buy Belows to reflect the current market. I’m lowering AFLAC‘s (AFL) Buy Below to $63. The problem isn’t the company; it’s the lousy yen/dollar exchange rate. I’m dropping CA Technologies (CA) to make it a buy up to $30 per share. The stock currently yields 3.68%. I wasn’t thrilled with Oracle‘s (ORCL) last earnings report. I’m lowering our Buy Below on Oracle to $42 per share. Lastly, I’m dropping Express Scripts (ESRX) by $2 to $77 per share. The stock was our big winner last earnings season, but it’s slid back over the last few days. I still like ESRX a lot.
Shares of DirecTV (DTV) got a nice bump on Thursday after the satellite-TV company extended its Sunday Ticket package with the NFL. This is a ginormous money maker for both DTV and the NFL, so I knew they’d come together. The new deal is for eight years. It’s such a big part of DTV’s business that AT&T had the option of walking away from their merger deal if DTV lost the Sunday Ticket. This is another sign that the merger deal is progressing. DirecTV remains a buy up to $95 per share.
That’s all for now. Third-quarter earnings season officially kicks off next week, but things won’t start heating up until the following week. On Tuesday, October 14, Wells Fargo (WFC) will be our first Buy List to report Q3 earnings; eBay (EBAY) follows the next day. Be sure to keep checking the blog for daily updates. I’ll have more market analysis for you in the next issue ofCWS Market Review!
– Eddy
 Named by CNN/Money as the best buy-and-hold blogger, Eddy Elfenbein is the editor of Crossing Wall Street. His free Buy List has beaten the S&P 500 for the last seven years in a row. This email was sent by Eddy Elfenbein through Crossing Wall Street.
Briefly: In our opinion, speculative short positions are favored (with stop-loss at 2,030 and profit target at 1,900, S&P 500 index)
Our intraday outlook is bearish, and our short-term outlook is bearish:
Intraday (next 24 hours) outlook: bearish
Short-term (next 1-2 weeks) outlook: bearish
Medium-term (next 1-3 months) outlook: neutral
Long-term outlook (next year): bullish
The U.S. stock market indexes lost 1.3-1.6% on Wednesday, resuming their short-term downtrend, as investors continued to take profits following August rally, ahead of some economic data announcements, as expected. Our Wednesday’s intraday bearish outlook has proved accurate. The S&P 500 index broke below the support level of 1,960-1,965. The nearest important level of support is at around 1,930-1,940, marked by July-August bottoming consolidation. On the other hand, the resistance level is at 1,960, marked by recent short-term consolidation, as we can see on the daily chart:

Expectations before the opening of today’s session are slightly negative, with index futures currently down 0.1%.
The main European stock market indexes have lost 0.3-0.4% so far. Investors will now wait for some economic data announcements: Initial Claims at 8:30 a.m., Factory Orders at 10:00 a.m. The S&P 500 futures contract (CFD) is in an intraday downtrend, as it gets closer to yesterday’s low. The nearest important support level is at around 1,930-1,935. On the other hand, the level of resistance is at 1,940-1,950, among others, as the 15-minute chart shows:

The technology Nasdaq 100 futures contract (CFD) remains in a downtrend, as it gets closer to yesterday’s low. The resistance level is at around 3,990-4,000, marked by previous level of support. There have been no confirmed positive signals so far:
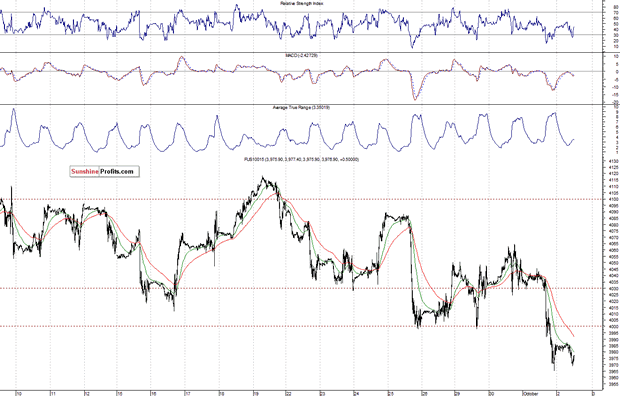
Concluding, the broad stock market resumed its short-term downtrend, moving below recent consolidation. We remain bearish, expecting a downward correction or uptrend reversal. Therefore, we continue to maintain our already profitable speculative short position with entry point at 2,000.5 – S&P 500 index. The stop-loss is at the level of 2,030 and potential profit target is at 1,900 (S&P 500 index). It is always important to set some exit price level in case some events cause the price to move in the unlikely direction. Having safety measures in place helps limit potential losses while letting the gains grow.
Thank you.

-
I know Mike is a very solid investor and respect his opinions very much. So if he says pay attention to this or that - I will.
~ Dale G.
-
I've started managing my own investments so view Michael's site as a one-stop shop from which to get information and perspectives.
~ Dave E.
-
Michael offers easy reading, honest, common sense information that anyone can use in a practical manner.
~ der_al.
-
A sane voice in a scrambled investment world.
~ Ed R.
Inside Edge Pro Contributors

Greg Weldon

Josef Schachter

Tyler Bollhorn

Ryan Irvine

Paul Beattie

Martin Straith

Patrick Ceresna

Mark Leibovit

James Thorne

Victor Adair