
Stocks & Equities
STOCK MARKET – ACTION ALERT – BULL – BUT THERE IS STILL CORRECTIVE RISK – TOO MANY BULLS OUT THERE AND I HAVE MY FINGER ON THE TRIGGER SHOULD A SELL SIGNAL APPEAR. THAT SAID, BERNANKE IS NOT LIKELY TO TRIGGER ANY PANIC.
Turnaround Tuesday triggered the anticipated rally try and today the world awaits word from ‘the man behind the curtain’. Bonds are selling off, investors are dangerously too optimistic, economic fundamentals remain at best questionable both here, in Europe and in China. Bottom line, though there are still higher technical targets in the major indexes, this is not a time to be betting on the long side except for trading purposes. I remain on a BUY signal only because a downtrend has not, as yet, been confirmed, but things could change quickly. My hunch is that a big downside surprise is on the horizon.
On Tuesday, the S&P notched its high at the open before spending the rest of the session in a steady retreat. The selling intensified during afternoon action, sending the S&P into the red as participants displayed caution ahead of tomorrow’s advance second quarter GDP report and the latest policy statement from the Federal Reserve.
The Conference Board’s Consumer Confidence Index weakened a bit in July, dropping from an upwardly revised 82.1 (from 81.4) in June to 80.3. TheBriefing.com consensus pegged the index at 81.6. The slight dip in confidence does not change the overall picture of an improving consumer base. The index likely fell back due to normal volatility after reaching a 5-year high in June. Furthermore, the University of Michigan Consumer Sentiment Index spiked to its highest level since 2007 in July, signaling that the drop in confidence was likely a non-event.
Separately, the May Case-Shiller 20-city Home Price Index rose 12.2% while a 10.5% increase had been expected by the Briefing.com consensus. This followed the previous month’s increase of 12.1%.
Today, the weekly MBA Mortgage Index will be reported at 7:00 ET and the July ADP Employment Change will be released at 8:15 ET. Second quarter GDP will be reported at 8:30 ET and the July Chicago PMI will cross the wires at 9:45 ET. The day will be topped off with the 14:00 ET release of the latest policy statement from the Federal Open Market Committee.
——————————————-
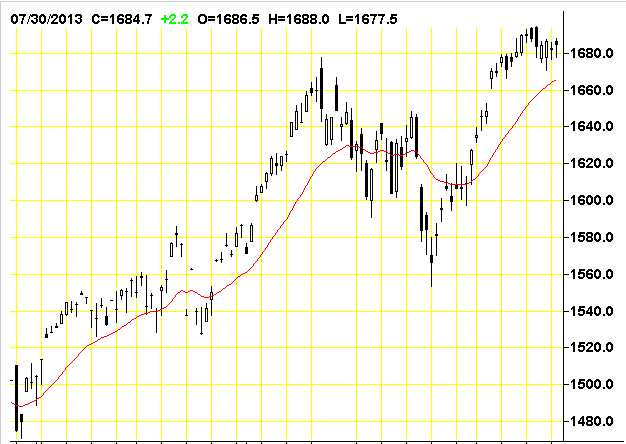
The Dow Industrials were down 1.38 at 15520.59. On Tuesday, July 23 the DJ touched a new record high of 15604.22 which was followed first by a Leibovit Negative Volume Reversal coincident with a 200 point intraday correction into Friday, July 26 into 15405.16. This defines the short-term trading range for the DJ. As a matter of reference, 14551.27 is major support under which downside potential could be another 1000 points.
——————————————–
The S&P 500 was up .63 at 1685.96. A VR was posted on July 24 and the burden of proof is on the bulls to breakout into new high ground above 1698.78. The recent low was at 1560.33 on Monday, June 24. This establishes our short-term trading range. The next big upside target is 1730.00.
——————————————–
The Dow Transports were up 20.87 at 6421.82.. We declined from 6608.87 on July 19 to 6355.04 on July 25 – a 250 point decline – establishing the current trading range. On a bigger picture basis, a ‘theoretical’ bullish reverse ‘head and shoulders’ patterns have formed: 1) From July, 2011 to present and 2) May, 2008 to present. The upside measurements are astronomical anywhere from 2600 points from the former to 3400 points to the latter ABOVE CURRENT HIGHS! If this is true and if the Transports are indeed the market leader I believe it is, we have a long way to go in this bull market, but I don’t think that is happening now. In fact, we not see those numbers until the end of the decade.
——————————————
The Russell 2000 was up 2.85 at 1043.51. The Russell touched a new high at 1056.86 intraday on July 23.
——————————————
The Nasdaq Composite was up 17.33 at 3616.47 touching 3629.12 – both new bull market highs. Looks like we’re headed to my next near-term upside potential lies to 3800. Is Bernanke trying to get the Nasdaq back to the 2000 peak of 5000?
—————————————-
The CBOE Volatility Index (VIX), which measures the cost of using options as insurance against declines in the S&P 500 (i.e., the higher the number, the more fear in the marketplace) was up .67 at 13.39. The VIX touched 21.91 intraday on Monday, June 24 – the highest high since the March 15 low of 11.21 – the lowest level since February 2007. It was unchanged at on Friday. The higher we go in the VIX, the more likely a bear cycle is upon us.
—————————————–
Four f the nine market sectors were higher on Tuesday.
XLB -0.25% Materials
XLE -0.19% Energy
XLF -0.05% Financial
XLI +0.42% Industrial
XLK +0.51% Technology
XLP -0.10% Consumer Staples
XLU +0.33% Utilities
XLV +0.02% Health Care
XLY -0.25% Consumer Discretionary
———————————————
NYSE Advance/Decline 1958/2034.
NASDAQ Advance/Decline 1301/1199.
NYSE UP volume to DOWN volume was 15 to 17.
NASDAQ UP volume to DOWN volume was 11 to 5.
——————————————–
From the VRtrader.com website here is a link to World Market Indices:
http://www.vrtrader.com/vr_free/worldmarkets/index.asp

Yesterday we highlighted Newmont Mining as a potential buying opportunity in the gold sector. Today we take a look at another interesting situation.
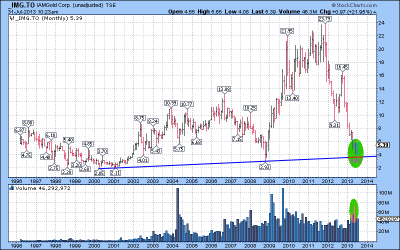
IAMGOLD (IMG.TO) is a leading mid-tier Canadian gold producer with a $2 billion market cap that operates six gold mines on three continents and also operates Niobec Inc. which is one of the world’s top three producers of niobium.
Similar to our Newmont analysis, examining the long-term monthly chart going back to 1996 there were two major lows, one at $2.05 in 2000 and the other at $2.93 in 2008. If we connect these lows you can see a long-term rising trend line that has now provided support at the $4.00 level which was the low on the stock in late June.
The recent low was also accompanied by an expansion in volume as the final sellers have liquidated their positions with new shareholders now in place. This month we have seen some renewed demand creating an inside bar on the monthly chart.
Since the stock peaked at $16.45 last October it has failed to trade above the previous months high? The June high was $5.78 and so far this month the high is $5.65. If we see some renewed strength and the shares can close above $5.65 in August we would become very bullish on IMG.
Again, we are see a great buying opportunity unfolding in a good quality gold producer with a dividend yield of 4.6%.
The information contained in this report was obtained from sources believed to be reliable, however, we cannot represent that it is accurate or complete. This report is provided as a general source of information and should not be considered personal investment advice or solicitation to buy or sell securities. The views expressed are those of the author and not necessarily those of Raymond James Ltd.

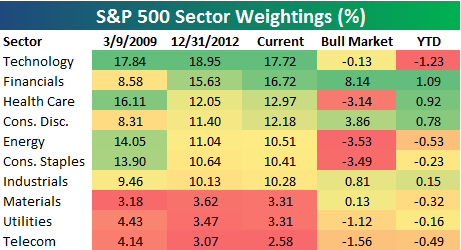
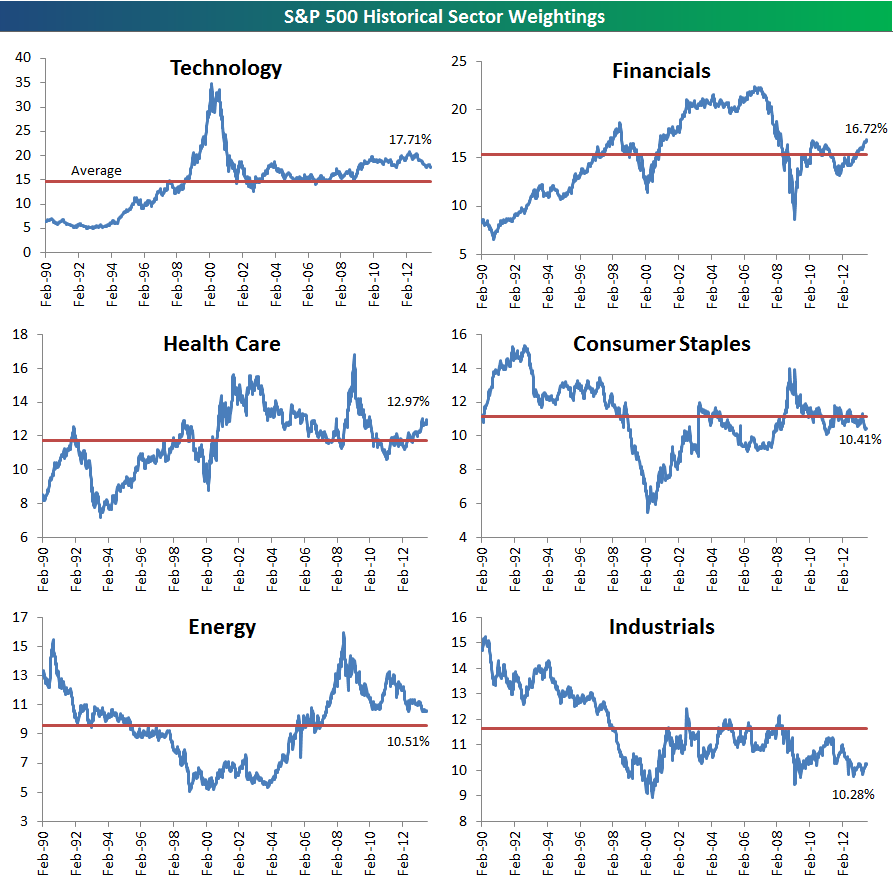
We’ve seen some pretty big moves in the weightings of sectors in the S&P 500 so far this year. Below is an updated look at S&P 500 sector weightings compared to where they stood at the start of the current bull market on March 9th, 2009 as well as at the end of 2012.
As shown below, the Technology sector remains the biggest in the S&P 500 at 17.72% of the index. The Financial sector ranks second at 16.72%, followed by Health Care (12.97%), Consumer Discretionary (12.18%) and Energy (10.51%). At the bottom of the list is Telecom Services at just 2.58% of the index. Materials and Utilities rank second to last at 3.31%.
The Financial sector has clearly made the biggest move of any sector in recent years. At the end of the financial crisis (start of the current bull), the Financial sector made up just 8.58% of the index. Since then it has nearly doubled its weighting up to 16.72%. This year alone, the Financial sector has added 1.09 percentage points to its weighting.
Health Care and Consumer Discretionary have also seen big jumps in their weightings this year, while the biggest losers have been Technology (-1.23%) and Energy (-0.53%).
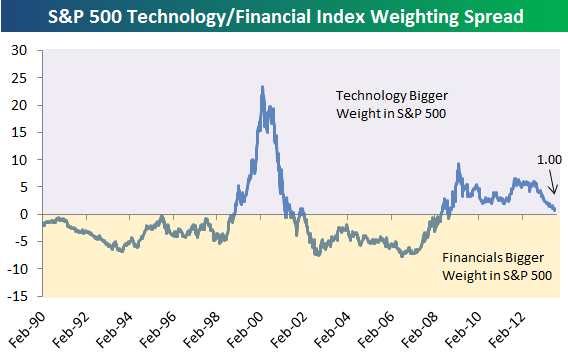
Below is a chart showing the spread between the weightings of the S&P 500 Technology and Financial sectors. When the spread is above 0, the Technology sector has a larger weighting than the Financial sector, and vice versa. As shown, after losing significant ground to Technology during the financial crisis, the Financial sector is just 1 percentage point below the weighting of Tech. If the recent trend continues, it won’t be long before Financials overtakes Technology as the biggest sector of the market once again.
Is this a good thing? The Financial sector exists so that all of the other sectors of the economy can function and grow. When the Financial sector becomes the biggest sector of the economy, it becomes worrisome that the whole system is out of whack. That’s certainly what happened a few years ago, and it didn’t end well!
Below are charts showing the historical S&P 500 weightings for each of the ten sectors. In each chart, the red line represents the sector’s average S&P 500 weighting since 1990. At the moment, Technology, Financials, Health Care, Energy and Consumer Discretionary are above their historical averages, while Consumer Staples, Industrials, Materials, Utilities and Telecom Services are below their historical averages.
After hitting a multi-decade low in early 2009, the Consumer Discretionary sector has just moved back above its long-term average. On the flip side, it’s interesting that the three smallest sectors of the S&P 500 — Utilities, Materials and Telecom Services — are all below their long-term averages. Telecom Services has really faded this year, falling to its lowest weighting since 1990. Maybe it’s time to just combine it with another sector just as they did with the Transportation sector (merged with Industrials back in 2001)!
One of our most highly anticipated reports over at Bespoke Premium is our weekly “Bespoke 50” list of our 50 favorite growth stocks. To make the list of 50, a stock must have strong earnings growth prospects along with an attractive price chart based on Bespoke’s proprietary fundamental and technical analysis.
The Bespoke 50 has done very well since we launched the portfolio in March 2012. As shown below, the Bespoke 50 is up 63.1% since inception versus a gain of 24.8% for the S&P 500 “SPY” ETF. So far in 2013, the Bespoke 50 is up 43% versus a gain of 18.2% for the S&P 500.
“The Bespoke 50” is updated weekly every Thursday. If you’re interested in seeing Bespoke’s 50 favorite growth stocks, sign up for a 5-day free trial to Bespoke Premium today. For a limited time, enter “bespoke50” in the coupon code section of our Subscribe page to receive a 10% discount on your membership!


Newmont Mining has experienced heavy liquidation for the past 20 months since peaking at $72.00 in October 2011. This month we saw the shares trade down to a low of $26.47 for a decline of 63%.
However in the past few days we saw some interesting price action that caught our attention! The shares actually saw some strength and traded above the high set at the beginning of the month. It may still be too early to tell but we could be witnessing a reversal of the downtrend that began last fall if the shares can close above the July 23rd high of $31.41 which would also break out of an intermediate downtrend that began last fall.
When looking at a 20-year chart we see something very interesting! The July low found support at a 13-year trendline going back to the year 2000. At the same time there’s been a pick up in volume as sellers have finally thrown in the towel in disgust and are bailing out after a long period of suffering.
We see a great buying opportunity unfolding in one of the world’s largest gold producers!
The information contained in this report was obtained from sources believed to be reliable, however, we cannot represent that it is accurate or complete. This report is provided as a general source of information and should not be considered personal investment advice or solicitation to buy or sell securities. The views expressed are those of the author and not necessarily those of Raymond James Ltd.
Stocks eked out some gains Tuesday as investors all round the world prepared for a run of economic developments, particularly out of the U.S., that may determine how financial markets perform through the rest of the summer.
Though the U.S. Federal Reserve is not expected to announce any policy changes at the conclusion of its two-day meeting on Wednesday, investors will be monitoring a raft of economic data this week that could well influence expectations of a change in its monetary policy.
….read more http://ow.ly/nsK3Y

-
I know Mike is a very solid investor and respect his opinions very much. So if he says pay attention to this or that - I will.
~ Dale G.
-
I've started managing my own investments so view Michael's site as a one-stop shop from which to get information and perspectives.
~ Dave E.
-
Michael offers easy reading, honest, common sense information that anyone can use in a practical manner.
~ der_al.
-
A sane voice in a scrambled investment world.
~ Ed R.
Inside Edge Pro Contributors

Greg Weldon

Josef Schachter

Tyler Bollhorn

Ryan Irvine

Paul Beattie

Martin Straith

Patrick Ceresna

Mark Leibovit

James Thorne

Victor Adair