
Stocks & Equities
 The Dow continues its rise. Up another 114 points yesterday.
Gold dropped another -$18 an ounce… Mr. Market is working his devious magic… scaring away the Johnny-come-latelies… putting the fear of God into the rest of us.
Hazarding a guess, the price of gold has about another $100 to fall. Then it will probably rebound a bit, as the “strong hands” take advantage of the opportunity.
But the fireworks in the gold market are still, probably, far ahead. You’ll hear the explosions when consumer prices begin to rise. And that won’t happen for a while.
And here is where the story gets interesting… and hard to follow. The bond market has turned. This could push the economy into a deeper funk unless growth starts to pick up. But it could be years before the new trend is firmly established.
We remember the last turn… in the early 1980s. Paul Volcker announced it in 1979. But it was almost four years before investors fully absorbed the news.
In the meantime, there is no pressure on consumer prices… because there is no real recovery. The news media was confused on the subject yesterday. Some sources reported big improvements in consumer confidence, durable goods orders and house prices. Others focused on the downward revision to first-quarter GDP growth.
You can believe anything you want. But on this we are certain: There will be no real recovery.
We are unsure of practically everything. Ask us our phone number…we will hesitate and check twice. Ask us who won World War I… we will have a whole barge-load of equivocations. Ask us which way the stock market is going… we will chuckle.
But ask us about a recovery and we have a ready answer: There will be none.
Why? How can we be so sure?
A recovery needs something solid to recover from. And the period 2003-07 was just the opposite. It was the feverish end to a long ailment that has plagued the US economy since the early 1980s. That was when America’s economy shifted from real growth to phony, debt-driven pseudo growth.
Before then the ratio of total debt to GDP had been about 150% for decades. Americans went about their business – saving… borrowing… spending… creating… producing in a reasonable way. Growth came from where it was supposed to come from – increases in productivity which were shared between workers, lenders, investors and businesses.
Then the confluence of a number of strange things sent debt levels soaring…
America was lucky enough to have the world’s reserve currency in an age of paper money
…the Chinese produced things cheaper than Americans. Wal-Mart pushed prices down further
…the Reagan administration decided that “deficits don’t matter”
…and the financial industry found innovative ways to package and sell on debt.
As a result, total debt-to-GDP levels rose to 300% by the end of the century… and then to 360% by 2007.
This extra debt changed the NATURE of the economy. It was no longer an economy that grew by producing things; henceforth, it was an economy that required larger and larger injections of debt to get high.
In 2007-08 subprime lenders got the shakes and it was over. At least, for them. In a matter of hours, the feds appeared on the scene with stronger drugs. They’ve been trying to relive that glorious “first toke” experience ever since.
And they’re still at it. A headline from today’s Financial Times: “Fed big-hitters seek to quash QE fears.”
What?
Investors are afraid the Fed might stop delivering the drugs. They needn’t worry. Those fears are “out of sync” with Fed thinking said “two senior Federal Reserve officials.”
The drug addiction analogy has been widely used to describe the situation. Like any analogy, it has its limitations and its dangers. But there is one element of it that has been widely ignored.
We spent some time with a psychologist recently. We we’re at a closed-door meeting of members of our family wealth investment advisory, Bonner & Partners Family Office.
There’s as much voodoo in psychology as there is in economics. Still, there are things one trade can learn from the other.
“Drug addicts rarely just decide to recover,” said our friend, a family therapist.
“They have to hit bottom first,” she replied. “And that can be a very long way down.”
The feds are not even trying to help the economy overcome its addiction to cheap credit. Instead, like a sleazy therapist, they want to keep it in expensive and ineffective therapy. Running a rehab clinic can be a good business, especially if the patients never recover. Patients are never allowed to hit bottom. And the quacks keep transferring more and more wealth and power to themselves and their friends.
But like drugs, you can’t increase the dosage forever. An economy that depends on ever-greater hits of credit is an economy destined to blow up.
Then, and only then, can a real “recovery” begin. But it will not be a recovery to the feverish credit bubble of the 2003-07 period. It will be something very different.
Stay tuned…
Regards,
![]()
Bill

 …..Volume & Credit Slumping. In 3 days the Fed has talked the S&P 500 up 4% (amid collapsing volumes)….
…..read more HERE
by Simon Black
‘If one of you stands up right now and heads for the exit, the rest of the audience probably won’t pay much attention. If ten of you do it, one or two people may notice and follow. But if 400 of you suddenly head for the exit, the rest of the audience would probably follow quickly.’
It’s a great metaphor for how our financial system works. The entire system is based on confidence. And as long as most people maintain this confidence, everything is fine.
…..read more HERE
Last week was very disappointing for those who had previously been long precious metals and very profitable for precious metals bears. A lot happened after the FOMC meeting and the Federal Reserve Chairman’s statement on June 19, 2013.
As expected, the confirmation of the Fed’s intention to withdraw from QE3 clearly helped the American dollar. After about three weeks of the currency declines, last week brought the breakout and a start of a rally.
The strengthening of the U.S. dollar was a strong blow not only to the currencies, but also to commodity markets.
After Bernanke’s comments, pessimism transpired to the precious metals markets and we saw some of the biggest swings in this sector.
The sell-off in precious metals pushed gold and silver to lower levels and last week they hit new 2013 lows but haven’t found the bottom quite yet, as it seems. On Friday gold fell below its technical support around $1,285-1,308 per ounce. The decrease in the yellow metal triggered a plunge in silver. The white metal has been beaten in the recent months even worse than gold, and on Friday morning its price accordingly went down to the lowest level since September 2010.
Could these events trigger a more profound correction in mining stocks?
It’s said a picture is worth a thousand words. So let’s take a look at some charts below and try to come up with a thousand words to describe what we see (charts courtesy by http://stockcharts.com ).
(click HERE or on Chart for Larger View)

When you take a look at this chart you can ask a simple question: is the bottom already in? Several weeks ago we mentioned the silver-gold ratio as one of the key things to look at when making the call.
We have previously discussed how the final bottom for the white metal is often preceded by a big underperformance of silver to gold. This is yet to be seen, so lower prices are likely still in the cards for the white metal, and the rest of the sector as well.
There’s been no sharp drop so far, so the bottom is likely still ahead of us. If that’s the case and the entire precious metals sector is about to move lower, how low can mining stocks go?
Let’s take a look at two of the most followed commodity stock indices – the Philadelphia Gold/Silver XAU Index and the AMEX Gold Bugs HUI Index.
The XAU Index is above our initial target (84) for this decline (or at least it was at the moment of creating the above chart). As you know this target level was created from the rising support line based on the late 2000 and 2008 lows.
However, it seems that we could see a move even below that level and a local bottom will probably form slightly above 80. This is the range that likely needs to be reached before the declines in the mining stocks and the precious metals sector come to a close.
This might be a great buying opportunity or – more likely – there beginning thereof.
Now, let’s have a look at the HUI Index. The chart below expresses a simplicity that betrays potential information on where this market may ultimately be heading.
(Click HERE or on Chart for Larger View)

Last week gold mining stocks have continued their decline. Although investors have been selling their shares fear remains in control. However, this may not last much longer. As we mentioned above it seems that miners might move even below the initial target of 84 for the XAU Index.
In this case, it is the HUI Index that enables us to create a better price target.
There is a major support zone drawn on the chart which is a worst case scenario. The red ellipse on the above chart includes both important support levels – the 61.8% Fibonacci retracement level and the 2008 low. There’s one more thing that we didn’t mark on the chart and that is the price gap close to the 300 level (the gap was formed in April). Such a price gap sometimes indicates that at the time when its formed, the market is halfway done rallying or (in this case) declining. Taking this analogy provides us with a target in the marked area as well.
Our final chart today is the gold-stocks-to-gold ratio which is one of the more interesting ratios there are on the precious market.
The above chart provides a very bearish picture. We see that the decline continues and that the ratio is quite far from its target – the 2000 low.
Please note that the trading channel and the next horizontal support intersect at a point much lower than where this ratio is today.
As we wrote over a month ago in our Premium Update on May 17, 2013:
The ratio has already broken below the previous late 2008 major low (…). This is a major breakdown and it was confirmed. The implication is that the trend is still down.
With the trend being down and accelerating and the recent breakdown being confirmed, there is a good possibility that the miners will decline significantly once again.
The ratio might move to its target level – the 2000 low – close to the 0.135 level, which is a quite clear forecast as far as direction of the next move is concerned.
Summing up, the outlook for mining stocks remains bearish and the correction is likely still not over. There may be many obvious, and not so obvious reasons for this recent underperformance of the precious metals sector, but the charts are quite clear. In our view it does not seem that the final bottom for mining stocks is already in at least not based on last week’s closing prices.
Thank you for reading. Have a great and profitable week!
Przemyslaw Radomski, CFA
Founder, Editor-in-chief
Gold Investment & Silver Investment Website – SunshineProfits.com
* * * * *
Disclaimer
All essays, research and information found above represent analyses and opinions of Przemyslaw Radomski, CFA and Sunshine Profits’ associates only. As such, it may prove wrong and be a subject to change without notice. Opinions and analyses were based on data available to authors of respective essays at the time of writing. Although the information provided above is based on careful research and sources that are believed to be accurate, Przemyslaw Radomski, CFA and his associates do not guarantee the accuracy or thoroughness of the data or information reported. The opinions published above are neither an offer nor a recommendation to purchase or sell any securities. Mr. Radomski is not a Registered Securities Advisor. By reading Przemyslaw Radomski’s, CFA reports you fully agree that he will not be held responsible or liable for any decisions you make regarding any information provided in these reports. Investing, trading and speculation in any financial markets may involve high risk of loss. Przemyslaw Radomski, CFA, Sunshine Profits’ employees and affiliates as well as members of their families may have a short or long position in any securities, including those mentioned in any of the reports or essays, and may make additional purchases and/or sales of those securities without notice.

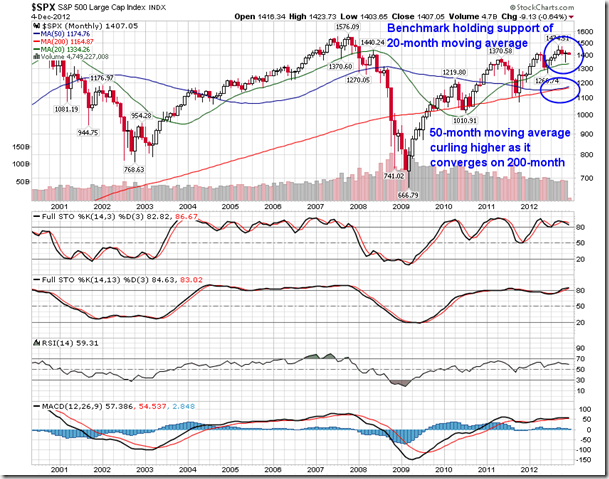
Anybody notice the massive head-and-shoulders topping pattern on the TSX Composite? It has been obvious that the Canadian benchmark charted a triple top at 12,900, a peak reached in January, March, and May. It could also be argued that a head-and-shoulders pattern is potentially in play as well, a bearish setup that would push the benchmark further into negative territory on the year. A break of the neckline, presently around 12,000, could target 10,900, or over 9% lower than present levels. Until the technicals improve, equity markets are within a negative trend, defined by a series of lower-lows and lower-highs. Beware of the seasonal volatility ahead as we progress later into the summer.
The equity market selloff continued on Monday as investors remained concerned by the looming Fed tapering of present monetary stimulus. The S&P 500 declined by around 2% at the session low, but trimmed the losses into the close as investors sought to buy the dip. The trend for the market remains negative and the technical sell signals are accumulating.
…….read more HERE
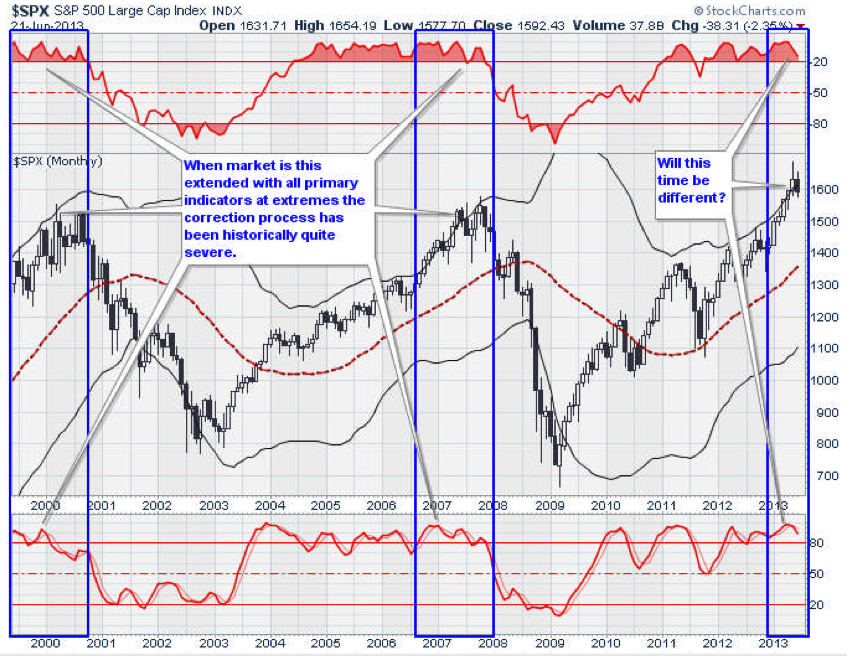
After eight straight months of advance in the markets what the media absolutely believed could not happen finally has – the market quit going up. However, you can’t really blame the media for believing in an “unstoppable” rally, after all, like a “Bigfoot” sighting, they clearly saw evidence of an urban legend.
However, as we have been discussing for many weeks, such market advances that push prices to extreme divergences from their historic norms are ultimately due for a correction. Without such corrections the markets become distorted, unhealthy and subject to severe crashes.
This week we will review our analysis from last week, set targets for the current correction and discuss recommended actions for portfolios currently.
However, before we jump into the analysis I want to give you a few updates to the coming changes to the newsletter and website.
“Streettalklive.com” is merging into “STAWealth.com.” Only the look is changing – all the great features will remain the same.
This weekly newsletter will actually become three different HTML documents that you will be able to print, read on your tablet and phone, share with friends post to your social network. The three pieces will be:
– Portfolio Management: Market analysis & Investing Strategy
– Market/Sector Analysis: Analysis of 15 major sectors /markets
– 401k Plan Manager: Expanded and improved model/analysis
Also, more frequent postings to the daily blog that are short reads, quick analysis or video/audio analysis of investing ideas, economics, strategies or tips.
As we get closer to the rollout of the new site I will keep you informed of all of the changes. I hope you will find the new website to be more useful and informative in the management of your financial future.
……read the 17 page report HERE

-
I know Mike is a very solid investor and respect his opinions very much. So if he says pay attention to this or that - I will.
~ Dale G.
-
I've started managing my own investments so view Michael's site as a one-stop shop from which to get information and perspectives.
~ Dave E.
-
Michael offers easy reading, honest, common sense information that anyone can use in a practical manner.
~ der_al.
-
A sane voice in a scrambled investment world.
~ Ed R.
Inside Edge Pro Contributors

Greg Weldon

Josef Schachter

Tyler Bollhorn

Ryan Irvine

Paul Beattie

Martin Straith

Patrick Ceresna

Mark Leibovit

James Thorne

Victor Adair