
Stocks & Equities
Precious metals and their related mining stocks continue to underperform the broad market. This year’s heavy volume breakdown below key support has many investors and trader’s spooked creating to a steady stream of selling pressure for gold and silver bullion and mining stocks.
While the technical charts are telling me prices are trying to bottom we must be willing to wait for price to provide low risk entry points before getting involved. Precious metals are like any other investment in respect to trading and investing in them. There are times when you should be long, times to be in cash and times to be short (benefit from falling prices). Right now and for the last twelve months when looking at precious metals cash has been king.
Since 2011 when gold and silver started to correct the best position has been to move to cash or to sell/write options until the next trend resumes. This is something I have been doing with my trading partner who focuses solely on Options Trading who closed three winning positions last week for big gains.
In 2008 we had a similar breakdown in price washing the market clean of investors who were long precious metals. If you compare the last two breakdowns they look very similar. If price holds true then we will see higher prices unfold at the end of 2013.
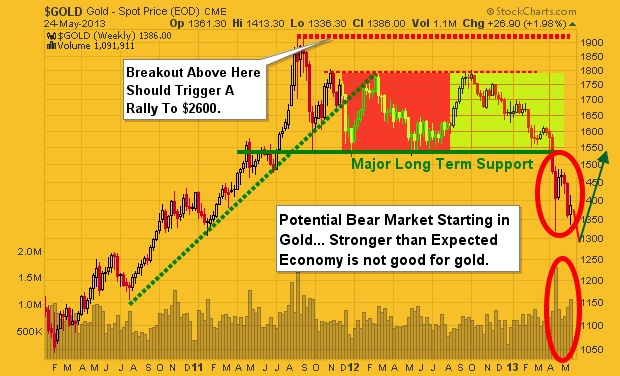
The key here is for the price to move and hold above the major resistance line. A breakout would trigger a rally in gold to $2600 – $3500 per ounce. With that being said gold and silver may be starting a bear market. Depending what the price does when the major resistance zone is touched, my outlook may change from bullish to bearish. Remember, no one can predict the market with 100% accuracy and each day, week and month that passes changes the outlook going forward.
The chart below is on I drew up on May 3rd. I was going to get a fresh chart and put my analysis on it but to be honest my price forecast/analysis has been spot on thus far and there is no need to update.
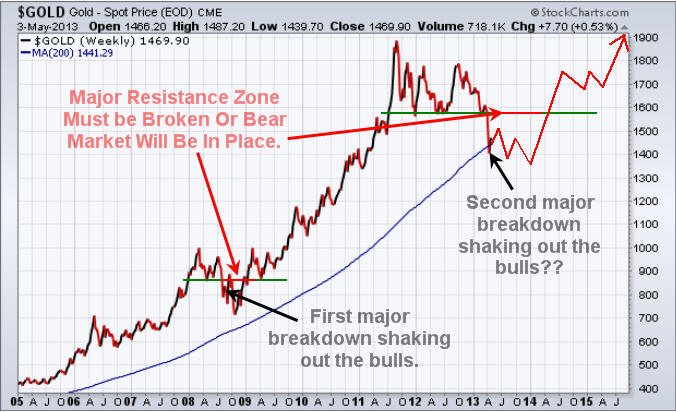
GOLD DAILY TECHNICAL CHART SHOWING BOTTOMING PROCESS:
Major technical damage has been done to the chart of gold. Gold is trying to put in a bottom but still needs more time. I feel gold will make a new low in the coming month then bottom as drawn on the chart below.
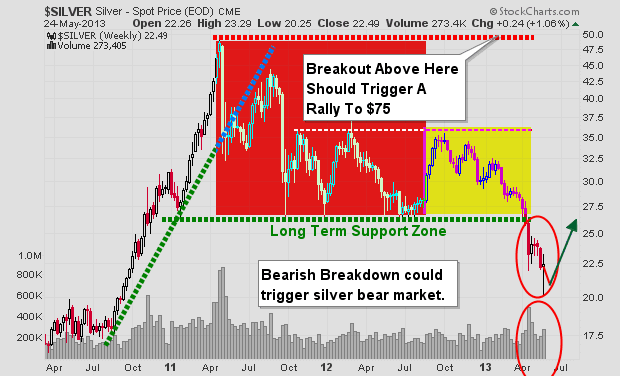
SILVER DAILY TECHNICAL CHART SHOWING BOTTOMING PROCESS:
Silver is in a similar as gold. The major difference between gold and silver is that silver dropped 10% early one morning this month which had very light volume. The fact that silver hit my $20 per ounce level and it was on light volume has me thinking silver has now bottomed.
But, silver may flounder at these prices or near the recent lows until its big sister (gold) puts in a bottom.
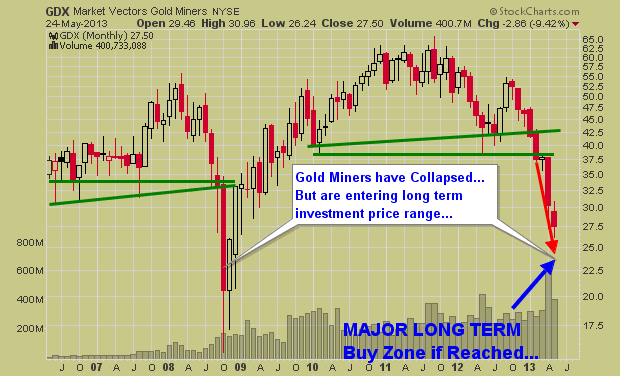
GOLD MINING STOCKS MONTHLY INVESTING ZONE CHART:
Gold mining stocks broke down a couple months ago and continue to sell off on strong volume. If precious metals continue to move lower then mining stocks will continue their journey lower.
This updated chart which I originally drew in February warning of a breakdown below the green support trend lines would signal a collapse in stock prices, which is exactly what has/is taking place. While I do not try to pick bottoms (catch falling knives) I do like to watch for them so I am prepared for new positions when the time and chart turn bullish or provide a low risk probing entry point.
While I focus more on analysis, forecasts and ETF trading another one of my trading partners who focuses on Trading Stocks and 3x Leveraged ETF’s has been cleaning up with gold miners.
GOLD, SILVER AND MINING STOCKS CONCLUSION:
Precious metals continue to be trending down and while they look to be trying to bottom it is important to remember that some of the biggest percent moves take place in the last 10% of a trend. So we may be close to a bottom on the time scale but there could be sharply lower prices yet.
The time will come when another major signal forms and when it does we will be getting involved. The exciting this is that it could be just around the corner. So if you want to keep current and take advantage of the next major moves in the market be sure to join our newsletters.
Join My Newsletter Memorial Day Special 50% Discount:
http://www.thegoldandoilguy.com/signup.php
Chris Vermeulen


 The Fed is freaking out…
- We’ve got another bubble on our hands.
- And this time they’re tapped out.
- More!
Having pumped the system with liquidity non-stop since the Crash of 2008, the Fed now realizes it’s in big trouble and needs to manage down expectations of further stimulus.
As we noted earlier this year, the Fed, while attempting to appear committed to endless money printing via its QE 3 and QE 4 programs, was in fact decidedly split on whether to commit to more as well as the risks inherent to additional QE. Indeed, the Fed FOMC minutes indicate that some Fed members were concerned about whether QE even worked as a monetary policy.
Below are the notes from the Fed’s December 2012 FOMC minutes (the meeting during which the Fed announced QE 4). I’ve added highlights to emphasize the shift in tone.
With regard to the possible costs and risks of purchases, a number of participants expressed the concern that additional purchases could complicate the Committee’s efforts to eventually withdraw monetary policy accommodation, for example, by potentially causing inflation expectations to rise or by impairing the future implementation of monetary policy.
Participants also discussed the implications of continued asset purchases for the size of the Federal Reserve’s balance sheet. Depending on the path for the balance sheet and interest rates, the Federal Reserve’s net income and its remittances to the Treasury could be significantly affected during the period of policy normalization.
Participants noted that the Committee would need to continue to assess whether large purchases were having adverse effects on market functioning and financial stability. They expressed a range of views on the appropriate pace of purchases, both now and as the outlook evolved. It was agreed that both the efficacy and the costs would need to be carefully monitored and taken into account in determining the size, pace, and composition of asset purchases.
http://www.federalreserve.gov/monetarypolicy/fomcminutes20121212.htm
There are three key implications here:
1) The Fed acknowledged that QE causes inflation expectations to rise(red text)
2) The Fed was divided on the efficacy of QE (green text)
3) The Fed was not committed to employing QE forever despite its public declarations to that effect (blue text)
This shift in tone went largely unnoticed by the media. However, the implications are very serious. By way of explanation, let’s quickly review the Fed’s primary moves in the post-Crisis era.
In 2008 the Fed had its back against the wall in terms of saving the system. Since that time every new Fed intervention (verbal or monetary) has been aimed at propping up the Too Big To Fail Banks and pushing the stock market higher.
The first wave of this came via QE 1 and QE 2 in which the Fed collectively monetized nearly $2 trillion in assets. However, once QE 2 ended in 2011, we noted the Fed began to realize that it could get the “positive” effects of additional stimulus (higher asset prices) without actually having to engage in more stimulus, simply by issuing verbal interventions at critical moments.
Thus, between QE 2’s end (June 2011) and the start of QE 3 (September 2012), the Fed became increasingly reliant on verbal intervention as opposed to actual money printing.
During this period, any time the markets began to dip, a Fed official, usually an uber-Dove such as NY Fed President Bill Dudley or Chicago Fed President Charles Evans, would indicate that the Fed was ready to act aggressively if need be and VOOM the markets would take off again.
This changed in May 2012, when the entire financial system began to implode courtesy of Spain (see our issue The “C” Word for an explanation of this). At that time the Fed switched back into aggressive monetary policy mode, first promising to provide more QE before launching QE 3 in September 2012 and then QE 4 in December 2012.
Unlike previous QE programs, which had definitive timelines, QE 3 and QE 4 were open-ended, meaning that they can continue forever. This was the Great Global Rig we referred to earlier this year. And while it did push the stock market higher, it did next to nothing for the US economy.
Which brings us to today. The US economy is contracting sharply again (without the massaged data inflation, real GDP growth would have been -1% last quarter) right as stocks close in on new all-time highs (the S&P 500 and Dow) or have already broken to new highs (the Russell 2000).
This is happening at a time when earnings are falling (despite companies booking profits), the economy is slowing, and stocks are closing in on all-time highs.
In plain terms, the stock market has become totally detached from economic realities. There is a term for when asset prices become detached from fundamentals, it’s called “A BUBBLE.”
THIS is the reason the Fed is beginning to shift its tone. It realizes it has blown another bubble and that we’re likely headed for another Crash. And this time around the Fed will be totally out of ammo to stop it. Unlike 2008 which was just a warm-up, this will be the REAL CRISIS featuring full-scale systemic failure.
So if you have not already taken steps to prepare for systemic failure, you NEED to do so NOW. We’re literally at most a few months, and very likely just a few weeks from the economy taking a massive downturn, potentially taking down the financial system with them. Think I’m joking? The Fed is pumping hundreds of BILLIONS of dollars into financial system right nowtrying to stop this from happening.
Ed Note: The author of this article is Private Wealth Advisory which asserts that it made the following gains listed below and that you can join this service… RISK FREE… for 30 days!
In 2011, the S&P 500 closed the year with a stagnant 0% return. But we did much better, closing the year with a solid 9% gain.
In 2008, the S&P 500 handed investors a devastating 36% loss. While we banked a 7% gain– crushing the index by a whopping 43%.
2011 to July of 2012 , we recorded 74 consecutive winning trades and ZERO losers producing an incredible 34% return.
![]()
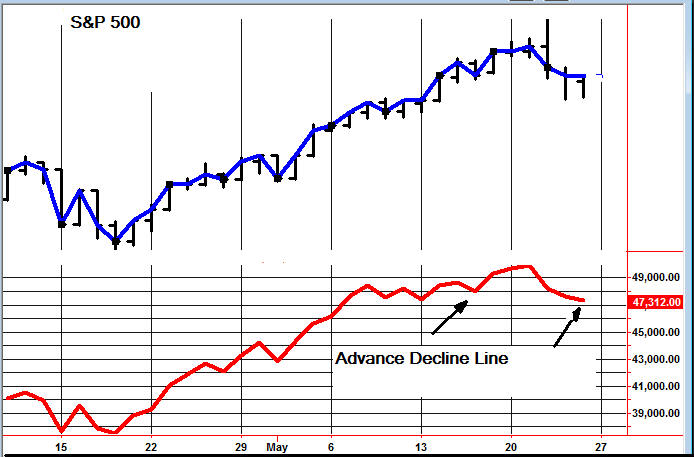
DOW +9 on 350 net decline
NASDAQ COMP – 1 on 100 net advances
SHORT TERM TREND Bearish (change)
INTERMEDIATE TERM TREND Bullish
SHORT TERM TREND Bearish (change)
INTERMEDIATE TERM TREND Bullish
DOW +9 on 350 net declines
NASDAQ COMP – 1 on 100 net advances
STOCKS: The stock market seems to be increasingly of the opinion that the Fed is going to taper off with its money printing. At least that’s the opinion of the media talking heads over the past few days.
I don’t see it that way. Bernanke has already said that he is going to continue debasing the currency as long as the unemployment rate remains above 6.5%. I think what we may be getting is simply profit taking on a market that has had a solid run.
GOLD: Gold was down $9, but it’s making a pattern of rising tops and rising bottoms which is a positive.
CHART: The S&P 500 has been much lower in the early going, but buyers have continued to come in. However, this time they haven’t been able to push it into positive territory by the close. Also, the advance decline line is now making a clear break of the previous low (arrows). This puts us into the short term bearish camp.
RANKED # 1 BY TIMER DIGEST
Timer Digest of Greenwich, CT monitors and ranks over 100 of the nation’s best known stock market advisory services.
Once per year in January, Timer Digest publishes the rankings of all services monitored for multiple time frames.
For the years 2003, 2004 and 2005, The Todd Market Forecast was rated # 1 for the preceding ten years. For the year 2006, we slipped to # 3 and in 2007, we were ranked # 5.
Our bond timing was rated # 1 for the years 1997, 2007 and 2008.
Gold timing was rated # 1 for 1997 and # 2 for 2006. Late word! We were rated # 1 for 2011.
We were # 1 in long term stock market timing for the years 1998 and 2004 and # 4 in 2010.
To subscribe go to Contact Us.

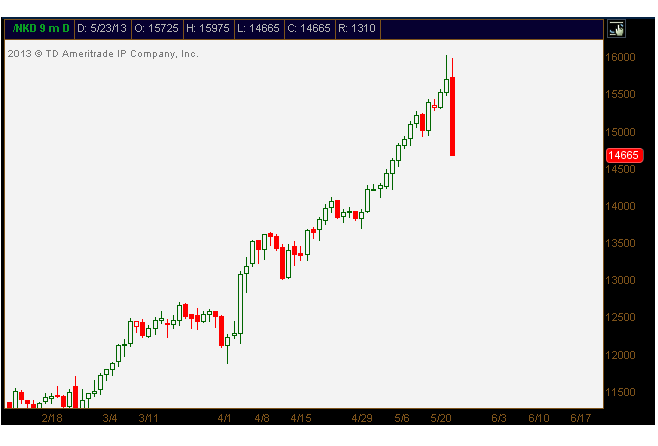
![]() U.S. stock indices ended down for the week as concerns over Chinese manufacturing data and a possible end to QE3 startled investors. The S&P500, which is up over 15% since the start of the year, posted its first weekly loss since mid-April. China’s manufacturing PMI fell to 49.6 from 50.4 in April, missing the consensus estimate of 50.5. Officials in China blamed the lower consensus numbers on weak global demand and declining domestic consumption. The poor performance from the world’s second largest economy continues to weigh on commodities and commodity investors as China has been a leading force behind strong energy and metals demand over the past decade. The effects of the weak data from China were felt abruptly in Asia, and particularity in Japan, where the Nikkei index which fell 7.3% on Thursday, its largest one day decline in 2 years.
U.S. stock indices ended down for the week as concerns over Chinese manufacturing data and a possible end to QE3 startled investors. The S&P500, which is up over 15% since the start of the year, posted its first weekly loss since mid-April. China’s manufacturing PMI fell to 49.6 from 50.4 in April, missing the consensus estimate of 50.5. Officials in China blamed the lower consensus numbers on weak global demand and declining domestic consumption. The poor performance from the world’s second largest economy continues to weigh on commodities and commodity investors as China has been a leading force behind strong energy and metals demand over the past decade. The effects of the weak data from China were felt abruptly in Asia, and particularity in Japan, where the Nikkei index which fell 7.3% on Thursday, its largest one day decline in 2 years.
Also weighing on investor’s minds were recent comments from the U.S. Federal Reserve Chairman, Ben Bernanke, who told congressmen this week that the American economy had improved relative to a year ago. One would expect that a long awaited recovery in the U.S. economy would be a boost to capital markets but many investors feel that the Federal Reserve may look to end their aggressive monetary stimulus, otherwise known as QE3, in the wake of better economic performance. We would strongly disagree with proponents of the idea that Bernanke would want pull his foot off the monetary stimulus pedal so quickly after only modest signs of improvement in the U.S. economy. It appears to be the U.S. government’s plan to continue to encourage a stronger export market in order to drive more jobs back into the American manufacturing engine. A quick end to monetary stimulus would mean a rather quick increase in long-term interest rates and in the U.S. dollar exchange rate which would put the brakes on U.S. export growth.
In spite of the jitters felt throughout the rest of the world, Toronto’s main index held firm trading roughly flat and ending the week at 12,667 points. Canada’s resource sectors remain largely under pressure with stocks in mining and oil & gas continuing to languish. Although overall the TSX index continues to produce lackluster returns and TSX Venture is outright bankrupting investors, KeyStone has continued to discover and recommend individual stocks which are producing outstanding investment returns in a challenging market. Lots more HERE & Below
KeyStone’s Latest Reports Section
In March, KeyStone recommended a profitable small-cap company that is benefiting substantially from the resource development taking place in Northern British Columbia and with no direct exposure to commodity prices. This stock has already generated our clients a return of almost 50% in only 2 months and we just reiterated our BUY recommendation this week after they released outstanding Q1 financial results. Not only does this stock trade at around 4 times earnings, but it remains well positioned to continue to benefit and grow from the resource and infrastructure development expected to occur in Northern BC over the next 5 years.
To find out more about this exciting company and several others, go to our website (www.keystocks.com) and become a client of KeyStone’s small-cap and dividend growth stock research.
The Nikkei plunged a whopping 1,143 points as the chart shows;
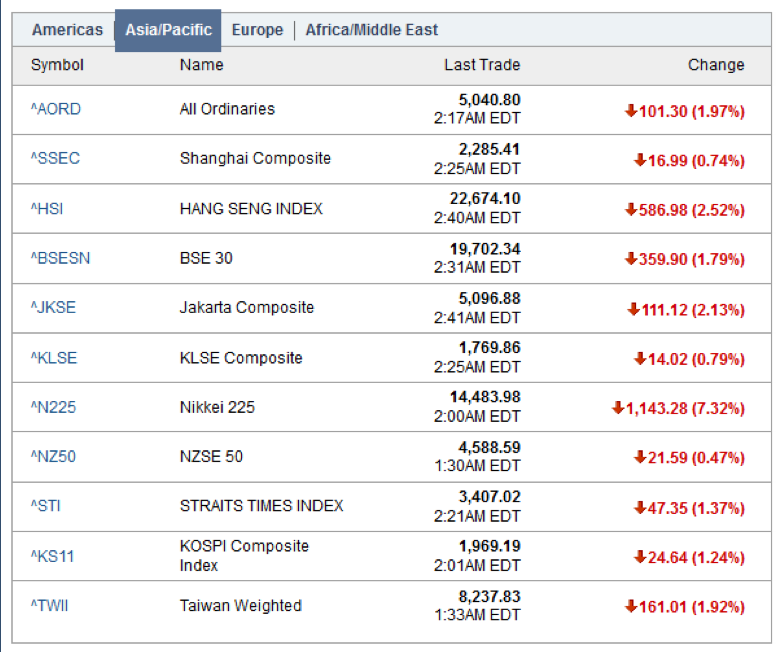
 Global Equities Hammered
It’s not just the Nikkei that’s being hammered. Asia-Pacific is in a rout as well.
Start of Reflation Bubble Bust?
Is this the start of the great reflation unwind? I don’t know, but we should all hope so.
The bigger the bubble the bigger the crash, and this Fed (central bank in general) sponsored equity and corporate bond bubble is enormous.
Ed Note: The critical point Martin Armstrong’s makes on a Flash Crash like the one described above is to focus on the crashes aftermath to determine its validity:
“The validity of any Flash Crash is determined by the aftermath. You simply cannot manipulate any market defined as changing the trend. So any attempt to impact prices is a short-term manipulation is short-lived. Take the May 6, 2010 Flash Crash in the US share market also known as The Crash of 2:45. The US stock market crash came on Thursday May 6, 2010 in which the Dow Jones Industrial Average plunged about 1000 points (about 9%). Regardless if it was an error or a deliberate attempt to push the market down, it takes place because there is a lack of bid. However, if the move is false, the the market will rapidly recover those losses within minutes or a couple of days. In that case, it was the second largest point swing in history, 1,010.14 points, and the biggest one-day point decline, 998.5 points, on an intraday basis in Dow Jones Industrial Average history. It is the LACK OF BIDS in the market that allows that downdraft to take place. Everyone made excuses from sticky fingers to it wasn’t real. The market failed to generate any sustainable rally. It rebounded rapidly closing at 10520.32 that day, but the next day it closed lower 10380.43. The market then rallied ONLY for 3 days (3 day reaction rule) reaching the highest closing at 10896.91 failing to even close above the high of the day of the crash 10925.86. The 3 day reaction rule worked and the market fell to new lows bottoming at .9596.04 on July 1, 2010The market is NEVER wrong. It does not matter if it was thin or robust trading. All the excuses in the world are still excuses. It is what it is. The Dow elected a Daily Bearish 04/27 1 day after the high. The trend was headed lower.
During a Flash Crash, (1) there is a lack of bids underlying the market, and (2) typically what happens is market-makers withdraw out of UNCERTAINTY. The very day of the low in the 1987 Crash, I looked at the screen and saw a 240 call option was $300 in the S&P when it fell to 180. I picked up the phone and tried to buy. The market-makers withdrew. ONLY my experienced saved me. I would have said buy at the market. I hesitated and put in a limit order. The next trade was 3000. With no market makers I would have been filled on that limit offer.

It is what it is. Excuses are simply the way to say you were not wrong, it was fake. But the truth is always revealed by the price. It is what it is.” – Martin Armstrong
Martin Armstrong’s perspective fascinated so many at last night’s Emergency Gold Summit, as you can tell from this email sent to Martin:
Thank you. Your insight into how everything is connected has saved me a fortune. I cannot tell you how many people showed up tonight simply to hear you. As the moderator said, you have the best track record of anyone. Your insight into the world is amazing. I understand what you said tonight as so many were talking about your speech walking out. It will be the markets that force political change. You have thousands of followers here in Vancouver. You should know that.
Thanks for everything you are doing.
R…S,,,
The entire Emergency Gold Summit Video presentation in which David Bensimon, Mark Leibovit and Martin Armstrong’s presentation and specifics about how everything is connected can be found HERE

-
I know Mike is a very solid investor and respect his opinions very much. So if he says pay attention to this or that - I will.
~ Dale G.
-
I've started managing my own investments so view Michael's site as a one-stop shop from which to get information and perspectives.
~ Dave E.
-
Michael offers easy reading, honest, common sense information that anyone can use in a practical manner.
~ der_al.
-
A sane voice in a scrambled investment world.
~ Ed R.
Inside Edge Pro Contributors

Greg Weldon

Josef Schachter

Tyler Bollhorn

Ryan Irvine

Paul Beattie

Martin Straith

Patrick Ceresna

Mark Leibovit

James Thorne

Victor Adair