
Stocks & Equities
^ +1,797.00 +1.10% May 3rd 2013

Transcript Below:
Becky – CNBC: I know that you’re not somebody who looks at the market averages on a daily basis or cares about any of these things. But when you start seeing the trend that we’ve been seeing, which is almost a straight march up, it seems like we’re hitting new highs almost every day and that’s the type of thing that catches main street’s attention. You’ve got a lot of individual investors who are sitting around wondering if they’ve missed everything. If they should get back in, if it’s too late, if they’ve missed the train.
What would you tell those people who are sitting at home wondering what the Oracle of Omaha is thinking about?
Warren Buffet: Well, they should pay more attention to the milestones on the down side. That’s when the Stocks are getting cheaper. That’s when Stocks are going onsale, but people do get excited when Stocks go to new highs. I can remember it was a big event when the dow crossed 100! I surely remember well when it hit 1,000, that was a magic number. Probably in my lifetime and certainly in your lifetime you will see markets go far higher than this. I mean the retention of earnings by American industry, the growth of the country will cause stocks to go higher over time.
We’re not getting everything out of stocks in terms of the dividends they pay compared to the earnings retention that is building up. It’s exactly like if you have a savings account ,and you only took out part of your interest earned, your savings account would grow.
So I don’t get too concerned about a given the level. You will see numbers a lot higher than this in your lifetime.
Warren Buffett Tries to Explain ‘Colorful Charlie’
In a CNBC.com-only interview after a marathon question-and-answer session with shareholders, Becky Quick asks Warren Buffett to comment on some of Charlie Munger’s best lines.

For a couple of years now I’ve maintained my view that the Dow Industrials and broad U.S. equity markets were entering a new bull market. One of the tools I used to come to that conclusion back in 2008 was the ratio of the Dow Industrials to the price of gold.
I wrote extensively about it in my July 2008 issue of Real Wealth Report. I also reported on it several times in other pieces I wrote. Today, I want to update the analysis for you.
First some background. At the peak of the ratio in the year 2000, the Dow Industrials would have purchased just over 51 ounces of gold. That’s because the Dow was at a high in real, inflation-adjusted terms, while gold was at its bottom at the $255 to $275 level.
During the financial crisis of 2007 – 2009, as equities plunged and gold rallied (since its bottom in 2000) the ratio collapsed all the way down to the 6 to 7 level.
In other words, in terms of gold — what I like to call “honest money” — the Dow Industrials had lost more than 87 percent of the entire equity bull market from 1980 to 1999.

In my Real Wealth Report issue of July 2008, I called for the bottom in the ratio to come in around the 5 to 6 level.
It bottomed slightly above that level, then retested it with a slightly lower low in September 2011.
Since then, stocks have vastly outperformed gold.
As a result, the ratio of the Dow Industrials to gold has widened back out, and has broken out of a resistance level as you can see on the chart.
Now trading at about the 10-to-1 level, the Dow/Gold ratio is set to widen much further.
So what does this all mean? And what does it hold for the future for the Dow? For gold?
I’ll answer those questions now. But I urge you to put your thinking cap on, because the analysis of the Dow/Gold ratio is not easy to grasp, yet it’s critically important to understanding the future.
FIRST, the collapse in the Dow to Gold ratio was not caused simply by a crash in equity prices. It was also due to a crash in the value of the dollar, as reflected in the soaring value of gold from the year 2000 on.
SECOND, the breakout in the ratio means that the Dow is now beginning to inflation-adjust, to reflect the lower value of the dollar (as reflected in the higher price of gold).
This inflation-adjusting of equities is perfectly normal and one of the main reasons I am very bullish equities over the next several years.
All asset classes eventually recalibrate their price levels to the new reality of the purchasing power of the underlying currency, which in this case, is the dollar, which in turn, is nowhere near what it was worth back in the year 2000.
A simple exercise here will show you how the Dow will adjust. For the Dow/Gold ratio to climb back to the 18 to 20 resistance level you see on my chart, the Dow would have to explode higher to the 28,000 level, assuming gold’s current price of roughly $1,400.
 Naturally, the price of gold is not going to remain at $1,400. It will probably fall back to the $1,030 level, which is my target for gold’s bottom. Let’s say it does that. Then a 20-to-1 ratio for Dow/Gold, with gold at $1,030, would still imply a Dow eventually hitting the 20,600 level.
And what would happen if gold were to move to $2,000 … $3,000 … or higher? Then to reach a 20-to-1 ratio, the Dow would have to explode even higher.
At $2,000 gold, a 20:1 ratio would see the Dow eventually hit 40,000.
Take the other extreme: Gold falls to say, $600. A 20:1 ratio puts the Dow at 12,000.
Do this exercise for any price level of gold you wish, and you will see that the downside risk in the Dow is minimal and the upside potential is enormous.
That’s not to say there won’t be pullbacks in the Dow. There will be. This kind of analysis simply shows you that …
THIRD, the monetary system has changed dramatically. More specifically, the dollar has lost another huge chunk of purchasing power ? value that it will most likely never get back, even if the dollar stages a rally in the Forex markets, as it has been doing and will do some more.
Naturally, the ratio between the Dow and gold will vary considerably over the next few years.
But given the breakout from the bottom of the ratio … and the normal tendency from all markets, no matter what they are, to retrace good portions of what they have lost …
I believe it’s a very safe assumption to make that the Dow/Gold ratio will continue to climb. And that means much higher prices to come for the Dow, and U.S. equity markets in general.
You can do this sort of exercise with any asset class you want. You can look at real estate values in terms of honest money, gold … even with collectibles such as art.
And each time you do that comparison, with the price of gold, you will find that the value of the dollar has changed dramatically over the last 12 years, so much so that almost all asset prices will eventually be forced to inflate much higher.
As for gold and silver right now, the bounce you’ve seen is nothing more than a dead cat bounce. The precious metals, and commodities in general, have NOT bottomed.
So please don’t buy yet, and don’t fall prey to the pitches from all the snake-oil salesmen out there who are trying so desperately to sell you metal and mining shares now so they can earn an extra commission.
I repeat my warnings:
Gold will not bottom until it hits major long-term support at $1,030.
Silver will not bottom until it tests major long-term support at the $17 level.
If you’ve acted on any of my suggestions to purchase inverse ETFs such as theProShares UltraShort Gold (GLL) and the Direxion Daily Gold Miners Bear 3x Shares (DUST) … or even the ProShares UltraShort Silver (ZSL) for a play on silver’s downside …
Continue to hold those positions!
Best wishes,
Larry

“As in life, nothing in the markets seems to change in a hurry. But when an item finally changes, it tends to make up for lost time … What do they call it when you don’t trust anything? Oh yeah, they call it “Life in the markets under Ben Bernanke.” Will Ben continue to buy one trillion worth of bonds and assorted vehicles through the end of the year?
… Now the whole daffy world is following Bernanke’s lead. Japan has had it with two decades of deflation, and Japan’s new central bank head vows to double Japan’s monetary base within two years — or, at least buy bonds until deflation in the Land of the Rising Sun turns to inflation of at least 2%. In the meantime, Japanese stocks are surging under Japan’s new super brand of QE.
I have to wonder how long US stocks can continue to climb on the basis of quantitative easing? I don’t know, and I don’t think anybody else knows either. The strategy now seems to be — you buy blue chip US stocks or the DIAs and stay with them until the market turns sloppy — or until it actually turns down. Forget values, forget sentiment, forget risk, forget the charts, forget caution — stay with blue chip dividend-paying stocks for as long as they continue to climb, and when they halt their climb, give ’em back to Wall Street and await further developments.
But what about the “depression” that Nobel Prize winner Paul Krugman insists we’re now in? The hell with the depression, the stock market is going up, and maybe when it turns down we’ll have his depression. Until then, “What, me worry?” No chance, I’ve got my gold. And if the end of the world arrives, I’m betting gold will be my savior (that is, if Uncle Sam doesn’t take it away from me at gun-point).
Most professionals and fund managers are worried about a hurricane of inflation showing up somewhere in the not-too-distant future. After all, inflation is always a monetary phenomenon, and God knows we’ve had our turn at money creation. In fact, there’s never been anything like the current worldwide explosion of currency creation.
Then what’s stopping inflation? It’s the over-supply of commodities that’s been pouring into the West out of Asia. Too much copper, too much tin, too much zinc, too much in the way of merchandise, too much of almost everything. It’s a world avalanche of “too much,” and not enough demand. But central banks come to the rescue. They’ll print us out of deflation. And somewhere ahead, worry the money managers, the whole thing will catch fire, and we’ll end up with a sudden tidal wave of inflation. If so, then why isn’t gold at new highs? Patience, the markets always do what they’re supposed to — but never when.
The Fed is buying a trillion dollars worth of Treasuries and mortgage-backed securities so they’d drive the yield on 10-year Treasuries down to a ridiculous 1.67%. So where does the money go? Into blue chip stocks that are now the new safe havens. In the meantime, the US dollar gets whacked. Below we see the US dollar down heavily today and closing below its 50-day MA. Note that MACD is just turning down. (Ed Note: the next day’s rise in the USD was sharp, rising nearly 2/3 of a penny or .61)

But the S&P is at a new record high, and the TREND of the stock market is up, so I’m staying with the DIAs until I receive the first bearish signals … Summing up, the Bernanke Fed has succeeded in driving everybody into the stock market or back into real estate … It’s great to make money in the stock market, and your only worry is when the Federal Reserve’s punch bowl crashes … I still like gold, and as far as I’m concerned, it’s the only real safe haven.”
To subscribe to Richard Russell’s Dow Theory Letters CLICK HERE.
Useful articles:
“Rich Man, Poor Man (The Power of Compounding)“
Russell began publishing Dow Theory Letters in 1958, and he has been writing the Letters ever since (never once having skipped a Letter). Dow Theory Letters is the oldest service continuously written by one person in the business.
Russell gained wide recognition via a series of over 30 Dow Theory and technical articles that he wrote for Barron’s during the late-’50s through the ’90s. Through Barron’s and via word of mouth, he gained a wide following. Russell was the first (in 1960) to recommend gold stocks. He called the top of the 1949-’66 bull market. And almost to the day he called the bottom of the great 1972-’74 bear market, and the beginning of the great bull market which started in December 1974.
The Letters, published every three weeks, cover the US stock market, foreign markets, bonds, precious metals, commodities, economics –plus Russell’s widely-followed comments and observations and stock market philosophy.
In 1989 Russell took over Julian Snyder’s well-known advisory service, “International Moneyline”, a service which Mr. Synder ran from Switzerland. Then, in 1998 Russell took over the Zweig Forecast from famed market analyst, Martin Zweig. Russell has written articles and been quoted in such publications as Bloomberg magazine, Barron’s, Time, Newsweek, Money Magazine, the Wall Street Journal, the New York Times, Reuters, and others. Subscribers to Dow Theory Letters number over 12,000, hailing from all 50 states and dozens of overseas counties.
A native New Yorker (born in 1924) Russell has lived through depressions and booms, through good times and bad, through war and peace. He was educated at Rutgers and received his BA at NYU. Russell flew as a combat bombardier on B-25 Mitchell Bombers with the 12th Air Force during World War II.
One of the favorite features of the Letter is Russell’s daily Primary Trend Index (PTI), which is a proprietary index which has been included in the Letters since 1971. The PTI has been an amazingly accurate and useful guide to the trend of the market, and it often actually differs with Russell’s opinions. But Russell always defers to his PTI. Says Russell, “The PTI is a lot smarter than I am. It’s a great ego-deflator, as far as I’m concerned, and I’ve learned never to fight it.”
Letters are published and mailed every three weeks. We offer a TRIAL (two consecutive up-to-date issues) for $1.00 (same price that was originally charged in 1958). Trials, please one time only. Mail your $1.00 check to: Dow Theory Letters, PO Box 1759, La Jolla, CA 92038 (annual cost of a subscription is $300, tax deductible if ordered through your business).
IMPORTANT: As an added plus for subscribers, the latest Primary Trend Index (PTI)figure for the day will be posted on our web site — posting will take place a few hours after the close of the market. Also included will be Russell’s comments and observations on the day’s action along with critical market data. Each subscriber will be issued a private user name and password for entrance to the members area of the website.
Investors Intelligence is the organization that monitors almost ALL market letters and then releases their widely-followed “percentage of bullish or bearish advisory services.” This is what Investors Intelligence says about Richard Russell’s Dow Theory Letters: “Richard Russell is by far the most interesting writer of all the services we get.” Feb. 19, 1999.
Below are two of the most widely read articles published by Dow Theory Letters over the past 40 years. Request for these pieces have been received from dozens of organizations. Click on the titles to read the articles.
The JPMorgan Global Manufacturing PMI shows Global manufacturing growth slows to near-stagnation.
At 50.5 in April, the JPMorgan Global Manufacturing PMI™ – a composite index* produced by JPMorgan and Markit in association with ISM and IFPSM – signalled expansion for the fourth straight month. The rate of expansion decelerated slightly during April, meaning that growth so far in 2013 has remained, at best, only marginal.
Japan, South Korea, Indonesia and Vietnam were the only nations to report a faster rate of improvement in operating conditions during April. Europe remained the main drag on the global aggregate, with the euro area contracting at the sharpest pace in the year-to-date and the UK stagnating.
The US PMI fell sharply to signal the slowest growth for six months. There was further stagnation in neighbouring Canada, while Mexico expanded at the weakest pace in 20 months in Mexico. Growth of manufacturing also slowed to near-stagnation in China, Russia, India and Brazil.
Global PMI April vs. March

Every facet of global manufacturing is slowing and global growth will follow. A global recession is certainly baked in the cake, if indeed a recession is not already in progress.
Shock and Awe: ECB Prepared to “Cope With Consequences of Negative Deposit Rates”; Dancing in the Dark Experiment
….read it all HERE
Mike “Mish” Shedlock
http://globaleconomicanalysis.blogspot.com
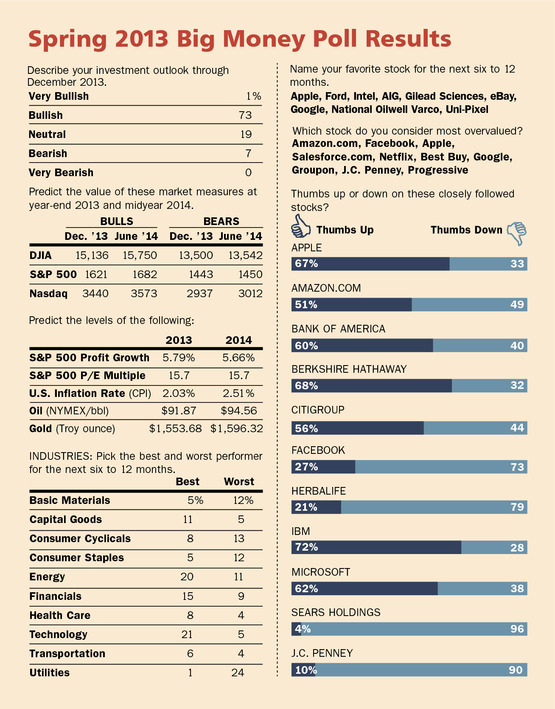
“74% of money managers are bullish on U.S. stocks, an all-time high by the magazine’s measurement. Only 7% were bearish..”
First, I am discussing capital flows and the general belief among some economists that trade and current account deficits do not matter because the money flows back in the form of investments in equities, bonds, real estate, direct investments, and corporate takeovers.
According to Barron’s Big Money Survey, “74% of large portfolio managers are bullish about stocks, which is the Highest Level Ever.” Time to be a contrarian?
I am reluctantly maintaining an approximately 25% weighting in equities (mostly in Asia and in Europe) and I have not yet shorted any stocks because I have learnt that a bubble can get bigger still and exceed my expectations – before it implodes violently.
I want to make clear that I own equities not because of the belief that they are inexpensive and that they will move up substantially but because I do not trust the banking system and, therefore, I do not wish to be overexposed to bank deposits.
Finally, has gold completed its correction and are we entering another major advance as the gold bugs tell us, or are we at the beginning of a major gold bear market as the bears want us to believe?
What the big money says about this market
“According to a recent Barron’s poll, 74% of money managers are bullish on U.S. stocks, an all-time high by the magazine’s measurement. Only 7% were bearish.”
Uh oh.
“All-times highs in bullishness” is not something I generally like to hear. If these managers are talking their book — and we have to assume they are — then this means they are likely already invested aggressively and thus have little in the way of new buying to do.
….whole commentary and details HERE
Cash & Government Bonds cannot Protect You
by Marc Faber

-
I know Mike is a very solid investor and respect his opinions very much. So if he says pay attention to this or that - I will.
~ Dale G.
-
I've started managing my own investments so view Michael's site as a one-stop shop from which to get information and perspectives.
~ Dave E.
-
Michael offers easy reading, honest, common sense information that anyone can use in a practical manner.
~ der_al.
-
A sane voice in a scrambled investment world.
~ Ed R.
Inside Edge Pro Contributors

Greg Weldon

Josef Schachter

Tyler Bollhorn

Ryan Irvine

Paul Beattie

Martin Straith

Patrick Ceresna

Mark Leibovit

James Thorne

Victor Adair