
Stocks & Equities
 “Price is what you pay; value is what you get.” – Warren Buffet
Market Buzz – A Crash Course in Valuation
For those that have followed KeyStone’s research and commentary on a regular basis, there is a single term that you have heard us discuss repeatedly – valuation. We commonly refer to valuation both when describing our overall investment philosophy and when explaining the investment merits of a particular company.
Warren Buffet once said, “Price is what you pay; Value is what you get”. What Buffet is saying is that intelligent investment practise differentiates between market price and value. Most of us have an innate concept of what value is in our everyday lives when we shop for houses, household products, automobiles, and just about anything else. We have a sense of what something is worth to us and whether or not the market price of that product is lower or higher than the value we will receive from it. In the consumer market this concept of worth or intrinsic value is often difficult to quantify and highly subject to emotional whims which can result in the consumers overpaying for products that they don’t need and eventually don’t use. We have all paid a high price for a product from which we initially thought we would get years of enjoyment and which quickly ended up collecting dust in the back corner of the basement. Whether consciously or unconsciously, in our minds we arrived at a perceived intrinsic value of that product which was above the price we were asked to pay. But in the aforementioned example, we did not adequately assess the real intrinsic value of the product as we were distracted by emotional desire and short-sighted analysis. This happens commonly in the investment market as well.
When we refer to a specific company’s valuation, we are typically talking about some form of price multiple which could be price-to-earnings, price-to-cash flow, or even, price-to-book value. Mathematically, these concepts are quite simple. As illustrated below, one simply divides the current share price by the earnings, cash flow, or book value per share.
Price-to-Earnings Multiple = Share Price / Earnings per Share
5 Times = $5.00 (share price) / $1.00 (earnings per share)
Value investors typically look for companies that trade at a relatively low valuation multiple. In most cases, with everything else being equal, the lower valuation multiple, the better the value, and the more attractive the investment. But in the real world of investing, everything else is rarely equal and this is what makes the practise of intelligent investing more complex than a simple mathematical calculation. Truthfully speaking, if the only thing an investor had to worry about was calculating valuation multiples then we could all be as rich as Warren Buffet. Unfortunately this is not the case.
The simple fact of the matter is that no two companies are identical. Some companies in the same industries may appear similar but they can still vary widely in quality due to management ability, financial position (balance sheet), earnings quality, competitive advantages and future growth (or lack thereof). For example, a value investor may find two companies with company A trading at a valuation multiple of 6 times reported earnings and company B trading at a multiple of 12 times reported earnings. With everything being equal, company A appears to be more attractively valued. However, when we conduct a deep analysis of the companies, we may determine that company A’s earnings are expected to be cut in half over the next year, while company B is expected to double their earnings. Therefore, company A’s valuation over this period is actually 12 times earnings and company B’s valuation is in fact 6 times earnings. The situation has been reversed and although at the start of the analysis, company A looked more attractively valued, we actually discovered that company B had the better valuation. A similar scenario occurs when the expected growth rates of each company are similar but one company has a more sustainable earnings profile or lower financial risk which can also warrant a higher valuation multiple. Warren Buffet who is considered a value investor himself also said, “I would rather buy a great company at a reasonable price, then a poor company at a great price.” In many (perhaps most) cases, a very low valuation multiple is in fact an indication that the company is higher risk or lower quality. It is up to the analyst to determine what constitutes an appropriate valuation given all of the attributes of the particular company and its market. The numbers help us to understand the relative value but they do not by themselves tell the whole story. They are simply one piece of a much larger puzzle.
KeyStone’s Latest Reports Section

The Stock Market Trend & Hot Sector ETF’s
Trading with the trend should be your main focus for long term success no matter what type of trader you are (Options Trader, Stock Trader, or ETF Trader) although it’s not as easy as it sounds.
The good news is that there is a simple trading model that removes 95% of trading analysis and greatly reduces trading related emotions because the key technical analysis rules based on one of the world’s best chart technicians (John Murphy) technical analysis methods have been applied to the chart automatically. The key is to identify the trend of the market. Once that is known you can focus on trading strategies that take advantage of the current trend.
Over the past few years I have been creating this indicator/chart layout tool which converts my chart reading experience, tips and tricks into a simple system removing analysis paralysis which cause most individuals to second guess what they see and don’t pull the trigger. Using too many indicators or read/listening several other traders commentaries with different views than you causes this paralysis.
My simple red light, green light model clearly shows a viewer the current trend and expected price range (high and low) looking forward a couple days. I uses a series of data points like volatility, volume, cycles, momentum, chart patterns and logic rules. It even shows extreme pivot points helping you find low risk entry prices for both bull and bear market conditions.
Recent trends and signals for the SP500 Index Daily Chart:

Trading With the Trend – The Sweet Spots
Knowing the direction of the market is simple using the chart system above but trading with the trend is not that simple because of natural human behavior. Instead traders fall victim to trying to pick a top or bottom because they think the price is overbought or oversold and they want to catch the next big trend change.
We all know the saying “the market climbs a wall of worry”. Well, the biggest worry most traders have is buying long in a bull market because stocks and price always look overbought and ready to top each week… This leads to people trying to get fancy picking a top only to get their head handed to them a few days or weeks later depending on how stubborn they are to exit a losing position.
The key to long term success is to buy during broad market (SP500) corrections once sentiment, cycles and momentum are starting to flash extreme oversold conditions. These show up as green arrows on the trend chart. At that point most sectors and high beta stocks like IBM, GOOG etc… should be at a key entry points with most of the downside risk removed already. Remember ¾ stocks follow the broad market so it only makes sense to follow it also.
What about a runaway stock market? This is when the stock market does not pullback but just keep grinding its way higher and higher… The only thing you can do is sit in cash, or look for a stock or sector that is having a small pause or pullback and get long with a small position until you get that broad market pullback and major by signal to add more.
Below are a few sectors showing a minor pause/pullback within this bull market.


Mid-Week Trend Conclusion:
Overall, the broad market remains in an uptrend. While I would like to see the SP500 pullback and give us another major buy signal like it did in December and February I do mind that much if prices keep running higher as it just give us more cushion and potential profits for when the trend does eventually roll over and flip signals. I hope you found this report interesting. It’s just scratching the surface of this topic but it’s a start.
Know the stock market trends by joining my free newsletter: www.GoldAndOilGuy.com
Chris Vermeulen

For weeks now, I have been trying to ignore the mining stocks that pop up in my “safety and value” screen. I’m just not a metals guy. My interest in commodities begins and ends with energy. But the numbers are just too good to ignore. I’m going to stick with analysis based purely on fundamentals. Note to metals traders: I’m pretty thick skinned, so feel free to criticize.
Disclosure: I have no positions in any stocks mentioned, but may initiate a long position in NEM over the next 72 hours. I wrote this article myself, and it expresses my own opinions. I am not receiving compensation for it (other than from Seeking Alpha). I have no business relationship with any company whose stock is mentioned in this article.
Phoenix, Arizona based Freeport-McMoRan Copper & Gold (FCX) and its subsidiaries comprise world’s largest producers of gold, copper and molybdenum in the world. Newmont Mining Corporation (NEM) is primarily a gold producer with headquarters in Denver, Colorado. Vale SA (VALE) is a Brazil-based metals and mining company that operates in over 38 countries. All data below sourced from company SEC filings, earnings call transcripts, and YCharts.

All three mining companies have a long history of growth. An investment in Freeport or Vale beginning ten years ago would have returned enormous sums, if you were able to stomach the volatile nature of stocks pinned to the commodities they produce. Newmont…..
…..more on Profitability, Valuation & Liquidity on all 3 HERE
Strength in U.S. equity markets last week triggered by surprising strength in economic indicators was unexpected. U.S. equity markets quickly regained short term momentum. Positive psychology related to the Dow Industrials reaching all-time highs also helped. This week, economic data is expected to be positive again and the S&P 500 Index (a more significant U.S. equity index) will have a chance of reaching its all-time high at 1,576.09. Meanwhile, short and intermediate technical indicators once again have returned to overbought levels.
Selected sectors with favourable seasonality at this time of year remain attractive purchases candidates on weakness. The trigger could be a rollover of the U.S. Dollar from a highly overbought level. If it happens, commodity stocks including metals & mining, energy, coal and steel stocks will come alive. All recorded exceptional gains on Thursday and Friday.
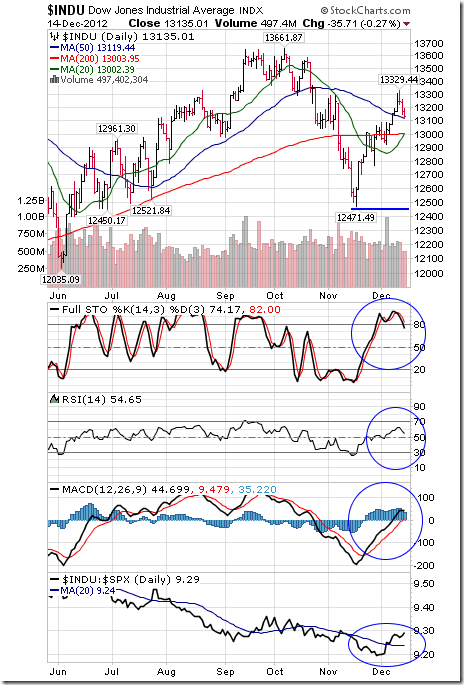
The Dow Jones Industrial Average gained 307.41 points (2.18%) to an all-time high last week. Intermediate trend is up. The Average remains above its 20, 50 and 200 day moving averages. Strength relative to the S&P 500 Index remains positive. Short term momentum indicators are overbought.

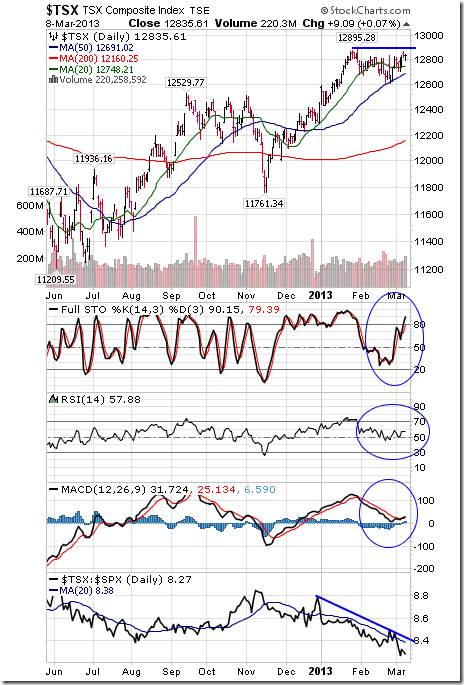
The TSX Composite Index added 62.49 points (0.49%) last week. Intermediate trend changed from down to neutral on a move above 12,823.50. Resistance is at 12,895.28.The Index remains above its 20, 50 and 200 day moving averages. Strength relative to the S&P 500 Index changed from neutral to negative. Short term momentum indicators are trending up.
…..a beautiful Monday Morning Display of Charts and Commentary by Don Vailoux HERE
Index futures moved higher following release of the U.S. employment report at 8:30 AM EST. Consesnsus for February Non-farm Payrolls was 165,000 versus 157,000 in January. Actual was an increase of 236,000. However, January was adjusted to 119,000 from 157,000. Consensus for February Private Non-farm Payrolls was 178,000 versus 166,000. Actual was 246,000 versus an adjusted 140,000 in January. Consensus for the February Unemployment Rate was 7.9% versus 7.9% in January. Actual was a decline to 7.7%. Consensus for February Hourly Earnings was a gain of 0.2% versus an increase in 0.2% in January. Actual was a gain of 0.2%.
Canada’s February Employment report was brighter than the U.S. employment report. Consensus for February employment was an increase of 8,000 versus a decline of 21,900 in January. Actual was an increase of 50,700.
Canada’s Housing Starts in February were better than expected. Consensus was 174,000 versus 160,600 in January. Actual was 188,719.
Hecla Mining added $0.10 to $4.18 after Global Hunter upgraded the stock from Neutral to Buy.
Tiffany fell $0.88 to $70.00 after Canaccord downgraded the stock from Hold to Sell.
Mark Leibovit on Bloomberg Radio
Following is a link to yesterday’s interview:
http://www.vrtrader.com/files/BloombergwithPimmFoxMarch72013.mp3
Interesting Charts
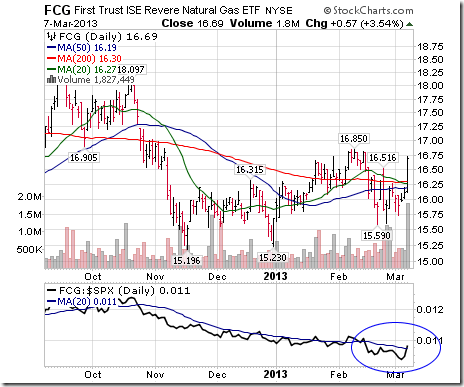
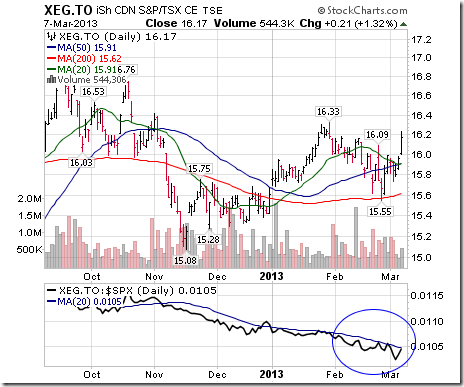
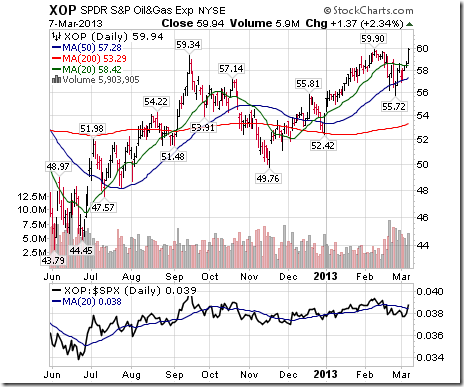
The energy sector finally woke up yesterday after significantly underperforming the market during the past four weeks.
The Money Center ETF broke to a new high yesterday prior to release of stress tests by the Federal Reserve on the top 18 U.S. financial institutions. All except Allied Financial past the test. Traders are expected several of the Money Center banks to respond by increasing their dividend shortly.

Updates on Sector Seasonal Trades
Seasonal trades optimally have a technical score of 3 based on (1) uptrend, (2) trading above its 20 day moving average and (3) outperforming the market (S&P 500 for U.S. holdings, TSX for Canadian holdings). Scores moving lower than 3 are warnings signs. A score of 0-0.5 is a sell signal. The following seasonal trades have a technical score of 1.0 or higher and are in their period of seasonal strength. Their retention is recommended.
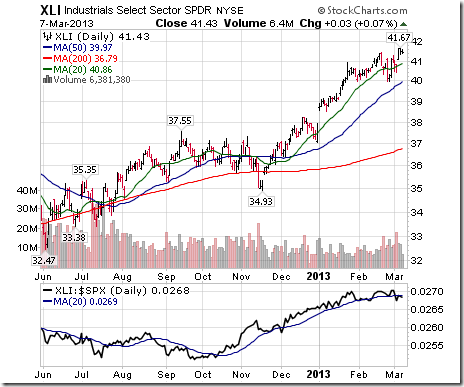
Technical score for Industrial SPDRs changed from 3.0 to 2.5 when strength relative to the S&P 500 Index changed from positive to neutral. Seasonal influences are positive until early May.
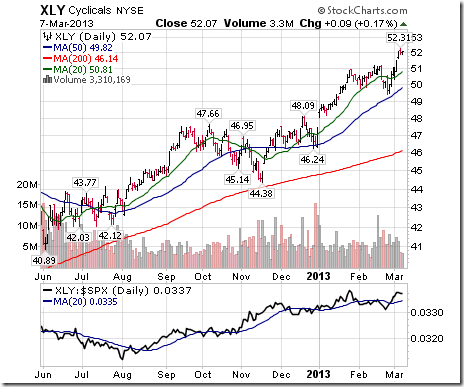
Technical score for Consumer Discretionary SPDRs changed from 2.5 to 3.0 after units broke above resistance at $51.23. Seasonal influences are positive until mid-April.
Technical score on Retail SPDRs increased to 1.5 to 2.5 when units moved above their 20 day moving average. Seasonal influences are positive until mid-April.

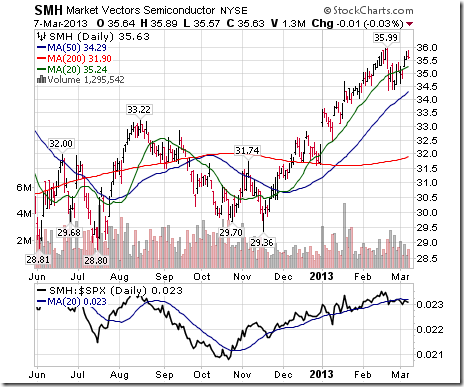
Technical score for the Semiconductor ETF remains unchanged at 2.0. However, the period of seasonal strength on average closes today. Take profit
Technical score for Palladium increased from 1.0 to 2.0 on a move above its 20 day moving average. Seasonal influences are positive until the end of April.
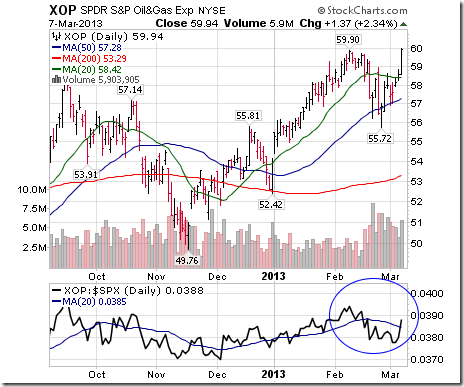
Technical score for the Oil & Gas Oil and Gas Exploration ETF increase from 1.0 to 2.5 on a move above its 20 day moving average, a break above resistance at $59.90 and an improvement by relative strength from negative to neutral. Seasonal influences are positive until mid-April.
Technical score by Energy SPDRs increased to 2.0 from 1.0 when units moved above their 20 day moving average. Seasonal influences are positive until the end of April.
Technical score by Gasoline remains unchanged at 1.0. Seasonal influences are positive until the end of April.

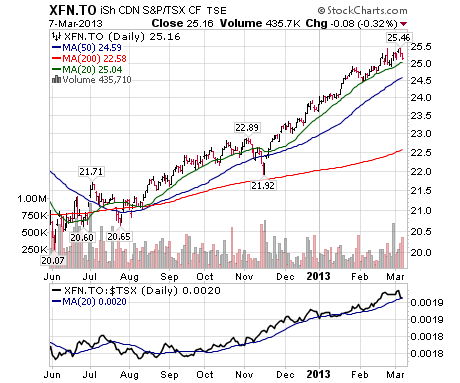
Technical score for the TSX Financial Services ETF remains unchanged at 3.0. Seasonal influences are positive until mid-April.
Special Free Services available through www.equityclock.com
Equityclock.com is offering free access to a data base showing seasonal studies on individual stocks and sectors. The data base holds seasonality studies on over 1000 big and moderate cap securities and indices. Notice that most of the seasonality charts have been updated recently.
To login, simply go to http://www.equityclock.com/charts/
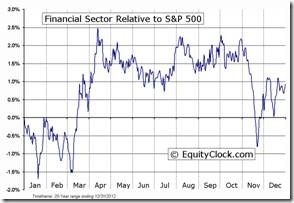
Following is an example:
Financial Sector Seasonal Chart

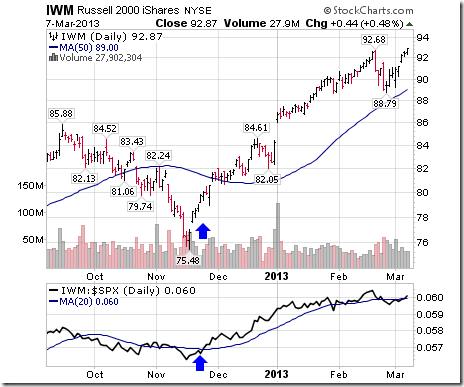
An Update on the U.S. Small Cap sector/market
According to Thackray’s 2013 Investor’s Guide, the period of seasonal strength for the U.S. small cap sector is from December 19thto March 7th. This year the technical clicked in earlier than usual. Units moved above their 20 day moving average and began to outperform the S&P 500 Index in late November. Since then, units significantly outperformed the S&P 500 Index. However, units currently have returned to neutral relative to the S&P 500 Index and the period of seasonal strength has ended. Nice trade! Take seasonal profits.

-
I know Mike is a very solid investor and respect his opinions very much. So if he says pay attention to this or that - I will.
~ Dale G.
-
I've started managing my own investments so view Michael's site as a one-stop shop from which to get information and perspectives.
~ Dave E.
-
Michael offers easy reading, honest, common sense information that anyone can use in a practical manner.
~ der_al.
-
A sane voice in a scrambled investment world.
~ Ed R.
Inside Edge Pro Contributors

Greg Weldon

Josef Schachter

Tyler Bollhorn

Ryan Irvine

Paul Beattie

Martin Straith

Patrick Ceresna

Mark Leibovit

James Thorne

Victor Adair