
Stocks & Equities
As bad as it has been for me in the junior resource market the last year or two, being on the right side (or at least avoiding being on the wrong side) of the U.S. stock market for almost my entire 30 year career in and around Wall Street has been a good thing.
From several thousand DJIA points lower, I spoke about a new, all-time high to come. Knowing you’re only as good as your last call (and some on Wall Street have milked that for years), where do we go from here?

The chart above was from an excellent article from Safehaven.com that I used in my January 3, 2013 edition. It fits well into my long-standing belief that this rally would not only take us to a new high, but after running some after that, would then crater into the worse bear market of the modern era. I don’t know the exact number or date but I do believe the best strategy is to begin a scale-up sell program and what monies need to be in general equities be allocated to areas of the world more likely to prosper versus the U.S.
I continue to find equity portfolios in North America seriously overloaded with public companies that derived the majority of their business in North America. Like it or not, the United States is no longer the economic engine that pulls the world’s economy anymore.
Investors should tap market segments most geared to faster global growth and less exposed to US consumption. This belief suggests lowering exposure to small and mid-caps and favoring large and mega-cap companies, which benefit the most when global growth accelerates and are the least sensitive to a slower domestic economy.
To benefit from global growth even more directly, investors can reduce their overall US allocation. For most of the past three years, the US has been a safe port in the storm. Part of the reason is an incredibly resilient corporate sector, which until recently has effectively delivered double-digit earnings from low single-digit economic growth. But US competitiveness was not the only factor. On a relative basis, the US has been the unintended beneficiary of an unexpected slowdown in emerging markets, Europe’s fiscal crisis, and an over aggressive out of control Federal Reserve.
Today, while US companies are still reasonably priced, they are relatively expensive compared with the rest of the world (the S&P 500 trades at a 40 per cent premium to international markets based on price-to-book). Given the near-term outlook for slower growth, more volatility, and a debt-ceiling showdown, that premium may no longer be justified. At the same time, the rest of the world is in marginally better shape. Given the shift in relative fundamentals, investors should consider reallocating much of their holdings out of the US and into emerging markets, smaller developed markets and European exporters.
For example, many smaller developed markets – Australia, Singapore, Hong Kong, Switzerland, and Canada – came out of the financial crisis much better positioned than the larger, developed countries. Generally, their labor markets were less impacted and their fiscal situation looks credible and, in some cases, quite good. While these nations have their own challenges, valuations are generally more forgiving and growth estimates may be less prone to disappointment. At the minimum, they appear to be the lesser of two evils.
The 21st century economic engine is now China. It has surpassed the U.S. to become the world’s biggest trading nation last year as measured by the sum of exports and imports of goods. China’s growing influence in global commerce threatens to disrupt regional trading blocs as it becomes the most important commercial partner for some countries. Germany may export twice as much to China by the end of the decade as it does to France
For so many countries around the world, China is becoming rapidly the most important bilateral trade partner by the end of the decade many European countries will be doing more individual trade with China than with bilateral partners in Europe.
Missed China boom? India is the next china.
From 1990 to 2010, growth in both countries’ labor forces was comfortably above 200 million people. Over the next 20 years, India is forecast to add another 200 million to its workforce. China just 3 mil. China’s labor force will turn negative in 2016 or 2017. These aren’t guesses. These people are already alive. It will create huge wage pressures. After years of intense investment, China will have enormous installed capacity but a shortage of labor. India will have a shortage of installed capacity and excess labor.
So where will we see the next construction boom? India. China will supply the cement, steel and capital to India as it has tried to do to Africa. But only India has the size and potential scale to absorb it. India needs hundreds of billions to be spent on infrastructure and China can supply much of the materials needed.
India, moreover, is still urbanizing. Brazil and China are a long way down the urbanization path. In India, 70 per cent of the population is stull rural.
The risk in this?
The problem is that India does not have the regulatory framework to permit large scale infrastructure projects. It needs a central agency to provide the “comfort and guarantees” to make investment possible. How likely is that? India embarked on reform in the 1990s but the process has been stalled for years. As the need to resume it has become more urgent, the government has only become more ineffective. On present form, India faces a descent into social unrest before its politicians rediscover a sense of urgency. I believe it will eventually enact reform, after time.
Bottomline – It’s not if the United States implodes, but when. Bernanke’s Ponzi finance is self-sabotaging. Endless cheap money upsets the balance between credit expansion and real economic growth, resulting in diminishing returns. Each additional dollar of credit seems to create less and less results. In the 1980s, it took four dollars of new credit to generate $1 of real GDP. Over the last decade, it has taken $10, and since 2006, $20 to produce the same result. With debt now heading over 100% of GDP, history shows any and all economies that go into triple digits are hindered. The U.S. shall be no exception.
Unlike so many who remained bearish on U.S. equity market from the lows in 2009, I not only didn’t stand in its way and get run over, but a new, all-time high I spoke of has arrived.
Seeing them high-fiving again on Tout-TV and much of the media (that makes their monies following the pied pipers of the “Don’t Worry, Be Happy” camp that fills the boardrooms and sales floors of the financial industry at-large) writing about “Happy Days Are Here Again”, the ingredients of that ultimate top are now brewing. Exactly when it all comes together I don’t know but as it has been for almost my entire 30-year career in and around the financial arena, you can feel it in your bones (the only difference now is there’s a lot more fat around those bones).

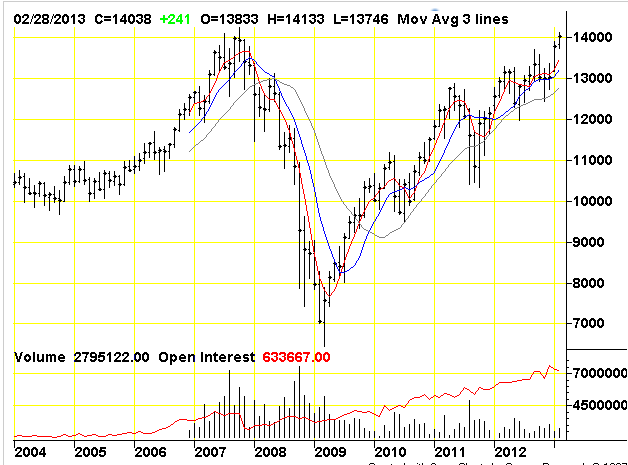 Five and a half years ago, the Dow Jones Industrial Average set an all-time record high of 14,165 points before sliding into the second-worst bear market in its history. Yesterday, the Dow broke its record, nearly four years to the day from the start of its rebound. Memories of that long fall still linger, staining the perception of those who endured it and tempering the optimism of all but the most fervent bull. Doomsayers are to be expected this far into a sustained rally — which, at more than 1,000 trading days with no real correction, has now run well ahead of both the median and average length of all bull markets since the Dow’s creation. But does this market really deserve the distrust, fear, and outright anger many investors have shown toward it as it continues to defy calls for another crash?
It’s important to have a little perspective.
…..read it all HERE
Almost four years to the day after the Dow made its ultimate financial crisis low, the Dow officially posts a new all-time record high — a rather remarkable feat considering where both the market and the economy were not so long ago. For some perspective, today’s chart illustrates the trend of the non-inflation-adjusted Dow from 1990 to the present. As the chart illustrates, the stock market has been especially volatile as it navigated through a couple of historic boom bust cycles (i.e. dot-com boom and bust of 1995-2002 followed by the credit boom and bust of 2002-2009). As for the post-financial crisis rally, it stands out for the obstacles that it had to overcome (e.g. housing market plunge, near financial meltdown, European sovereign debt crisis, etc.) with the Dow still being able to more than double since its March 2009 low. All in all, it has been an impressive and resilient performance.
Notes:
Where’s the Dow headed? The answer may surprise you. Find out right now with the exclusive & Barron’s recommended charts of Chart of the Day Plus.

Quote of the Day
“There is a tendency for things to right themselves.” – Ralph Waldo Emerson
Events of the Day
March 09, 2013 – Daylight Saving Time begins (US)
March 17, 2013 – St. Patrick’s Day
Stocks of the Day
— Find out which stocks investors are focused on with the most active stocks today.
— Which stocks are making big money? Find out with the biggest stock gainers today.
— What are the largest companies? Find out with the largest companies by market cap.
— Which stocks are the biggest dividend payers? Find out with the highest dividend paying stocks.
— You can also quickly review the performance, dividend yield and market capitalization for each of the Dow Jones Industrial Average Companies as well as for each of the S&P 500 Companies.

 As of this year, we’ve been handed the playbook…
More evidence of shallow correction! Economic data released this week generally will show a slowdown in economic growth in the month of February
Earnings reports this week are not expected to have a significant impact on equity prices
Political influences on equity markets are diminished this week. Congress is on holidays. The next critical date is March 27thwhen a continuing resolution needs approval by Congress.
Short and intermediate technical indicators continue to show that at least a short term peak has been reached by most equity markets and sectors.
Cash hoards remain high, but are declining as companies announce dividend increases and share buybacks instead of capital spending.
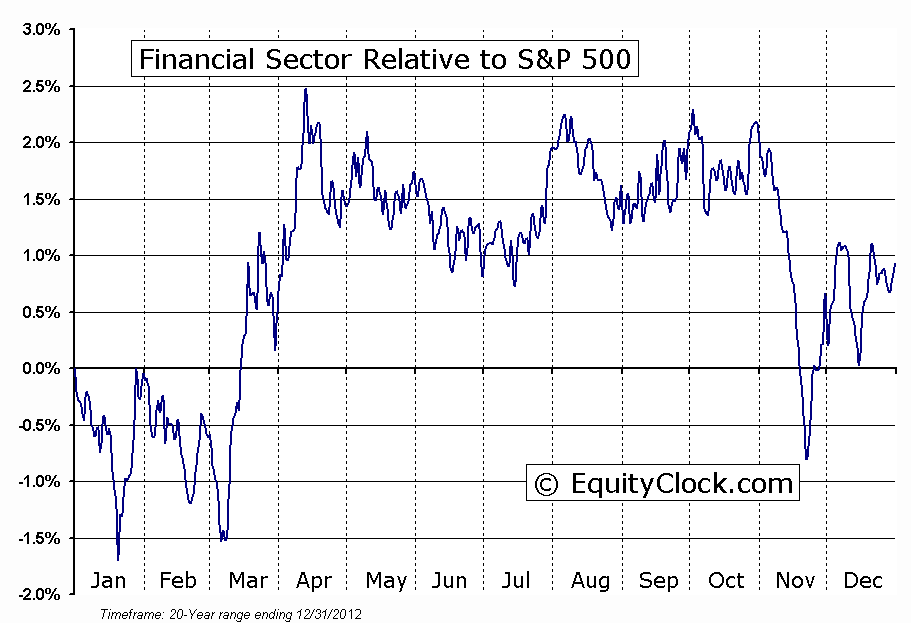
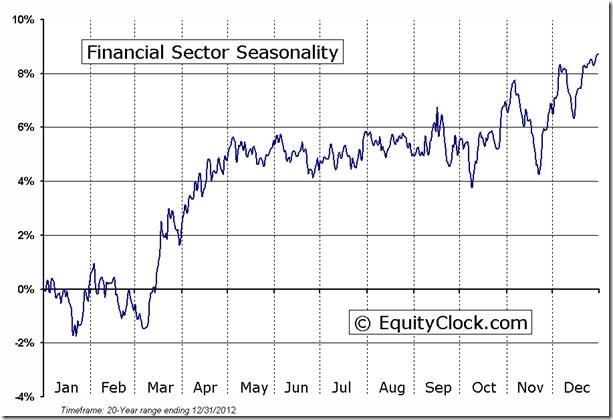
The Bottom Line: A shallow correction between now and the end of March will provide an opportunity to accumulate sectors on weakness that have a history of outperformance into spring. Sectors on the radar screen include energy, retail, steel and auto & auto parts?
With the exception of the Dow Jones Industrial Average and the Dow Jones Transportation Average which moved to new highs last week, most equity indices and sectors peaked between January 30th and February 20th. The peak coincides with average performance by the S&P 500 Index in a post-election year. History suggest that a shallow correction in equity markets has started that likely will last until the end of March/first week in April. (Special Free Services of charts below available through www.equityclock.com )
Equity Trends
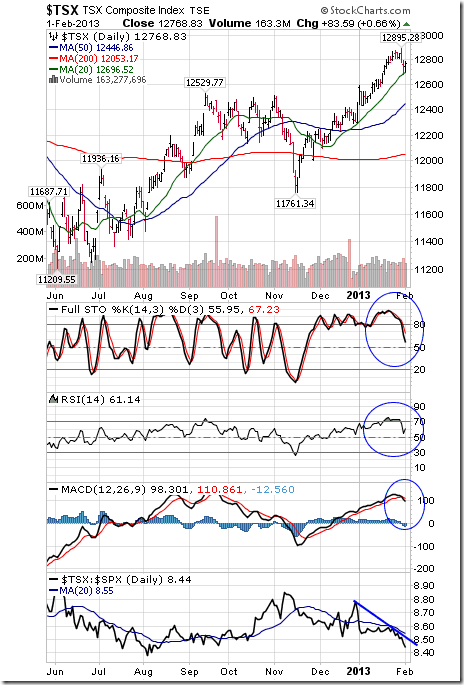
The TSX Composite Index gained 71.49 points (0.56%) last week. Intermediate trend remains down. Resistance is at 12,895.28. The Index remains above its 20, 50 and 200 day moving averages. Strength relative to the S&P 500 Index changed from negative to neutral. Short term momentum indicators have declined to neutral levels.
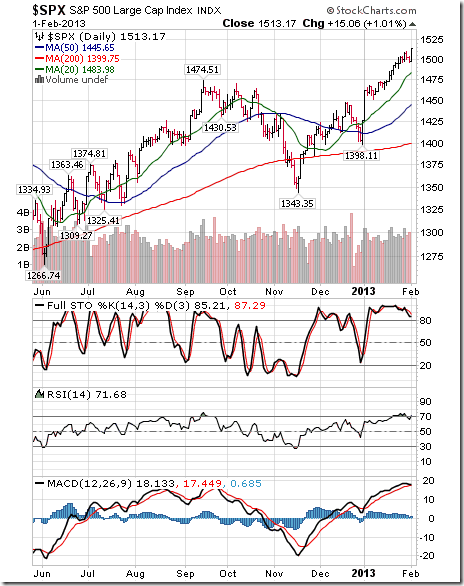
The S&P 500 Index added 2.60 points (0.17%) last week. Intermediate trend is up. Resistance is forming at 1,530.94. The Index remains above its 20, 50 and 200 day moving averages. Short term momentum indicators have declined to a neutral level.
….. Read it all & view 45 Charts HERE

-
I know Mike is a very solid investor and respect his opinions very much. So if he says pay attention to this or that - I will.
~ Dale G.
-
I've started managing my own investments so view Michael's site as a one-stop shop from which to get information and perspectives.
~ Dave E.
-
Michael offers easy reading, honest, common sense information that anyone can use in a practical manner.
~ der_al.
-
A sane voice in a scrambled investment world.
~ Ed R.
Inside Edge Pro Contributors

Greg Weldon

Josef Schachter

Tyler Bollhorn

Ryan Irvine

Paul Beattie

Martin Straith

Patrick Ceresna

Mark Leibovit

James Thorne

Victor Adair