
Stocks & Equities
Weekly Commentary
Stockscores Market Minutes Video
Good trades start with good foundations. That is the topic of this week’s Market Minutes video, along with my regular market analysis. Watch it by clicking here. To receive email alerts any time I upload a new video, subscribe to the Stockscores channel atwww.youtube.com/stockscoresdotcom.
Order the Mindless Investor book now
“The Mindless Investor” is not yet in stores but you can now order advanced copies of it. To do so, first log in to Stockscores.com and then cut and paste this link in to the address bar of your browser. Doing so will add the charge ($29.95 + $6.50 shipping) to your shopping cart so you can complete the transaction.
http://www.stockscores.com/cart.asp?caction=add&prodid=2254
This week’s Trading Lesson
My formula for finding winning stocks is pretty simple. Look for stocks making abnormal price breaks, preferably with abnormal volume, from low price volatility, optimism and through resistance. You can do this when you are day (< 1 day hold), swing (1 day to 2 week hold), position (2 week to 6 month hold) or long term trading (6 month + hold). The only difference is what chart time frame you apply the concept to.
If you want to make a swing trade, look for these abnormal breaks from good chart patterns on 15 minute charts. A long term trader will look for this chart pattern on a weekly or daily chart.
The key is that you have to find these stocks early in their runs because the longer you wait, the farther they get from their price base, leaving you with more risk and less reward potential. Catch them early and you can enjoy most of the price move. I discuss this in more detail in this week’s Market Minutes video, which you can watch by clicking here.
How do you find the stocks making abnormal price moves from good chart patterns? The answer depends on the type of trading you are doing. The shorter the anticipated hold period, the more important it is to find them early. A day trader needs a sophisticated real time analysis program like Tradestation to catch them just as the moves are staring up.
Tradestation is helpful for swing trading too but less important. As you move toward position trading and long term trading, real time analysis becomes much less important. Day trading is not what most people want to do so utilizing the Market Scan tool on Stockscores.com is more than sufficient.
Here is a really simple thing to do with the Market Scan to find the stocks that are moving. We want stocks that are liquid enough to move in and out of, are moving up stronger than we would normally expect and are making a break through resistance.
Early in the trading day, say the first 3 hours, I scan using the following settings:
- Gain/Loss >= 2%
- 5 Day Resistance = Breakout
- Number of Trades > 250 (for all Canadian Exchanges) or 1000 (for American Exchanges)
Closer to the end of the trading day, or in the evenings, I modify the scan as follows:
- Abnormal Activity = Abnormal Day Up
- 5 Day Resistance = Breakout
- Number of Trades > 250 (for all Canadian Exchanges) or 1000 (for American Exchanges)
When you look at the charts for the stocks that this scan finds, ask yourself this question first.
“Is the stock just starting to move or has it been moving up for a while?”
I want to find stocks that are just moving from periods of sideways trading because that makes it easier to manage risk and increases the reward potential. The longer you wait, the less upside and the more downside.
I also want to see that the stock is breaking from a rising bottom on the chart as this is a sign that investors are optimistic. The breakout is more important if supported by abnormal volume as well.
It is very important to be patient for good trades. You can find trades that look “pretty good” daily but it is the great looking trades that make you your profits. You will actually make more by trading less provided you are trading less because you are fussy.
Strategy of the Week
I ran the Market Scan described above, doing it separately for the Canadian and US markets. For Canada, using the 250 trades as the liquidity threshold, the filter found 6 stocks. For the US, with 1000 trades, it found 34 stocks.
I then inspected these 40 charts to look for good patterns and found that none of the Canadian charts passed my tests while one US listed stock has a good chart pattern, see below:
Stocks That Meet That Featured Strategy
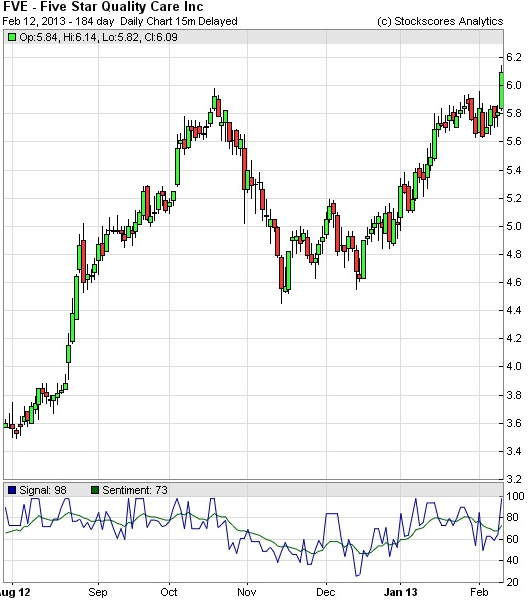
1. FVE
FVE is breaking from a cup and handle pattern today with abnormal volume supporting the breakout. While the stock has been moving higher since last Fall, it has stalled under resistance at $6 since October 2012. Today the stock made the break through that ceiling, a sign that it has a good chance of moving higher in the coming weeks. Support at $5.70.
- References
- Get the Stockscore on any of over 20,000 North American stocks.
- Background on the theories used by Stockscores.
- Strategies that can help you find new opportunities.
- Scan the market using extensive filter criteria.
- Build a portfolio of stocks and view a slide show of their charts.
See which sectors are leading the market, and their components.
Disclaimer
This is not an investment advisory, and should not be used to make investment decisions. Information in Stockscores Perspectives is often opinionated and should be considered for information purposes only. No stock exchange anywhere has approved or disapproved of the information contained herein. There is no express or implied solicitation to buy or sell securities. The writers and editors of Perspectives may have positions in the stocks discussed above and may trade in the stocks mentioned. Don’t consider buying or selling any stock without conducting your own due diligence.

Investors Are More Bullish Than In 99% Of All Periods Since 2002.
According to the firm’s Bull & Bear Index, which tracks sentiment using indicators like hedge fund market exposure, fund flows, long-only investor positioning and so forth, investors are more bullish than they were in 99% of periods since 2002.
The current B&B reading is 9.6 (on a scale of 0 for max bearish and 10 for max bullish). It suggests investor sentiment is currently more bullish than 99% of all readings since 2002. Extreme bullishness is characterized by robust inflows to EM equity funds, overbought high-yield credit markets relative to treasuries and aggressive hedge fund positions for a weaker yen and stronger oil prices.

What’s even worse. This extreme surge in bullishness comes even as there’s been a breakdown of late in the economic data, as measured by the BofA/ML Economic Surprise Index.

Thus bulls should have reason to worry. Everyone is bullish, and lately he data isn’t holding up so hot, relative to expectations.
In the meantime, the moment of truth for the economy approaches: HERE
JAPANESE STOCKS SOAR AFTER TWO-DECADE DROP
Japan’s stock market has taken off, with the Nikkei Stock Average soaring more than 30 percent since Nov. 14 to a four-year high.

That ascent follows just a brief little 22-year decline.

In fact, investors have poured money into Japan equity funds in 10 of the last 12 weeks, according to EPFR Global data cited by The Journal. Net inflows totaled $3.09 billion during the perio
The rise has come amid optimism over new Prime Minister Shinzo Abe’s economic stimulus plans.
They include a weaker yen, which is boosting the fortune of Japan’s big exporters like Sony, Panasonic and Toyota. A falling currency helps a country’s exports by making them cheaper in foreign currency terms.
Goldman Sachs analysts figure that Japanese exporters’ profit rise 7 to 10 percent for every 10 yen that the dollar rises, The Wall Street Journal reports.
The dollar hit a 2 ½-year high of 94.06 yen this week.
“The stock story has mostly been a yen-driven phenomenon, no question,” Naoki Fujiwara, a fund manager at Shinkin Asset Management, tells The Journal. “Some investors are finding that they can’t afford to remain on the sidelines.”
Lorne Steinberg, chief executive of Lorne Steinberg Wealth Management in Montreal, believes the market will keep rising. “We could be looking at a two-to-three year equity market rally,” he says.
Construction companies have registered the highest risk-adjusted return among Japanese stocks since an earthquake and tsunami hit the country on March 10, 2011, according to Bloomberg.
“Public works investment will be robust in the long term when you consider the government’s plan to strengthen infrastructure,” Masaru Hamasaki, chief strategist at Toyota Asset Management, tells Bloomberg.
“That’s highly likely to give construction companies a stable revenue source.”
However, Japan’s public debt is more than twice the size of the economy.
“You can’t keep expanding public works when you think about Japan’s fiscal situation,” Isao Kubo, a Tokyo-based equity strategist at Nissay Asset Management, tells Bloomberg. “There’s been support for construction stocks since the earthquake, but I don’t think it will last long.”
Money News: The ‘Unthinkable’ Could Happen — Wall Street Journal. Prepare for Meltdown
Japan’s stock market has taken off, with the Nikkei Stock Average soaring more than 30 percent since Nov. 14 to a four-year high.
That ascent follows just a brief little 22-year decline.
In fact, investors have poured money into Japan equity funds in 10 of the last 12 weeks, according to EPFR Global data cited by The Journal. Net inflows totaled $3.09 billion during the perio
The rise has come amid optimism over new Prime Minister Shinzo Abe’s economic stimulus plans.
They include a weaker yen, which is boosting the fortune of Japan’s big exporters like Sony, Panasonic and Toyota. A falling currency helps a country’s exports by making them cheaper in foreign currency terms.
Goldman Sachs analysts figure that Japanese exporters’ profit rise 7 to 10 percent for every 10 yen that the dollar rises, The Wall Street Journal reports.
The dollar hit a 2 ½-year high of 94.06 yen this week.
“The stock story has mostly been a yen-driven phenomenon, no question,” Naoki Fujiwara, a fund manager at Shinkin Asset Management, tells The Journal. “Some investors are finding that they can’t afford to remain on the sidelines.”
Lorne Steinberg, chief executive of Lorne Steinberg Wealth Management in Montreal, believes the market will keep rising. “We could be looking at a two-to-three year equity market rally,” he says.
Construction companies have registered the highest risk-adjusted return among Japanese stocks since an earthquake and tsunami hit the country on March 10, 2011, according to Bloomberg.
“Public works investment will be robust in the long term when you consider the government’s plan to strengthen infrastructure,” Masaru Hamasaki, chief strategist at Toyota Asset Management, tells Bloomberg.
“That’s highly likely to give construction companies a stable revenue source.”
However, Japan’s public debt is more than twice the size of the economy.
“You can’t keep expanding public works when you think about Japan’s fiscal situation,” Isao Kubo, a Tokyo-based equity strategist at Nissay Asset Management, tells Bloomberg. “There’s been support for construction stocks since the earthquake, but I don’t think it will last long.”
Money News: The ‘Unthinkable’ Could Happen — Wall Street Journal. Prepare for Meltdown
Legendary 88 yr Old Dow theorist Richard Russell says investors should approach the latest dow theory buy signal with trepidation.
In brief, Dow theory says that when the Dow Jones Industrial Average and the Dow Jones Transportation Average move in tandem, up or down, the rest of the market will move with it. If one is making a new high, while the other is not doing well, you should be skeptical of the durability of the rally.
We told you about a developing Dow theory buy signal a couple weeks ago — the Dow Transports hit a high, catching up with Dow Industrials, which had also hit a high.
But Russell warns that Dow theory doesn’t operate in a bubble. There’s another element to consider: the Relative Strength Index, or RSI. From King World News:
It seems so easy — all the Dow has to do is climb another 174 points, and eureka, it’s at a new record high, and at the same time it has confirmed the new record highs in the Transportation Average.
Wait, note that RSI is at its severe overbought zone for the first time in almost two years. In the last five years, RSI has signaled overbought five times. At the bottom of the chart we see the 89-day rate-of-change (this is momentum).
Russell’s chart from his recent daily letter:

Ed Note: a couple of great timeless articles from Russell:
“Rich Man, Poor Man (The Power of Compounding)“
….. more from Business Insider HERE : The Stupidest Reason To Sell Stocks
Russell began publishing Dow Theory Letters in 1958, and he has been writing the Letters ever since (never once having skipped a Letter). Dow Theory Letters is the oldest service continuously written by one person in the business.
Russell gained wide recognition via a series of over 30 Dow Theory and technical articles that he wrote for Barron’s during the late-’50s through the ’90s. Through Barron’s and via word of mouth, he gained a wide following. Russell was the first (in 1960) to recommend gold stocks. He called the top of the 1949-’66 bull market. And almost to the day he called the bottom of the great 1972-’74 bear market, and the beginning of the great bull market which started in December 1974.
The Letters, published every three weeks, cover the US stock market, foreign markets, bonds, precious metals, commodities, economics –plus Russell’s widely-followed comments and observations and stock market philosophy.
In 1989 Russell took over Julian Snyder’s well-known advisory service, “International Moneyline”, a service which Mr. Synder ran from Switzerland. Then, in 1998 Russell took over the Zweig Forecast from famed market analyst, Martin Zweig. Russell has written articles and been quoted in such publications as Bloomberg magazine, Barron’s, Time, Newsweek, Money Magazine, the Wall Street Journal, the New York Times, Reuters, and others. Subscribers to Dow Theory Letters number over 12,000, hailing from all 50 states and dozens of overseas counties.
A native New Yorker (born in 1924) Russell has lived through depressions and booms, through good times and bad, through war and peace. He was educated at Rutgers and received his BA at NYU. Russell flew as a combat bombardier on B-25 Mitchell Bombers with the 12th Air Force during World War II.
One of the favorite features of the Letter is Russell’s daily Primary Trend Index (PTI), which is a proprietary index which has been included in the Letters since 1971. The PTI has been an amazingly accurate and useful guide to the trend of the market, and it often actually differs with Russell’s opinions. But Russell always defers to his PTI. Says Russell, “The PTI is a lot smarter than I am. It’s a great ego-deflator, as far as I’m concerned, and I’ve learned never to fight it.”
Letters are published and mailed every three weeks. We offer a TRIAL (two consecutive up-to-date issues) for $1.00 (same price that was originally charged in 1958). Trials, please one time only. Mail your $1.00 check to: Dow Theory Letters, PO Box 1759, La Jolla, CA 92038 (annual cost of a subscription is $300, tax deductible if ordered through your business).
IMPORTANT: As an added plus for subscribers, the latest Primary Trend Index (PTI) figure for the day will be posted on our web site — posting will take place a few hours after the close of the market. Also included will be Russell’s comments and observations on the day’s action along with critical market data. Each subscriber will be issued a private user name and password for entrance to the members area of the website.
Investors Intelligence is the organization that monitors almost ALL market letters and then releases their widely-followed “percentage of bullish or bearish advisory services.” This is what Investors Intelligence says about Richard Russell’s Dow Theory Letters: “Richard Russell is by far the most interesting writer of all the services we get.” Feb. 19, 1999.
Below are two of the most widely read articles published by Dow Theory Letters over the past 40 years. Request for these pieces have been received from dozens of organizations. Click on the titles to read the articles.
“Rich Man, Poor Man (The Power of Compounding)“
- After a year cowering in the corner, are investors going all-in?
- Small-caps take a leadership role…
- Plus: a reader talks politics and Dow 40,000…
2012 featured more of the same from skittish investors.
They shunned risk. Instead, anyone interested in equities stuck to blue chips. Stocks paying a decent dividend received plenty of attention, while smaller companies were virtually ignored. Hesitant, fearful buying defined the collective attitude toward equities.
But something changed after the market began moving higher three months ago…
For most of 2012, small-caps and large stocks slogged through the ups and downs within spitting distance of each other. But since the market began to move off its November bottom, the Russell 2000 small-cap index has outpaced the Dow Jones Industrial Average by a wide margin…

Appetite for risk has abruptly changed. The Russell is up an impressive 18% since its November lows, while the Dow has risen about 11.5% during the same timeframe. Even as stocks consolidate this week, smaller names have not given up much ground to the big kids.
The last time we saw similar small-cap outperformance was in September 2010. In that case, a strong Russell helped propel a broad market rally lasting more than 10 months.
When investors show they are willing to take chances on some of the smaller, more volatile names on the market, stocks will continue higher.
Pay close attention to the Russell as stocks consolidate this week. If it fails to hold its ground, you’ll have an early signal to take profits…
Best,
Greg

-
I know Mike is a very solid investor and respect his opinions very much. So if he says pay attention to this or that - I will.
~ Dale G.
-
I've started managing my own investments so view Michael's site as a one-stop shop from which to get information and perspectives.
~ Dave E.
-
Michael offers easy reading, honest, common sense information that anyone can use in a practical manner.
~ der_al.
-
A sane voice in a scrambled investment world.
~ Ed R.
Inside Edge Pro Contributors

Greg Weldon

Josef Schachter

Tyler Bollhorn

Ryan Irvine

Paul Beattie

Martin Straith

Patrick Ceresna

Mark Leibovit

James Thorne

Victor Adair