
Stocks & Equities
To say I had a lousy 2012 would be putting it mildly. The S&P 500 (INDEXSP:.INX) was up about 16% for the year, while my trading account finished down.
So what happened?
Did I have a run of bad luck with a bunch of bad stocks?
Nope! Due to big fat bets on Apple (NASDAQ:AAPL), Qualcomm (NASDAQ:QCOM), and Lions Gate (NYSE:LGF), I was up over 30% by March, despite being over 50% in cash.
Unfortunately, I then ingested a lethal hubris cocktail and started dabbling in all sorts of nefarious activities, including (but most definitely not limited to):
1. Messing around with natural gas options.
2. Being “smart” by making everything complicated.
3. Ignoring my bread and butter (betting on consumer trends) in the name of becoming yet another wannabe global macro trader.
My only consolation is that my idiotic moves were done behind my kimono, not appearing here on Minyanville.com or on the Buzz & Banter.
To keep myself from making another mess, I’ve constructed a checklist of questions I ask myself before making a trade to ensure that I never repeat last year’s extreme bout of self-sabotage. In the interests of entertainment and education , I’ve decided to post it here for you.
So let’s start with the most basic of questions you should ask yourself before making a trade:
1. Do I Have Any Idea What I’m Dealing With Here?
The commodification of trading through cheap commissions and the ETF-ication of everything on planet Earth means it’s easy to speculate on whatever comes to mind.
However, just because you can trade something that you don’t understand doesn’t mean you should.
Want to bet on Greek stocks? Then maybe you should know whether the EU is about to vote on an aid package.
How about corn prices? You should probably have some idea of what corn demand looks like right now, and what happens when futures contracts roll over.
Or maybe you’re looking at a bank stock like JPMorgan (NYSE:JPM). Wouldn’t it make sense to know how the shape of the yield curve affects bank earnings? Or whether some Senate subcommittee is about to launch a drone attack on the financial services industry?
At the very least, before placing a trade, you should have an idea of what makes that particular stock or bond or ETF or whatever go up and down.
That’s just the tip of the iceberg — so if you can’t figure that out, it’s time to head back to the drawing board.
That brings us to…
……read 2-3-4 HERE

My U.S. stock market scenario is playing out almost to a tee (that always worries me-lol). I felt it could last at least through the 1st quarter and even the first half of 2013. The perma-bears are even suggesting it can rally (they never actually say they were wrong – why I do is beyond me-lol). But remember, my belief has been (and still is) this will not lead to “Happy Days Are Here Again” but instead a horrific long-term bear market and the worse economic, political, social and spiritual period in the history of the U.S. Wall Street is more evil then ever!
I urge you to consider the work of Michael Pento. You can sign up for his free weekly podcasts at his website.
Sell bonds, buy peace of mind.
……more from Grandich HERE
Ed Note: For some perspective on the long-term performance of the stock market, today’s chart presents the Dow priced in another global currency — gold (i.e. the Dow / gold ratio). For example, it currently takes less than a mere 8.5 ounces of gold to ‘buy the Dow’ which is considerably less than the 44.8 ounces it took back in 1999. Priced in gold, the Dow has been in a massive 13-year bear market. The Dow priced in gold paints an entirely different picture than that of the Dow based on the US dollar (which continues to trade near post-financial crisis rally highs). On a positive note, the Dow priced in gold has just broken above resistance of its latest downtrend channel.


The continuing short term stock market spurt triggered by better than expected fourth quarter results has provided an opportunity to take profits on strength on a wide variety of seasonal trades (e.g. agriculture, technology, semiconductors, biotech) and to rotate into other sectors that have a history of outperformance during the January to April period (e.g. energy, platinum, copper).
History shows that U.S. equity markets in the year after a Presidential election move higher into the first week in February in conjunction with fourth quarter reports, weaken thereafter until the end of March and moves higher thereafter. Given political events scheduled in the U.S. during the next two months, history is repeating.
Equity Trends
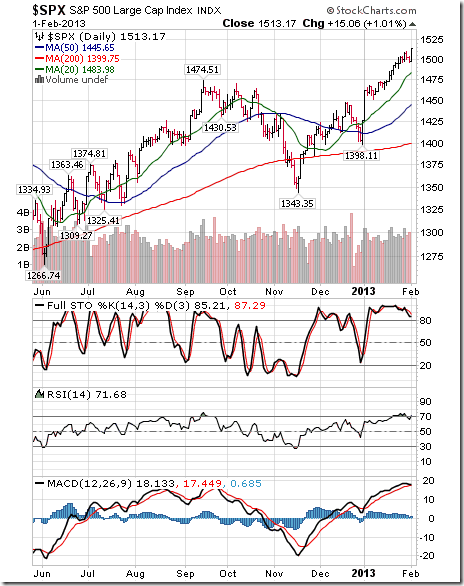
The S&P 500 Index gained 10.21 points (0.68%) last week. Intermediate trend is up. The Index remains above its 20, 50 and 200 day moving averages. Short term momentum indicators remain overbought and showing early signs of rolling over.
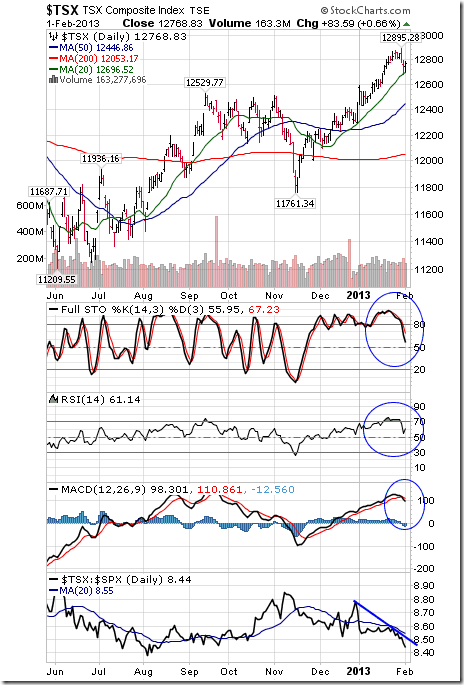
The TSX Composite Index eased 47.20 points (0.37%) last week. Intermediate trend is up. The Index remains above its 20, 50 and 200 day moving averages. Short term momentum indicators have rolled over from overbought levels. Strength relative to the S&P 500 Index remains negative. The Index has a history of outperforming the S&P 500 Index between now and the first week in March.
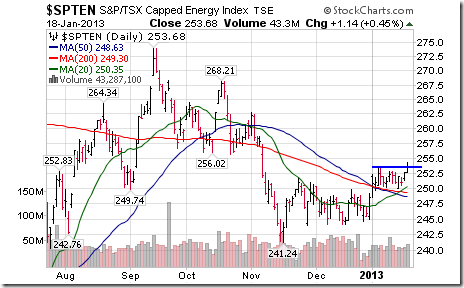
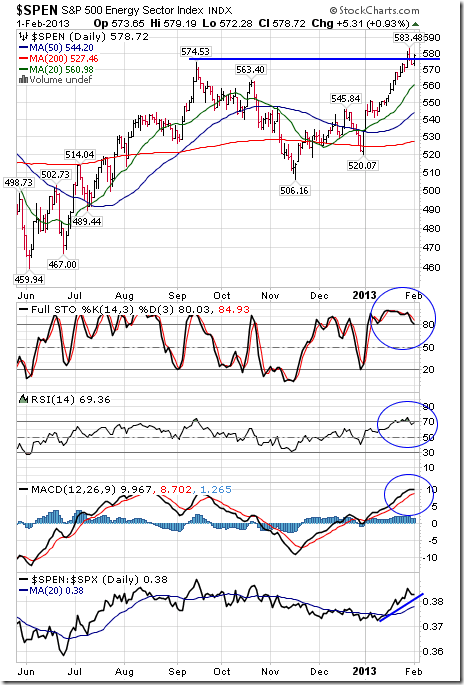
The S&P Energy Index gained another 5.46 points (0.95%) last week. The Index broke above resistance at 574.53. The Index remains above its 20, 50 and 200 day moving averages. Strength relative to the S&P 500 Index remains positive. Short term momentum indicators remain overbought.
Platinum slipped $4.30 per ounce (0.25%) last week. Intermediate trend is up. Strength relative to gold remains positive.
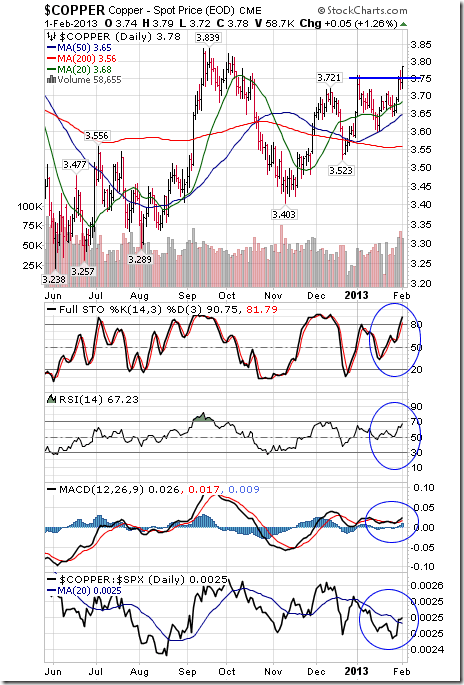
Copper gained $0.13 per lb (3.56%) last week. Intermediate uptrend was confirmed on a break above $3.76. Copper remains above its 20, 50 and 200 day moving averages. Strength relative to the S&P 500 Index changed from negative to at least neutral. Short term momentum indicators are overbought.
……go HERE for agriculture, technology, semiconductor, biotech and 45 Charts & Analysis on Don’s Super Sized Monday Report HERE
Panic The Dow Jones Industrial Average
 “As of (wednesday), the Dow has been up 12 out of 14 sessions. The market is either close to exhaustion or the short sellers are near panic. The shorts must be thinking at this point that this market is never going to go down. With that brand of thinking, the shorts must be near panic.”
The 89 year old Russell also observed: “You know, America is different from most Asian nations in that America has little use for older people. For instance, in China, older people are revered. Though older people may lack “hipness” and technical knowledge, they make up for their ignorance with wisdom.
I look back and I have seen and talked to Billie Holiday, Marlon Brando, Marilyn Monroe, and Janis Joplin. I have seen, combined, what few other living people have seen. I’ve seen the rotting fruit in California during the Great Depression, I’ve seen the planes dropping bombs over Europe, I saw the parade through New York when people opened their windows and shouted “Hooray for Happy Hoover.” I’ve seen and gone through a lot, and as a result I believe I do have a small portion of wisdom and a good memory.” – Richard Russell Dow Theory Letters (Russell was a Bombardier in WW11 -Ed)
Key Charts, Propaganda, Gold, Silver & The Ongoing Collapse
by Egon von Greyerz, founder of Matterhorn Asset Management
This Swiss master sent King World News “two tremendous charts and gave one of his most powerful interviews ever”.
A few weeks into the New Year, investors seem to be in a carefree mood. The traditional measures of volatility remain at extremely low levels. After all, the European economic crisis has calmed, budget negotiations in Washington aren’t front page news at the moment, and earnings season is unfurling without much drama (except for Apple’s (AAPL) sobering near-term outlook).
How little volatility is there in the market? The Volatility Index (VIX), which uses options trading activity as a gauge of investor fear, is at its lowest level in two years:

….read more HERE

-
I know Mike is a very solid investor and respect his opinions very much. So if he says pay attention to this or that - I will.
~ Dale G.
-
I've started managing my own investments so view Michael's site as a one-stop shop from which to get information and perspectives.
~ Dave E.
-
Michael offers easy reading, honest, common sense information that anyone can use in a practical manner.
~ der_al.
-
A sane voice in a scrambled investment world.
~ Ed R.
Inside Edge Pro Contributors

Greg Weldon

Josef Schachter

Tyler Bollhorn

Ryan Irvine

Paul Beattie

Martin Straith

Patrick Ceresna

Mark Leibovit

James Thorne

Victor Adair