Gold stocks, especially juniors, have been undervalued for longer than most investors thought possible. The result is what David Skarica, founder of Addicted to Profits,calls a “maximum pessimism trade.” In this interview with The Gold Report, Skarica summarizes his analytical tools and provides clear examples of companies that meet his criteria as “screaming buys.” Gold junior investors might feel as if they live in the movie “Groundhog Day,” but the undervaluation cycle will eventually be broken. Is spring just around the corner for the junior gold miners?
COMPANIES MENTIONED : AGNICO-EAGLE MINES LTD. : BARRICK GOLD CORP. : BLACK IRON INC. : CASTILLIAN RESOURCES CORP. : ELDORADO GOLD CORP. : ENDEAVOUR MINING CORP. : FORBES & MANHATTAN : NEWMONT MINING CORP. : WESTERN PACIFIC RESOURCES CORP. : YAMANA GOLD INC.
The Gold Report: In your recent newsletter, you wrote about “screaming buys” in gold stocks. Over the past couple of years, many investors have thought that gold stocks have been too cheap to pass up—and have been burned. Is this a new position for you or has your view changed?
David Skarica: Unfortunately for gold investors, historic valuations of gold stocks linked to the price of gold have remained undervalued for too long. If you look at valuation metrics of large-cap gold stocks compared to the price of gold, many of these stocks are historically at very cheap valuations and that has persisted for some time. The AMEX Gold BUGS (Basket of Unhedged Gold Stocks) Index (HUI), is trading at roughly $420–430. It broke $400 to the upside for the first time back in 2006 when gold was in the $600–700 range. That tells us where we are. In the past year, gold stocks have been undervalued by anywhere from 20–50% based on historical valuation methods. Despite the bargain prices, a rally has failed to materialize.
I have refined my message to focus more heavily on junior mining stocks because they have underperformed compared to the large caps. Juniors will fall harder and faster in a weak market even though there is value in the stocks. I, like everyone else, can learn my lessons from the market. The one thing I’ve really learned the last couple of years is when you’re trading the juniors, you need to be verydisciplined. The reason that I’m going so heavily toward juniors now is based on recent history. If you look at the rebound after the last big down market of 2008–2009, there were many juniors that had quality assets that were five-, ten- or twentybaggers. There will be companies that come through this market that will have similar performances.
TGR: Do you have a particular phase that you like—exploration, development or near-term producers? Or are there other factors?
DS: There are a lot of dynamics. If I find an exploration company that’s in the early stages yet has good management and lots of cash in the bank, I will definitely consider it.
I like the stories that have a well-defined resource or can build upon a resource. Near-term production stories often have huge upside potential. They still have execution and financial risk, but near-term producers are the ones that really can take off when the market finally turns. Near-term cash flow coming down the pipeline and the capital investment behind them make them attractive to the market. Such stories can get punished in a market downturn because there’s no news flow. They’re quietly building the mill, building the mine and, finally, when the production starts, it’s. . .wow.
An example that follows this pattern is Avion Gold Corp., a gold producer in Mali. During the financial crisis, it went to $0.05/share. We put it in the newsletter at $0.06/share and the stock went as high as $2/share. Avion was taken out by Endeavour Mining Corp. (EDV:TSX; EVR:ASX) for $0.88/share. The catalyst was production and cash flow.
TGR: Was Avion a near-term producer when you recommended it?
DS: It was on the cusp of starting production when I first discussed it. Buying near-term producers isn’t quite that easy; you still need to look at the fundamentals of the project. A different type of example is Baja Mining Corp. (BAJ:TSX; BAJFF:OTCQX), which is over budget, over budget and over budget. The company response was to dilute, dilute and dilute. As an investor, that is probably not something that you want to get involved with. My strategy is to look for projects that are relatively within budget. A lot of mine building goes somewhat over budget because capital expenditures and basic inputs have increased in price. That is even true in the emerging world, where cheaper labor is not as cheap as it was 20 years ago. Look for projects with costs under control and no delays.
I also look for companies that are takeover targets. An example is one that I own now, Castillian Resources Corp. (CT:TSX.V). Castillian has the same head geologist as Desert Sun Mining & Gems (DEZ:NYSE.MKT) and Central Sun Mining Inc. (CSM:TSX; SMC:NYSE.A), both of which were taken over by majors. To be clear, we’re talking about a $0.03/share stock with a minimal market cap. Companies of that size could have liquidity and cash concerns, but Castillian has built up a small resource of 0.5 million ounces (Moz). It is a situation where it could grow to well over 1 Moz and build a nice little project. If that works out, it has real upside.
Sometimes it is hard to understand the reason why a stock is priced the way it is. Some stocks go to $0.02/share and become $0.02 stocks that won’t rebound in the next cycle higher. But not all stocks are that way—some stocks are simply oversold. As John Templeton used to say, it’s “maximum pessimism.” In some of those cases of maximum pessimism, the stocks are going to turn around and be ten-, twenty- or thirtybaggers. We are talking mining stocks for this interview, but the same market psychology applies to many sectors right now, from solar to coal to stocks in many countries in Europe.
TGR: Because you were describing Castillian, what conditions are needed to improve the share price?
DS: Castillian has used flow-through to finance. Some of that money can be used to drill. There are three factors that are needed to help out its share price:
- Improved market conditions. A lot of financial issues can be solved just if the juniors begin to rally. Looking back to 2008–2009, there was a real V bottom in many juniors because the selling dissipated and most investors left. That set the stage for a turnaround. Overall market conditions are critical for individual companies to succeed.
- Resource increase. If there is new drilling success, it will be reflected in the share price.
- Secure financing. In the current market, it doesn’t make sense to finance at $0.03/share or $0.05/share, because it’s too dilutive. Castillian is under the Forbes & Manhattan umbrella and may be able to tap into corporate resources that other juniors cannot.
The three conditions are related, especially with improved market conditions that could create a snowball effect. With improved market conditions, then the stock goes to $0.10/share. Financing becomes easier and the company can drill. And that creates a positive feedback loop. A lot of times, you just have to wait for the market to turn around to get things moving.
TGR: When evaluating juniors, there are a lot of things that you could look at, but what are the three most important things that you must look at?
DS: I have five, and I call them the Five P’s. And I am paraphrasing from Doug Casey. I first saw him write about these back in the 1990s when I got involved in this industry. The five are:
- People. That is obvious because people do everything. You need solid management, people with a history of getting quality assets, making things work and hiring the right specialists.
- Property. You need good geological properties. You don’t want moose pasture in the middle of nowhere; you need something that can become viable and economic.
- Politics. You want to be in a stable mining country. It could be somewhere in Canada, Nevada or Mexico, which is not a stable country in other ways but is a very solid mining jurisdiction. A lot of countries in South America, especially Chile, have become solid mining jurisdictions where maybe some places in the middle of Africa haven’t.
- Phinancing. You need the ability to raise money. It could even be directors with deep pockets to do a personal loan during a tough time.
- Promotion. Although it sometimes gets a bad name, you need the ability to tell the story. Consider a tree that falls in the forest. If nobody tells the story, then you’re done.
TGR: Your analysis includes considering the Five P’s and looking for “maximum pessimism.” Do you have other companies that fit that model?
DS: Western Pacific Resources Corp. (WRP:TSX.V) is one. It is an exploration company with a mine from Pegasus Gold Inc. in Idaho. The company has solid management. The property has excellent infrastructure and Idaho is a politically safe location. In terms of financing, Western Pacific has $2 million (M) in the bank. When it hit its low, $0.10–$0.11/share, it had a $3M market cap with $2M in the bank. You’re getting everything else in the company thrown in for free. Even after it rebounded to $0.20/share, the market cap was still only $6M. I would call that stock an exploration company even though its flagship property is a past producer. Like many other stocks I watch, it will rise with the overall market. A typical recent pricing pattern for junior stocks would be to go from $0.80/share to $0.20/share in this weak overall market. But when this market turns around, many of those stocks will rise back into the $0.50–0.60/share range. That would be an example of the maximum pessimism trade.
A similar pattern might fit to another stock I like, which is also under the Forbes & Manhattan group. That one is an iron ore project called Black Iron Inc. (BKI:TSX.V), which is located in the Ukraine. This project will be a massive producer starting in Q4/15. However, at the moment, it is in the “quiet stage” prior to production as the mine and mill are being built. The stock has fallen with the rest of the market. At this point, Black Iron is a $45M market cap, with a potential 16-to-20-year mine life. The infrastructure and the properties are fantastic.
TGR: You like gold, but iron ore is a very different commodity. Does it concern you to pursue a commodity like iron ore that is linked to a healthy economy and financial system? In some ways, isn’t the iron trade the opposite of the gold trade?
DS: One of my best-performing deals was a company called Consolidated Thompson Iron Mines Ltd. (CLM:TSX), which I bought between $1 and $2/share. I sold around $10/share. It eventually got taken over for roughly $15/share. That was an iron ore deal. People tend to forget that something like Diamond Fields wasn’t diamonds; it was nickel.
You have to get back to your belief system in this situation. I like to consider the macro trends, the kind of the things that Jim Rogers talks about and I’ve talked about in my book, “The Great Super Cycle,” where we are in an inflationary stage. The last year or two we haven’t seen a huge move up in commodities, which are digesting huge gains from the last 10 years and especially from the 2008 lows through 2011. It’s perfectly normal to see one-, two- or three-year consolidations on these macro moves higher. I believe we’re in a re-inflation cycle. Things we need, like energy, are going to go up in price. And things we want but don’t need, like flat-screen TVs and cell phones, are going to go down in price. Japan is now joining the money-printing fray, and that should put more pressure for higher commodity prices. It’s the old monetarist arguments by Milton Friedman—too much money chasing too few goods is inflationary. You’re going to continue to see all commodities increase because of that.
I’m a little more bullish on parts of the global economy in the short to intermediate term. Longer term, I feel as if the U.S. is going to have a debt crisis, similar to what happened in the European countries. Most of the economic indicators in Europe, at least in the short term, are positive. Probably in H1/13 we should see a short- to intermediate-term bottom in the Italian, Spanish, Portuguese and Greek economies. Markets may be already discounting that bottom. Interestingly, no one talks about the potential for those markets to recover. From a technical point of view, those markets are looking attractive as they build a base.
TGR: That’s your maximum pessimism trade applied to a set of countries?
DS: The PIGS (Portugal, Italy, Greece and Spain) were the maximum pessimism trade for last year, and they have stabilized. Recent indicators out of China show that China is beginning to stabilize from its slowdown. Similar things appear to be happening in India. My thesis is that the rebound in Europe and China will drag U.S. markets higher.
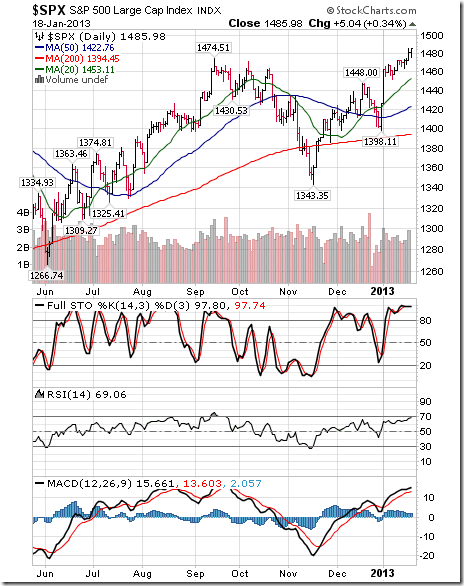
That same macro analysis can be applied to make a bullish case for precious metals stocks. Recently, the chart of the HUI is not similar to the Standard & Poor’s 500. The HUI is more similar to Italy, Spain or the emerging Asian markets. The gold stocks are behaving as risk-on trades, as have these markets. If the emerging markets are showing signs of stabilizing and climbing, so will the gold and precious metals stocks.
Another index to watch because of positive macros is the S&P/TSX Venture Composite Index (CDNX), which is building a great base. It has a range from $1,120 on the downside to $1,350 on the upside. It’s right in the middle of that range now. The chart appears to be an example of a classic bottoming base. The big money printing that we saw in the U.S. after the 2008–2009 financial crisis is detrimental in the long term. But in the short term, it does boost the economy and I think we are seeing that in Europe. That will stabilize the rest of the world in the short term. Long term, it will have inflationary consequences.

I am a bit of a contrarian on Europe—I’m not as bearish as many. The simple reason is that the European countries are doing some excellent things to modernize the regional economies. In many parts of Europe the economies are 20 years behind Germany. Germany modernized after the fall of the Berlin Wall and went into a production-based, efficiency-based economy. It may not apply to all areas, but the Germans are opposing free market restrictions and want the Spanish and the Italians to do the same. Italy has a large industrial base, so it could probably pull it off. Spain is a little more of an unknown. With austerity, the Europeans are addressing some of the problems of bloated government. There is short-term pain for long-term gain, and that has been something that Americans have not been willing to address. We keep hearing this thing about the fiscal cliff. The fiscal cliff wasn’t a one-day event on Jan. 1, 2013; it’s a permanent condition. At some point, we have to solve these trillion dollar deficits.
Coming back to gold and precious metals, there is flight away from risk assets into bonds and the U.S. dollar. If there is real growth in Europe, the next crisis could be a run on the dollar. All these crises have seen gold stocks fall with the market, but what we could see in the next crisis is the gold stocks rise while the S&P flounders. Again, that’s two to three years off. The next couple of years are the transition period. The U.S. has really led in the last couple of years during this European crisis and Europe will now probably outperform; the dollar will weaken, and that’s another positive factor for gold.
TGR: Are there any other particular stocks that you watch that fit the maximum pessimism trade?
DS: I think that what has happened in Newmont Mining Corp. (NEM:NYSE) and Barrick Gold Corp. (ABX:TSX; ABX:NYSE) is interesting. It’s similar to what happened in Agnico-Eagle Mines Ltd. (AEM:TSX; AEM:NYSE) in late 2011 when it essentially threw the baby out with the bath water. Agnico had bad earnings; it downgraded the resource on one of its mines and wrote off a bunch of assets. It downgraded future production, future profits, etc. Agnico has performed well since then. It bottomed at roughly $30/share and rallied to the mid- to high $50s, and it’s about $50/share right now. If you look at Barrick and Newmont’s Q4/12 earnings, they did the same thing—wrote off assets, wrote off resources, wrote off future profits. Both of those companies had minor warnings last year, but what they decided to do is throw everything out. Now the expectations are very low. Both Newmont and Barrick trade at ridiculously low valuations. Barrick has a forward price/earnings ratio of 6 or 7, which for the whole mining sector is unheard of. Newmont has a dividend linked to the price of gold. There are many reasons to like each of these companies. Now that expectations are so artificially low, which the companies themselves created, there is a solid base for stock performance in the future.


Another producer I like is Eldorado Gold Corp. (ELD:TSX; EGO:NYSE). Eldorado is in a similar position to where Yamana Gold Inc. (YRI:TSX; AUY:NYSE; YAU:LSE) was a few years ago when Yamana was expanding rapidly and issued stock to fund that expansion and mine building. Eventually, the production and profit show up in the bottom line. As a result of that well-timed expansion, Yamana has held up much better than the rest of the mining sector. That is where Eldorado is right now. From a valuation perspective, those are my three top picks of the senior gold producers.
TGR: In The Gold Report interview in February 2011, when gold was at $1,355/ounce (oz), you said, “I think that after the next rally we’re going to see a significant pullback in gold probably in the 2012–2013 period, but that will just be a buying opportunity.” So two years ago, it looks as if you pretty much nailed it. Do you have an update to that forecast or the next forecast to layer on top of that?
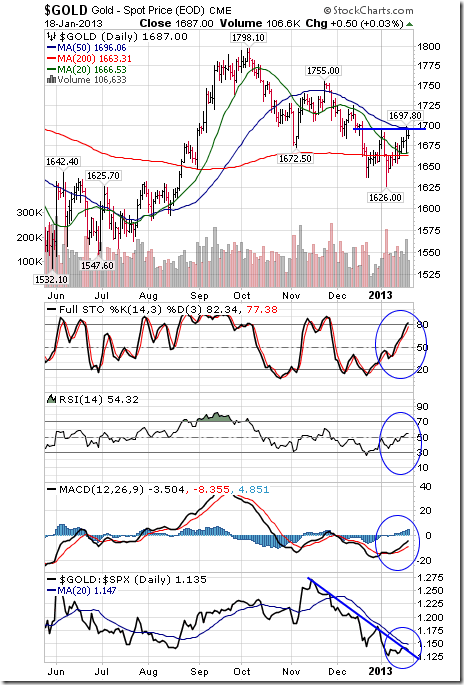
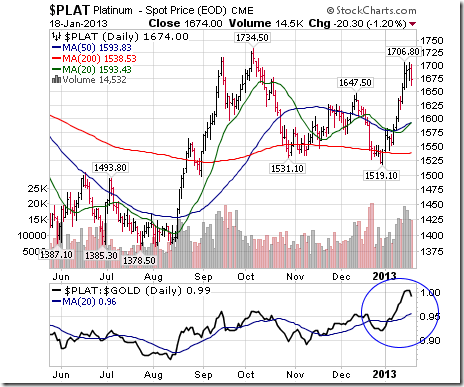
DS: From a technical perspective, in mid-2011, we had a big spike in gold prices over $1,900/oz. We are now in the second longest consolidation of the gold bull market. The only one that was longer was the 2004–2005 consolidation, and that was longer by only a couple of months. Technically, a spike high followed by a sideways trading range that builds the base between $1,530/oz and $1,650/oz is a positive development. As the saying goes, “The longer the base, the more the space.” It could also be called a “coiled spring.” The longer we trade sideways, the bigger the break out should be. I don’t anticipate new lows. It appears that we are nearing the end of the base and, though I don’t want to sound like an out and out goldbug, I believe the breakout will be huge when it happens.
One driver of the breakout, which no one is really talking about, is what’s going on in Japan. Japan has now decided to devalue and print for the first time in 20 years. It is going to print more money than the U.S. and Europe combined, even though it is a much smaller economy. That third nation of money printing—counting the Eurozone and the European Central Bank as one nation—is going to be phenomenal for the price of gold. Now you just have to be patient. I don’t know if this breakout is going to start in March, June, September or December, but I really think that 2013 will be the year that we will break out. If you’re looking at a price target, I’ll just use the easy price target of $2,000/oz by the end of the year.
TGR: Fair enough. I hope your forecast for the next year works out. We look forward to checking in with you again.
In 1998, David Skarica started Addicted to Profits, a newsletter focused on technical analysis and the psychology of markets. From 2001 to 2003, Stockfocus.com ranked Addicted to Profits third out of over 300 newsletters for performance. He is also the editor of Gold Stock Adviser and The International Contrarian, which focus on gold and global investing. Skarica has also been a contributing editor toCanadian MoneySaver and Investor’s Digest of Canada.
Want to read more Gold Report interviews like this? Sign up for our free e-newsletter, and you’ll learn when new articles have been published. To see a list of recent interviews with industry analysts and commentators, visit our Streetwise Interviews page.
DISCLOSURE:
1) Alec Gimurtu of The Gold Report conducted this interview. He personally and/or his family own shares of the following companies mentioned in this interview: Yamana Gold Inc. and Eldorado Gold Corp.
2) The following companies mentioned in the interview are sponsors of The Gold Report: Forbes & Manhattan Inc. and Western Pacific Resources Corp. Streetwise Reports does not accept stock in exchange for services. Interviews are edited for clarity.
3) David Skarica: I personally and/or my family own shares of the following companies mentioned in this interview: Agnico-Eagle Mines Ltd., Castillian Resources Corp., Western Pacific Resources Corp., Eldorado Gold Corp. I personally and/or my family am paid by the following companies mentioned in this interview: Western Pacific Resources Corp. I was not paid by Streetwise Reports for participating in this interview.

 Well, the folks in Washington D.C. certainly did another number on investment markets with a slightly- later-than-eleventh-hour “fiscal cliff fluff deal” that does nothing to address a life-threatening spending addiction by the US federal government. And now we get to listen to endless yammering about raising the debt ceiling.