
Stocks & Equities
 Since Warren Buffett bought his first stock at the age of 12 and started his first partnership in his early 20s, for over half a century he rarely considered buying foreign stocks. In the wake of 9/11, the Federal Reserve made dramatic interest rate cuts and easy money was dumped into the financial system. The U.S. was experiencing ever-expanding trade deficits. Buffett was deeply concerned with the value of the U.S. dollar and U.S. assets. He believed the U.S. dollar would lose value.
By 2002, Berkshire Hathaway (BRK.A)(BRK.B)’s cash position had increased to about $40 billion. Buffett found very few attractive stocks to buy in the U.S. Together with the view that the U.S. dollar would decline in value, he was looking for investment ideas in foreign countries. He made his first serious investment in foreign stocks – PetroChina (PTR).
The U.S. was in recession back then, and oil was traded around $20 a barrel. PetroChina ADS was traded around $15 a share. For about $500 million, Buffett bought 13.3% of the company.
Why did Buffett buy PetroChina? The reason was simple: It was cheap, very cheap! At the time, PetroChina was earning about $5 per ADS, and paying out more than $2 per ADS in dividend. Therefore Buffett bought the stock at about three times earnings with a dividend yield of more than 10%. Buffett held the position for less than five years, netting $3 billion for Berkshire Hathaway.
We want to point out that for the period that Buffett held PetroChina, the Chinese currency increased value against U.S. dollar by about 10%. Therefore, Berkshire benefited not only from finding a cheap stock in the international market, but also from Buffett’s view on the U.S. dollar.
Still struggling with too much cash on his hands and no attractive stocks in the U.S., Buffett was looking for a market that was overlooked and undervalued. He found it in Korea. According to “Snowball,” his biography by Alice Shroeder, one day in 2004, he got a book the size of several telephone directories stapled together. Its pages contained lists of Korea stocks. Buffett sifted through these pages in the old fashioned way, just as he went through Moody’s manual in his 20s. He narrowed the list to a workable number and studied more until finally, he arrived at a much shorter list which could fit on one page of legal-size paper. He said:
“It’s like finding a new girl to me… These are good companies, and yet they’re cheap. The stocks have gotten cheaper than five years ago, yet the businesses are more valuable. Half of the companies have names that sound like a porno movie. They make basic products, like steel and cement and flour and electricity, which people will still be buying in ten years… Here’s another one, a dairy. I could end up with nothing but a bunch of Korean securities in my personal portfolio.”
Regarding risk, he said:
“Now, I’m no expert on foreign currencies. But I’m comfortable owning these securities denominated in the Won right now… When you invest, you have to take some risk. The future is always uncertain. I think a group of these stocks will do very well for several years. Some of them may not do well, but as a group, they should do very well. I could end up owning them for several years.”
In 2006 Buffett spent $768 million and bought 5.1% of Posco (PKX), the Korean steel maker, and he still owns this position. His profit on this position is 70%. Regarding Posco, Buffett said, “It’s a great company. And great companies get worth more and more all the time.”
In October 2007, right at the recent peak of the stock market, Buffett visited Korea and said that the Korean market was modestly cheaper than most markets around the world. He said, “…but I am just looking at price earnings ratios, and you have a flourishing economy here with 50 plus million people that seem to be working very hard. So I would think that the Korean market would do as well over the next 10 years … not 10 weeks, 10 months … but 10 years, as most markets, and perhaps a little better.”
Buffett then became more aggressive with international investing. This time it was Europe. He bought into UK retail giant Tesco (TSCDY) in 2006, and regularly acquired more shares. Eventually he accumulated 3.6% of the company for the total cost of $1.7 billion.
He was certainly finding a lot of elephants with his “elephant gun” in Europe. He bought French pharmaceutical giant Sanofi-Aventis (SNY) in 2011 and spent more than $2.8 billion to get 10.5% of Munich Re, and this was after he injected 3 billion Swiss Francs into Swiss Re.
What lessons can we learn from this? As value investors, we need to have a global view when looking for bargains. We should not only look at the market we are familiar with, but also other markets, where greater bargains might be found. Don’t we all wish that we could find companies that are traded at three times earnings and paying more than 10% in dividends, like PetroChina in 2002?
Other than the difficulty of leaving one’s comfort zone, the data on international companies is harder to get. A book of the size of several telephone directories containing foreign stocks is not available to most investors, even if they are willing to do the hard work.
Considering this, GuruFocus has made available the complete financial data for the international stock market. We are working hard to make all GuruFocus screeners, strategies and valuation tools work for international markets. With these tools, you will be able to screen the most attractive stocks in international markets with our All-In-One Stock Screener. You will be able to filter net-netin Japanese market, construct a Buffett-Munger portfolio from the stocks that are traded on European markets, for instances. Our Fair Value Calculator, Warning Signs, etc., will also work for stocks traded in international markets.
We will release the features for these markets in the coming months. The first market to be released is the Canadian market. Stay tuned.
All these features and data will only be available to GuruFocus Paid Members. GuruFocus will release a global membership covering international stock markets.
If you are not a Premium Member, we invite you for a 7-day Free Trial.

For some perspective on the current state of the stock market, today’s chart presents the long-term trend of the Russell 2000 (small-cap stocks). As the chart illustrates, the Russell 2000 rallied from late 2002 into the mid-2007 and then effectively gave all of that back during the financial crisis. The seesaw continued during the immediate aftermath of the financial crisis with the Russell 2000 recovering all losses incurred during the financial crisis in a little over two years. Since mid-2011, the Russell 2000 has traded in a rather choppy fashion which has helped define its current wedge-shaped trading range (see the red and green trendlines). More recently, the Russell 2000 has started the new year in a positive fashion by both breaking above resistance (red line) and making a new record high.
Notes:
Where’s the Dow headed? The answer may surprise you. Find out right now with the exclusive & Barron’s recommended charts of Chart of the Day Plus.
Quote of the Day
“I can’t change the direction of the wind, but I can adjust my sails to always reach my destination.” – Jimmy Dean
Events of the Day
January 13, 2013 – Golden Globe Awards
January 14, 2013 – Australian Open Tennis Tournament begins (ends Jan. 27th)
January 21, 2013 – Martin Luther King Jr. Day (observed)
Stocks of the Day
— Find out which stocks investors are focused on with the most active stocks today.
— Which stocks are making big money? Find out with the biggest stock gainers today.
— What are the largest companies? Find out with the largest companies by market cap.
— Which stocks are the biggest dividend payers? Find out with the highest dividend paying stocks.
— You can also quickly review the performance, dividend yield and market capitalization for each of the Dow Jones Industrial Average Companies as well as for each of the S&P 500 Companies.
Passing of the Fiscal Cliff issue reduced a major uncertainty in equity markets and equity prices responded accordingly.Political issues impacting equity markets likely will calm down between now and Inauguration Day. Thereafter, major issues including tax reform, the end of sequestration and the debt ceiling raise their “ugly heads”. The Fiscal Cliff resolved some of the easy political issues. Now, the hard part of political compromise begins and it will not be pretty.
Fourth quarter earnings reports start to become a focus this week. Reports start to trickle in. Consensus is an increase on a year-over-year basis of 6.0% for S&P 500 companies and a 3.0% increase for the Dow Jones Industrial Average companies. CEOs of major companies like to give good news to shareholders when they release fourth quarter and annual results (share splits, share buy backs, etc.) as well as an encouraging outlook for the following year. However, given the current state of political instability in the U.S., outlook comments may be less favourable this year. Traders will watch closely to reactions to these reports.
Beyond the political crisis during the next three months, equity market prospects are much more attractive assuming a reasonable political settlement is reached. Corporation on both sides of the border continue to hold large cash positions and are waiting for political stability before making major commitment to capital spending.
An added positive factor for equity markets beyond the first quarter of 2013 is news from the Federal Reserve that $85 billion asset purchases by the Fed may end before the end of 2013. The news quickly pressured Treasury prices and raised the likelihood that long term Treasury prices have passed their peak. A downtrend in bond prices as the year progresses will prompt investors to switch from bonds to equities. Following is a link to a report released on www.cnbc.com over the weekend entitled, “Why Goldman thinks you should dump bonds now”. http://www.cnbc.com/id/100355153
History shows that the weakest three month period for U.S. equity market is the three month period in the year after a U.S. president is elected. This the period when the President tries to implement the most difficult programs promised prior to the election. History is repeating.
Technical analysts are warning about a possible significant correction in the first quarter. Following is a link to a comment released late Thursday by Mary Ann Bartels, Merrill Lynch’s technical analyst: http://www.cnbc.com/id/100353125
Economic reports this will have limited impact on the market.
Short and medium term technical indicators for most equity market and sector indices show that prices currently are intermediate overbought, but have yet to show signs of peaking.
Santa Claus was generous this year to investors who held during the December 15th to January 6th classic Santa Claus rally period. However, Santa Claus exited the scene on Friday.
Sectors with positive seasonality at this time of year continue to outperform the S&P 500 Index and the TSX Composite Indexincluding Agriculture, Forest Product equities, Industrials, Semiconductors, Biotech, Europe, Copper and Base Metals. However, most of these sectors reach a short term peak in the first half of January. Sector rotation became apparent late last week when new sectors such as energy began to show outperformance for the first time in months.
The Bottom Line
The “hoped for” short term stock market spurt triggered by a favourable resolution of the Fiscal Cliff has provided an opportunity to take profits on strength on a wide variety of seasonal trades (e.g. agriculture, technology, semiconductors, biotech) and to rotate into other sectors that have a history of outperformance during the January to April period (e.g. energy, platinum, copper).
Special Free Services available through www.equityclock.com
Equityclock.com is offering free access to a data base showing seasonal studies on individual stocks and sectors. The data base holds seasonality studies on over 1000 big and moderate cap securities and indices.
To login, simply go to http://www.equityclock.com/charts/
Following is an example:
Ten year seasonality study on the TSX Energy Index

…….see 45 more charts and analysis on Don’s Monday Report HERE

Wednesday’s gap higher in stocks has many investors feeling really good about but will this rally last?
My to the point answer is “Yes” but there will be some bumps and navigating positions along the way.
Looking at the charts below you will notice how stocks are trading up over 4% in two trading sessions and several indicators and technical resistance levels are now being tested. Naturally when several resistance levels across multiple time frames, cycles and indicators we must be open to the idea that stocks could pause or pullback for a few days before continuing higher.
Here is a quick snapshot of charts I follow closely to help determine short term overbought and oversold market conditions.
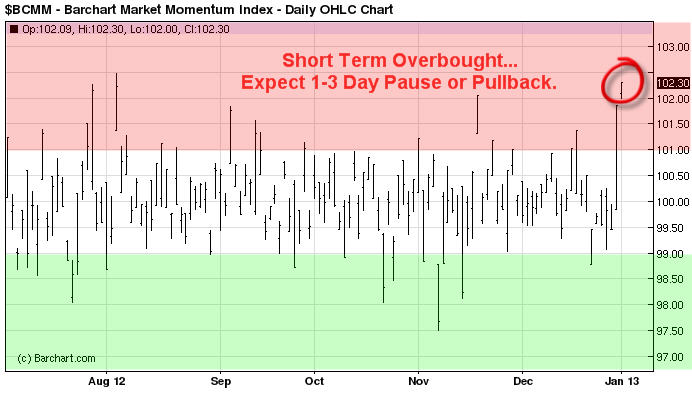
Momentum Extremes:
This chart helps me know when stocks are overbought or oversold. This trend can be follows using the 30 or 60 minute charts helping you spot short term tops and bottoms.
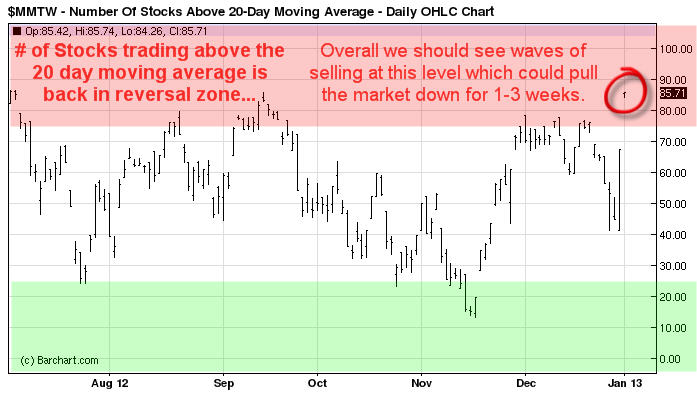
Stocks Trading Above 20 Day Moving Average:
This chart helps me time swing trades which last for 1-3 weeks in length and I use the daily chart to spot these reversals and trends.
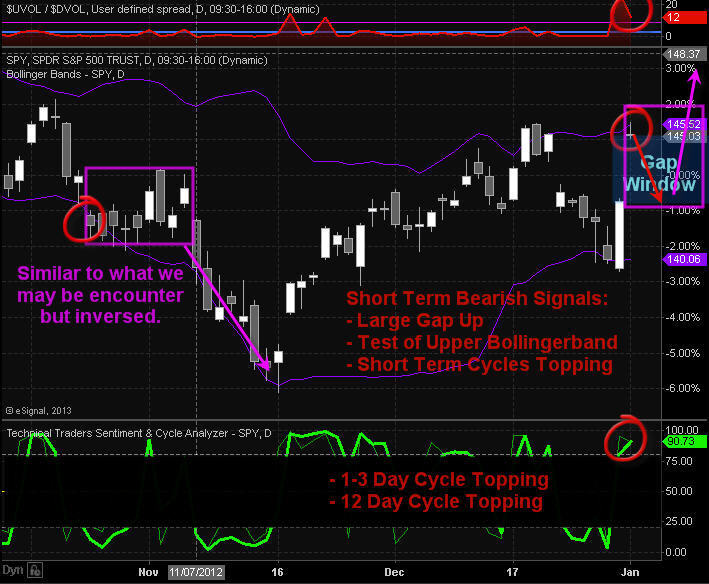
Daily SP500 Index Chart:
This chart shows the big gap in price, test of upper bollingerband, momentum and swing trading cycles topping and 12 buyers to ever one seller on the NYSE which tells me everyone is running to buy everything they can today and that is a contrarian signal.
Trading Conclusion:
This strong bounce which started on Monday from a very oversold market condition does look as though it has some power behind it. And over the next 1-3 days we could see prices grind higher until this momentum stalls out. Once that happens we should see most of the gap filled. This will provide us with a lower entry price and reduce our downside risk for index, sector and commodity ETFs.
If you are a stock trader then be sure to checkout my partners stock trading websitewww.ActiveTradingPartners.com where his last two trades Dec 31 pocketed 12.3% with gold stocks ETF NUGT, and took more profits with PRLB Jan 2nd for a 9.2% gain.
This type of bounce and momentum can lead to a running correction which makes it impossible for traders to by on a dip. A running correction is when prices slow chop higher in a narrow range for some time then explode higher continuing its rally. This is when you just need to jump in trades and chase prices higher but we will not do that until I see signs of a running correction.
Today many of the major market moving stocks are testing resistance which means if they start to get sold the broad market will pullback with them.
Follow All My Trades for 2013 – Start Today and Get 12 Months for only 6 Months: http://www.thegoldandoilguy.com/signup-newyear.php
Chris Vermeulen
Disclaimer:
I currently do not own a position in these investment but plan on buying them in the near future. This material should not be considered investment advice. Chris Vermeulen is not a registered investment advisor. Under no circumstances should any content from this website, article, video, seminar or email from Chris Vermeulen (TheGoldAndOilGuy.com) be used or interpreted as a recommendation to buy or sell any type of security or commodity contract. This material is not a solicitation for a trading approach to financial markets. Any investment decisions must in all cases be made by the reader or by his or her registered investment advisor. This information is for educational purposes only.
James Tolard is a supremely gifted commodity trader. Jim’s style is to surf the big trends, trading just a few times a year. He lives in a rural area outside of Paris, but we’ve coaxed him out of semi-retirement to write occasionally on an eclectic range of subjects suited to his deep intellect, worldliness and wit. This time, he is sharply at odds with our own, very bearish outlook for 2013. We have no qualms about sharing his thoughts with you, however, because Jim’s against-the-grain instincts have been right far more often than our own. RA]
One of the things that baffled me all summer, and into the stench of the campaign finale, was the supposedly odd “friendliness”’ of the U.S. stock market and the weakness of the dollar. I was fairly bullish on stocks going into October, for a surge to – sit down for this — Dow 20,000! But as October pulled in with a screech, and elections just a month away, I am old enough to have expected little good from either the Ides of March or those of October. So, I blushed, backed off, and decided to let the market tell me what kind of correction or sell-off it might need.

Now, contrary to all emotional expectations, we are facing the real possibility that a strong run-up may well launch in the coming weeks. So, assuming that I am going to be right, what do I use to support my arguments? First is the low borrowing rate. While the normal person or even smallish business cannot borrow 3% or less, large firms can. The banks are still re-building their reserves and doctoring their balance sheets, so they are holding onto the money very tightly like the bankers of yore, lending only to those who don’t need it. This accurately describes the condition of the largest companies and private equity firms. They can re-finance their present debt and assume debt at less than 3% to 4% — and who the hell can’t make 3%-4% in a big business today? The rush to sell commercial paper is well known to you all, so I won’t rehearse the facts: Buy low sell high. The present interest rates have many well-heeled takers, and if you have the means, I’d suggest borrowing now while the low rates lasts.
Weak-Dollar Benefits
Second reason and bullish sign: Lumber and construction are increasing, and lumber has managed to emerge from its listless two-year bottom. Meanwhile, there is plenty of money for builders and probably not so much for buyers, but that can be fixed. Third reason, and most baffling, even though I see it here: No matter how shrill the bank propaganda is about Greece, Spain, et al., the EU is in good shape on paper. Hence, the euro versus the dollar is favorable toward U.S exports . Despite all else, a lower dollar is good for U.S. business in that it is one of the factors that stimulates overseas buyers.
So, the low borrowing rates, the raw materials for construction and the weaker dollar should provide the support for a higher stock market. Also, some key U.S. stocks are leaner and more profitable than three years ago. They have plenty of retained earnings sitting in Scrooge McDuck bins in the basement. It helps that they have little competition. On the consumer side, the sheeple are in the process of growing back their heavily trimmed fleeces, but many are not yet ready to spend like they are rich. While we await their resurgence and the slow lifting of their spirits, let the band strike up a tune and cheap wine to flow.
As for Armageddon…
What about those dire predictions of an End of Days? My dear friends, there is one thing for certain: The global economy is on course for a crash that will subsume commercial institutions and traditions that have dominated all sectors of life in the West for nearly 250 years. But the U.S. and Europe are not going to turn into an economic South Sudan overnight. Rather, money and credit will continue to flow, trade to expand, and hundreds of millions of consumers brought on line. Let’s enjoy it while it lasts.
Concerning gold’s prospects in such an environment, we should note that gold has risen when the Dow rose, when the Dow fell, and when the Dow was flat. Here is my belated Christmas present, as well as a Passover gift ahead of time: If the Dow surges above 15000 or perhaps even smashes though 20000, gold will easily reach $2500. So there. I said it, my belly is sloshing with a modest St. Emilion vintage, but that clears the head rather than blighting it. Can this happen? I think so. Of course, none of this correlates with the external “mood” of the press, the politicians, and so on, but they never know in any event, do they? And, those numbers are not really that amazing. Suppose the Dow hits 20,000. That is only about 6600 points from here, a mere mis-programmed instruction in a high-speed trader’s algorithm. And gold at 2500 or more? I sold some around 1,800 just less than two years ago, and so from a current 1,700, at least, that implies a rally of just $800. No matter how odd that kind of a move might seem now, I am persuaded that it is the only real direction for the market.
And lastly, there’s all of that silly stuff about the fiscal cliff and the national debt. Forget it. Debt will continue to metastasize, big companies will hold onto their tax breaks, and the military will surrender perhaps $10 to $20 billion of a current budget of around $700 billion. Taxpayers will pay more, and everyone will declare victory. Can you understand the Tax Code? How about the effect of riders on the budget? If you can, I’d suggest that we carve your head into Mt. Rushmore, right next to Teddy Roosevelt’s.
***
[Click here for a free trial subscription to Rick’s Picks that includes access to a 24/7 chat room and ‘Harry’s Place’.]

-
I know Mike is a very solid investor and respect his opinions very much. So if he says pay attention to this or that - I will.
~ Dale G.
-
I've started managing my own investments so view Michael's site as a one-stop shop from which to get information and perspectives.
~ Dave E.
-
Michael offers easy reading, honest, common sense information that anyone can use in a practical manner.
~ der_al.
-
A sane voice in a scrambled investment world.
~ Ed R.
Inside Edge Pro Contributors

Greg Weldon

Josef Schachter

Tyler Bollhorn

Ryan Irvine

Paul Beattie

Martin Straith

Patrick Ceresna

Mark Leibovit

James Thorne

Victor Adair