
Stocks & Equities
Humans hate uncertainty. We want guarantees, we want warranties, and we want insurance policies. We want to know the future, and we want promises (preferably in writing) which assure us of that future. And yet, what else is life but a constant, ever-shifting drama of uncertainty? The irony behind our desire for certainty and security is that the very tension of uncertainty is the same psychological force that so often drives our greatest gains in personal, and societal, growth.
Our extreme discomfort with uncertainty pushes us to invent, to learn, to grow, and to try and expand our understandings. It pushes us to become better people; to become more than we are today.
Global uncertainty can make the stock market seem like it should be an unpopular place — and yet, always bumping against that global psychology and in opposition to it, there is personal uncertainty that makes the market appealing. Why do people invest in stocks? There simply is no other reason to invest,except the quest for financial security and expansion — which is really just the quest to leave uncertainty behind.
Of course, we can no more eliminate uncertainty than we can become physically immortal; uncertainty is an intrinsic part of life (and of the universe itself, even down to the quantum level). Despite the obviousness of that fact, the majority of us spend our lives fearing (and often running from) the uncertainty of the unknown, in a perpetual state of low-grade anxiety. Thoreau described this perfectly when he said: “Most men lead lives of quiet desperation.”
I believe understanding this psychology is a key to understanding the market. So often, people look at the seemingly ever-deteriorating world and say, “How can anyone buy stocks right now, with so much global uncertainty?” The problem is, this view only accounts for half the total psychology of uncertainty.
The traditional market wisdom says people buy and sell based on fear and greed. That’s true on a simplistic level — but I believe that if one looks a bit deeper, one finds that both fear and greed (in this case) stem from the exact same psychological source: the quest to overcome uncertainty and gain more security (even for people who don’t seem to “need” more security — we’re rarely satisfied at a plateau, and more security for some can equate to additional wealth/power). So we’re fearful when we’re running from it, and we’re greedy when we’re chasing it — but it all ultimately traces back to the same base desire.
This is why even when the world looks bleak and “everyone” is fearful, people are still buying stocks: At that moment, their desire to gain personal certainty/security is greater than their fear of global uncertainty.
This is one reason I think it’s a mistake to look myopically at global uncertainty when deciding whether to buy or sell for the long-term. The fact is, there’s always something going wrong with the world. And if that’s all there was to consider in the psychology, then we’d do nothing but sell stocks short. Don’t forget to consider the other side of that equation.
Speaking of uncertainty…….
…..to view the Market Update, 4 Charts & the Conclusion go HERE
Click to enlarge

Most equity markets in the world and major sectors are recovering from oversold lows set on November 16th. Selected sectors with favourable seasonal influences already are outperforming. Equity markets are set up for continuation of last week’s recovery rally that likely will last until at least Inauguration Day.
Short term momentum indicators are recovering from oversold levels and are trending up.
Currency trends could have a significant influence on equity markets this week. The U.S. Dollar virtually collapsed on Friday, but on relatively thin trading. If the fall holds early this week, it will confirm a change in momentum by the U.S. Dollar from up to down. A weaker U.S. Dollar is bullish for equity markets.
North American equity markets have a history of moving higher from U.S. Thanksgiving Day to the end of the year. A study by CNBC revealed that, on average since 1928, the Dow Jones Industrial Average has gained an average of 1.8% during this period. The trade has been profitable 80% of the time. In addition, the last week in November also has a history of outperformance by U.S. equity markets.
Europe’s decision on Greece also could be a market-mover. A decision is expected to be reached as early as today.
Economic news this week is expected to encourage equity markets (home prices, consumer confidence, Q3 GDP, Chicago PMI) with the exception of the Durable Goods Orders report
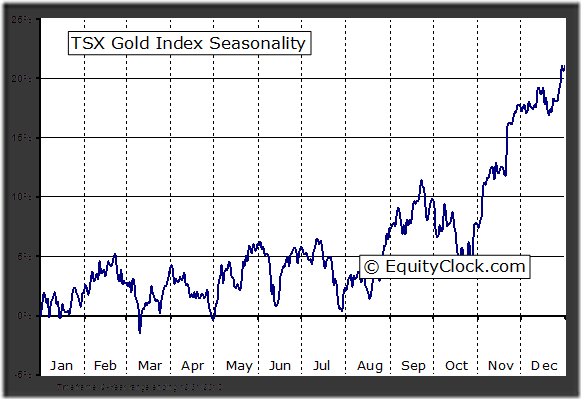
Sectors that normally show positive seasonality at this time of year continue to outperform the market including agriculture, forest products, industrials, home builders, semiconductors, biotech, China, Europe and the TSX Composite.
Every World Major Market Index Below:
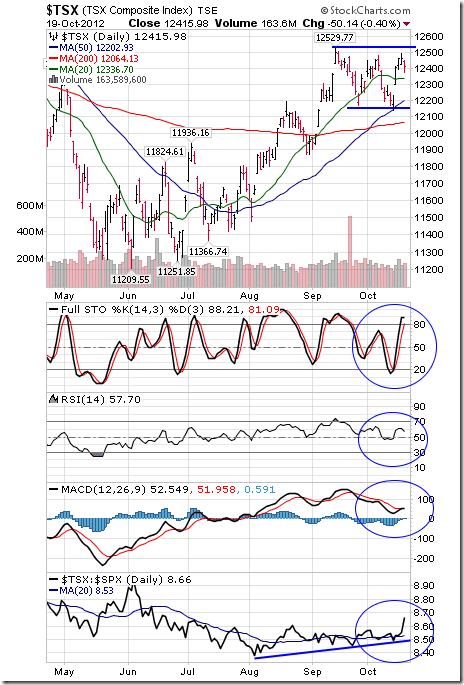
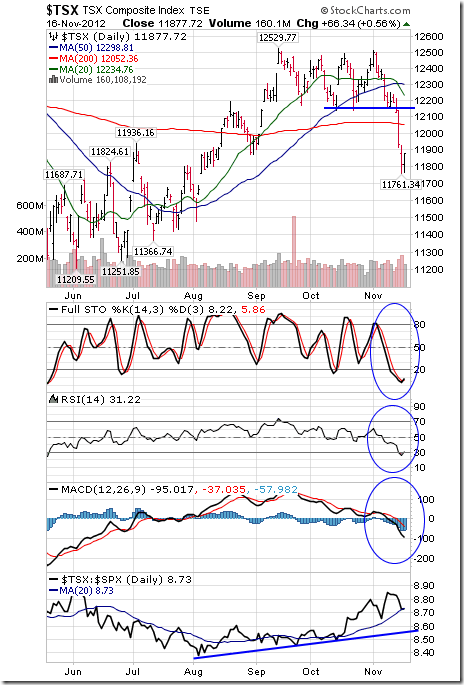
The TSX Composite Index gained 335.52 points (2.82%) last week. Intermediate trend is down. Support is forming at 11,761.34. The Index moved above its 200 day moving average and closed above its 20 day moving average on Friday. Short term momentum indicators are recovering from oversold levels. Strength relative to the S&P 500 Index has changed from positive to at least neutral.
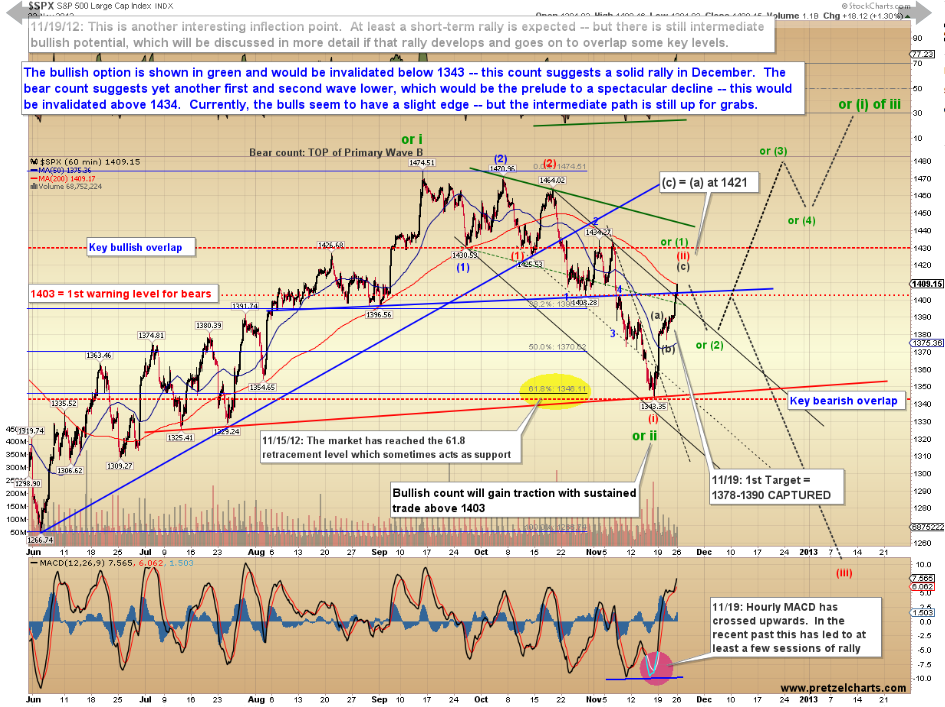
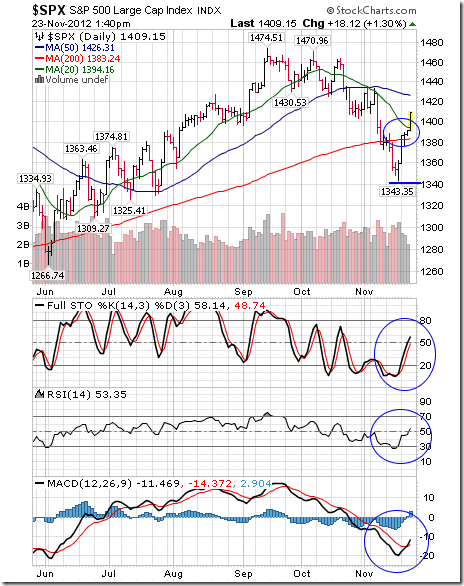
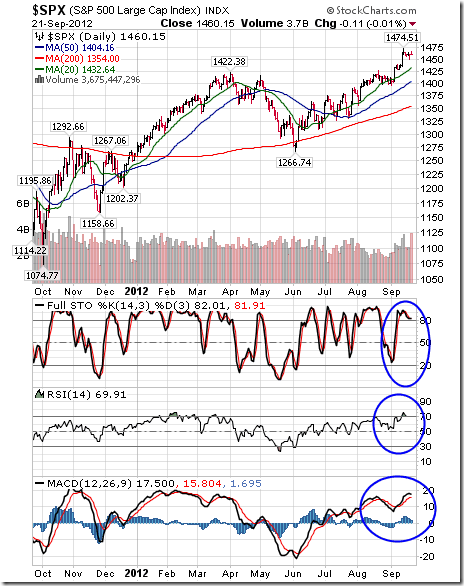
The S&P 500 Index gained 49.27 points (3.62%) last week. Intermediate trend is down. Support is forming at 1,343.35. The Index moved above its 20 and 200 day moving averages on Friday. Short term momentum indicators have recovered from oversold levels.
The Australia All Ordinaries Composite Index gained 72.32 points (1.66%) last week. Intermediate trend is up. Support is forming at 4,355.90. The Index remains above its 200 day moving average and below its 20 and 50 day moving averages. Short term momentum indicators are recovering from oversold levels. Strength relative to the S&P 500 Index has changed from positive to at least neutral.

The Nikkei Average gained 342.64 points (3.80%) last week. Intermediate trend changed from neutral to up on a break on Thursday above resistance at 9,288.53 (Japanese equity markets were closed on Friday). Short term momentum indicators are trending up. Strength relative to the S&P 500 Index remains positive.

Europe 350 iShares gained $1.93 (5.42%) last week. Intermediate trend is down. Support is forming at $35.34. Resistance is at $38.55. Units moved above their 20 and 50 day moving averages on Friday. Short term momentum indicators are recovering from oversold levels. Strength relative to the S&P 500 Index remains positive.

The Shanghai Composite Index added 0.89 (0.04%) last week. Intermediate trend is down. The Index briefly broke support at 1,999.48 before recovering. The Index remains below its 20, 50 and 200 day moving averages. Short term momentum indicators are oversold and showing early signs of bottoming. Strength relative to the S&P 500 Index changed from positive to neutral.

The Athens Index advanced 56.31 points (7.12%) last week. Intermediate trend is neutral. Support is forming at 758.03 and resistance has formed at 910.99. The Index remains above its 200 day moving average and moved above its 20 and 50 day moving averages. Short term momentum indicators are trending up. Strength relative to the S&P 500 Index remains positive.

So many more charts & comments HERE
 The Buy-and-Hold Model for understanding stock investing is the dominant model of today.
It’s easy today to explain why Buy-and-Hold can never work. The root idea is preposterous (but not obviously so to those who have not yet seen through it — there are many smart and good people who possess a strong confidence in the concept). For Buy-and-Hold to work, valuations would have to have zero effect on long-term returns. Stocks would have to be the only asset class on the face of Planet Earth of which it could be said that the price paid for the asset has no effect on the value proposition provided. This cannot be. Price must matter. And if price matters, investors should not be going with the same stock allocation at times when valuations are insanely high as they do when stocks are fairly priced or low priced. Buy-and-Hold defies common sense.
Why, then, did so many experts come to believe?
The academics responsible for the Buy-and-Hold concept discovered something of critical importance in their studies of the historical data. They learned that short-term timing does not work. That is, those who predict where stock prices will be in a year or two are no more successful than what would be expected if their predictions were random rather than informed by intelligent study of the market. This was breakthrough stuff. This changed the history of stock investing. No longer was stock investing about bulls and bears making guesses as to when to buy or sell stocks. The science of investing showed that short-term forecasting does not work and that a long-term focus is needed. The science appeared at the time to suggest that a Buy-and-Hold strategy (sticking to the same stock allocation at all times) makes sense.
The science did not prove that Buy-and-Hold works. The Greatest Mistake in the History of Personal Finance took place when the academics jumped to the hasty conclusion that the fact that short-term timing does not work necessarily leads to a conclusion that Buy-and-Hold is the only rational strategy.
There is not one possible explanation for why short-term timing does not work. There are two. The explanation adopted by Fama and the other academics was that short-term timing does not work because the market always set prices properly and it is therefore impossible for even the smartest individual investor to do a better job than the market at determining the proper price for stocks. There is an alternate explanation that offers every bit as satisfactory an explanation. It could be that the market does such a poorjob of setting prices that there is no way for even the smartest investor to make sense of what the market is going to do. It could be that the reason why short-term timing does not work is not that the market is efficient but because it is wildly inefficient. It could be that stock prices do not reflect a rational collective assessment of the true value of stocks but an almost entirely emotional assessment that signifies just about nothing meaningful about the proper price of the stock market. Irrational markets cannot be timed because irrationality cannot be predicted.
There is a way to test which of the two explanations is the right one. If the market is efficient, the concept of overvaluation is silliness. An efficient market is a market that sets prices properly. But Shiller’s 1981 research (confirmed by a mountain of research done since then) shows that overvaluation is a meaningful concept. Shiller showed that stocks offer better long-term returns starting from times of fair or low prices than they do starting from times of insanely high prices. Even many Buy-and-Hold advocates acknowledge today that valuations matter. William Bernstein says that valuations affect long-term returns as a matter of “mathematical certitude.”
The further reality is that the market must in an ultimate sense be efficient. The purpose of a market is to set prices properly. If investor emotions were the sole influence on market prices, stock prices would go to the moon and stay there; what could ever persuade investors not to vote themselves raises by pushing stock prices higher and higher and higher yet? The market must ultimately be efficient, as the academics responsible for the Buy-and-Hold concept claimed. Yet the academic research of the past three decades shows conclusively that the market is not immediately efficient. What, then, is the full reality?
The full reality appears to be that the market is gradually efficient, not immediately efficient. It is investor emotions that determine market prices in the short term. But it is economic realities that determine stock prices in the long term (after the completion of 10 years of market gyrations or so). If the stock price rises too much higher than the price justified by the economic realities, opportunities open up for competing businesses to obtain the same assets on the cheap (relative to the market price assigned to them) and thereby to create a new business with the same profit potential as the overvalued one and thereby to pull the value assigned to it by the stock market down to reasonable levels. The market does indeed insure that stocks are priced properly. But it does not do this in an instant. The process can drag out for 10 years or even a bit longer.
….read The Dominant Model for Understanding How Stock Investing Works & Rational Investing Is The Answer (scroll down)
 He manages one of the world’s largest mutual funds and he got to that position by making money. Investors should put their money into overseas stocks and closed end bond funds, said Bill Gross, founder of fund giant Pimco.
Slow growth and low yields in the United States make such venues attractive options.
“Both from the standpoint of stocks and bonds, an investor wants to go where the growth is. There are countries that should grow faster than Euroland countries, and countries that should grow faster than the United States. They would be the big obvious ones: China and Brazil, and even Mexico,” Gross told U.S News & World Report.
Looking at the broader economy, investors can get used to what Pimco describes as a “new normal,” a global economy focusing on paying down debts, which will slow growth for some time to come.
“[I]n 2008, the world was too highly levered and ever since it’s been in the process of de-levering, which means that consumers and businesses cannot take on the same amount of debt that they did in the past. Don’t think that anytime soon we’re going back to the ‘old normal’ because these cycles of de-levering are biblical in nature,” Gross said.
Inflation rates are due to creep higher as well, thanks to loose monetary policies carried out by central banks around the world, namely cuts to benchmark interest rates and liquidity injections into their respective economies.
“Slower growth and higher inflation — that’s not a positive, by any means. Individuals would want it to be just the reverse,” Gross said.
“The de-levering and the check-writing on the part of central banks, that’s really what produces the situation.”
Big banks are looking to emerging markets for growth these days, including Deutsche Bank, which wants to see pretax profits from foreign retail branches to approach 1 billion euros by 2015 to offset sluggish activity in more mature markets.
“A stagnating (European) population threatens growth opportunities in the long run. That is why retail business in emerging markets is of great significance,” Rainer Neske, head of private and business clients, told Reuters.
CANADIAN PERSPECTIVES
- To assess the potential impact of major macro drivers (such as extraordinary monetary policy in the U.S. and Europe) on Canadian inflation, PIMCO has designed proprietary Canadian inflation models.
- Inflation dynamics are highly complex, and our approach captures particular aspects of inflationary pressures in the economy to glean information about the future path of inflation.
- Our Canadian inflation modelling points to higher inflation over the coming year.
….read the whole article HERE

The Bottom Line
Most equity markets around the world and most sectors remain under significant technical pressure and signs of a bottom are tentative at best. Meanwhile, most equity markets and sectors are substantially oversold and set up for a strong recovery rally triggered partially by short covering. Favourable seasonal influences in selected sectors are apparent despite the decline by broadly based equity indices. Equity markets are setting up for a recovery rally on a Fiscal Cliff agreement that likely will last until at least Inauguration Day in the third week in January.
Other Factors
Volume in equity markets is expected to be significantly lower than average this week as the U.S. Thanksgiving holiday on Thursday approaches.
Historically, the strongest two consecutive days for stock market performance during the year are the day before U.S. Thanksgiving and a day after U.S. Thanksgiving. Average return per period for the S&P 500 Index during the past 61 years is 0.80%
Earnings reports and economic news this week are not expected to have a significant impact on equity markets.
Political focus is on the Fiscal Cliff. A meeting with the President and Congressional leaders on Friday concluded with encouraging comments about a possible agreement. However, no agreement will be reached this week. The President is in Asia and Congress is closed for the Thanksgiving holiday. The media’s count-down to the Fiscal Cliff is 43 days. However, with Congress on holidays today and on holidays in the last two weeks in December and with any agreement required to be scored by the OBC (Office of the Budget Committee), actual number of days available for negotiation is closer to 21 days.
Short term momentum indicators are deeply oversold and showed encouraging signs on Friday of bottoming.
Macro events outside of North America will impact North American equity markets. The escalating conflict between Israel and Gaza has grabbed the world’s attention. The Eurozone group of 17 nations is meeting today. The Euro summit of 27 nations will meet on Thursday and Friday.
The spending of large cash positions held by corporations on both sides of the border have started to move in a small way (e.g. Sherwin Williams purchasing a Mexican companies, several companies announcing fourth quarter ex dividend dates before the end of the year instead or early next year, share buy backs). However, most corporations are waiting for results of negotiations on the Fiscal Cliff before making major changes.
Long term seasonal influences on equity markets are positive from October 28th to May 5th.
Equity markets in the month of November have been strongest in the second half of the month.
Despite weakness in broadly based U.S. equity indices, favourable seasonal influences continue to show through (but in an unfavourable way). Sectors such as agriculture, forest products, transportation, industrials, home builders, semiconductors, China, Europe and the TSX Composite continue to outperform the S&P 500 on an intermediate basis (but by declining less than the S&P 500).
Key Indexes/Markets
The S&P 500 Index dropped 19.97 points (1.45%) last week. Intermediate trend is down. The Index remains below its 20 and 50 day moving averages and fell below its 200 day moving average. Short term momentum indicators are oversold, but have yet to show signs of bottoming.
The TSX Composite Index fell 319.08 points (2.62%) last week. Intermediate trend changed from neutral to down on a break below support at 12,137.18. The Index remains below its 20 and 50 day moving averages and fell below its 200 day moving average. Short term momentum indicators are oversold, but have yet to show signs of bottoming. Strength relative to the S&P 500 Index remains positive.
The U.S. Dollar gained another 0.23 (0.28%) last week. Intermediate trend is up. The Index remains above its 20, 50 and 200 day moving averages. Short term momentum indicators are overbought, but have yet to show signs of peaking.

Crude Oil added $1.01 per barrel (1.17%) last week. Intermediate trend is down. Support is forming at $84.05 per barrel. Crude oil moved above its 20 day moving average on Friday, but remains below its 50 and 200 day moving averages. Short term momentum indicators are recovering from oversold levels. Strength relative to the S&P 500 Index has turned positive.

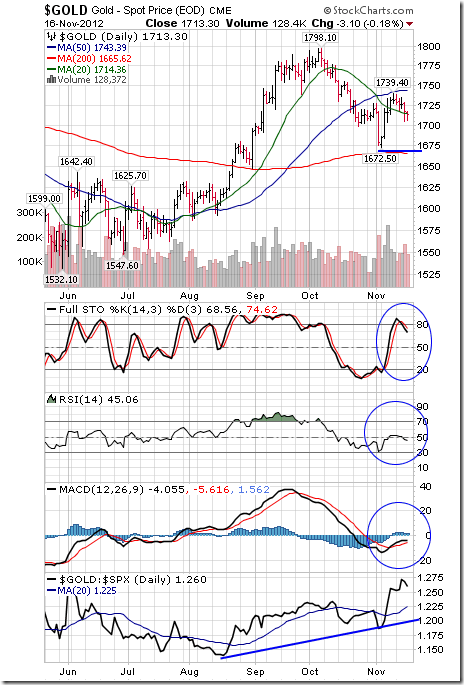
Gold slipped $17.10 per ounce (0.99%) last week, triggered by continuing strength in the U.S. Dollar Index. Intermediate trend is neutral. Support is at $1,672.50 and resistance is forming at $1,739.40. Gold remains below its 50 day moving average and fell below its 20 day moving average on Friday. Short term momentum indicators are neutral. Strength relative to the S&P 500 Index remains positive.
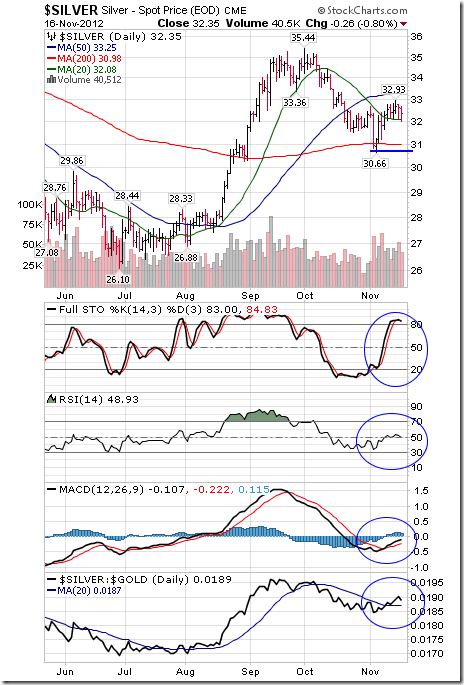
Silver slipped $0.18 (0.55%) last week. Intermediate trend is neutral. Support is at $30.66 and resistance is forming at $32.93. Silver trades above its 20 and 200 day moving averages and below its 50 day moving average. Short term momentum indicators are trending up. Strength relative to gold has turned positive.
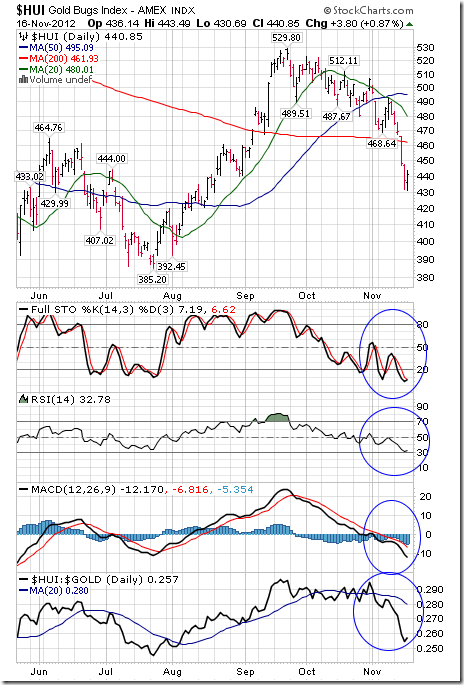
The AMEX Gold Bug Index dropped 40.36 points (8.84%) last week. Intermediate trend is down. The Index remains below its 20 and 50 day moving averages and fell below its 200 day moving average. Short term momentum indicators are oversold, but have yet to show signs of bottoming. Strength relative to gold bullion remains negative.
The TSX Metals & Mining Index dropped 44.47 points (4.66%) last week. Intermediate trend is neutral following a break below support at 910.32. The Index fell below its 20 and 50 day moving averages. Short term momentum indicators are trending down. Strength relative to the S&P 500 Index remains positive despite the loss last week. Seasonal influences start to become positive at this time of year.
…..many more charts & comments HERE on Don’s Great Monday Report

-
I know Mike is a very solid investor and respect his opinions very much. So if he says pay attention to this or that - I will.
~ Dale G.
-
I've started managing my own investments so view Michael's site as a one-stop shop from which to get information and perspectives.
~ Dave E.
-
Michael offers easy reading, honest, common sense information that anyone can use in a practical manner.
~ der_al.
-
A sane voice in a scrambled investment world.
~ Ed R.
Inside Edge Pro Contributors

Greg Weldon

Josef Schachter

Tyler Bollhorn

Ryan Irvine

Paul Beattie

Martin Straith

Patrick Ceresna

Mark Leibovit

James Thorne

Victor Adair