
Stocks & Equities
Do not let anyone tell you a savvy investor cannot make money in this market.
While it is true North American markets sold off significantly in the seven sessions directly following the U.S. election as investors again focus on the “fiscal cliff” — a series of tax hikes and spending cuts set to take effect at the start of 2013. It is our belief that the recession in Europe and slowing in China present more real challenges, but investors tend to be myopic these days and the cliff is staring them in the face.
Attention Money Talks Listeners – Exclusive Offer (Save $200-$600)
Or combine the services and save over $600!
So the Dow has fallen 5% as investors worry about higher dividend and capital gains taxes. And the TSX is off 3.9% since the election as worries about a sudden slowing of economic growth would be bad news for a resource heavy market like Toronto’s, since a lessening of demand for oil and metals would put pressure on mining and energy stocks.
But there are individual stock specific situations making us great money even with these concerns.
We are happy to report this Monday morning we awoke to excellent news from our Top Small-Cap Pick from March of this year. The Brick Ltd. (BRK:TSX), a stock we recommended in the $3.50 range just 8 short months ago, announced that they had entered into a definitive agreement to be purchased by Leon’s Furniture Limited (LNF:TSX) by way of plan of arrangement for $5.40 per share. The total consideration payable to The Brick shareholders and warrantholders is approximately $700 million.
Our return was approximately 55% in 8 months in a market (the TSX) that is down just under 3% on the year.
The lesson – the broader markets have been fairly valued for some time and are not the place to be. There is value out there and the smart money is uncovering it and we are recognizing tremendous gains in overlooked stocks. The key is to be very stock specific, patience, and very selective.
In the case of The Brick, the story was one of a significant restructuring and turnaround. At the time of our recommendation, the company was generating in the range of $100 million in cash flow with a strong balance sheet. From a valuation perspective, The Brick was trading at around 4 times cash flow a discount to its peers and appeared ready to introduce a dividend (catalyst), which it did, and appeared like a potential takeover candidate (ultimate catalyst).
The Brick is not the first company directly from our recommendation list that has been taken over and produced strong gains in our portfolios. In fact, it is just one of 7 companies from active BUY list in the past 18 months. Additionally, we have seen 7 more premium takeovers in 2012 from our 2012 Cash Rich, Profitable Small-Cap Stock Report – which we are updating with new stocks for 2013, slated for upcoming release.
While the ‘fiscal cliff’ is a worry, and the state of government and debt in Europe and North America are without doubt worrisome, this ‘fear’ has consistently created opportunities. We continue to selectively seek these types of companies and present them to our loyal client’s overtime.
Congratulation to all who purchased The Brick – this was a significant win in what has been a poor broader market in 2012.

KeyStone’s Latest Reports Section
11/14/2012
PLEASE NOTE: SIGNIFICANT PROJECT DELAY FOR JUNIOR COPPER PRODUCER PROMPTS DOWNGRADE

Warren Buffett is the most respected and successful investor in history. Buffett has been called “The Oracle of Omaha” for his impressive investing prowess. As of September 2007, he was the third richest person in the world. Buffett studied under the legendary Benjamin Graham at Columbia University. Graham had a major impact on Buffett’s life and investment strategies. Buffett is Chairman of the miraculous Berkshire Hathaway, which he built from a textile company into a major corporation with a market cap in excess of $200 billion. Under Buffett’s leadership, Berkshire shares averaged a 21.4% compounded annual gain in per-share book value from 1965-2006.
These are the top 5 holdings of Warren Buffett
1. Coca-Cola Co (KO) – 400,000,000 shares, 20.1% of the total portfolio.
Added Positions: WFC, IBM, GM, NOV, DVA,
Reduced Positions: JNJ, GE, V, UPS,

….to read details on each of the recent Companies Warren Buffet has added go HERE (scroll down 1/2 a page)
For the details of Warren Buffett‘s stock buys and sells, go to http://www.gurufocus.com/StockBuy.php?GuruName=Warren+Buffett

The stock market had a lot to contend with yesterday and it didn’t contend very well.
DOW – 185 on 2350 net declines
NASDAQ COMP – 37 on 1350 net declines
TSX -205 on 1,166 declines
SHORT TERM TREND Bearish
INTERMEDIATE TERM TREND Bearish
After an up opening helped by better than expected earnings from Intel, it was downhill from there. Violence in Europe over austerity. Renewed tensions in the Middle East after a top Hamas official was killed by the Israelis, prompting Egypt to recall its ambassador.
Also hurting was a hard line on taxes taken by Obama in an exercise of brinksmanship.
Regarding Europe. I know exactly what has to be done. They need to start manufacturing things again and return to growth. Everything is now made in China. But, just like the U.S., they have bought into the “free trade” nonsense that is pushed by economists who happen to be wrong about almost everything. Sorry. I had to get that out.
Germany is the only country that still makes things in Europe and curiously enough they have the only really healthy economy.
Fourteen day RSI is oversold for the first time since the major low in early June (arrows), but let’s not jump the gun. We still have a pattern of lower lows and lower highs.

TORONTO EXCHANGE: Toronto was hit for a whopping 205 points. This will change our posture.
GOLD: Gold was up $2.
BONDS: Bonds were marginally lower.
THE REST: The dollar was higher again. Gold, silver and crude oil were up. Copper was lower.
BOTTOM LINE:
Our intermediate term systems are on a sell signal.
System 2 traders We had a buy. On Thursday buy the E-mini S&P 500 and or the SSO at the open, but do not pay more than 1353.00 for the former and no more than 54.38 for the latter. If it’s trading up in the morning, wait for it to come to you. The market almost always trades lower at some point the day after a session like this.
System 7 traders are in cash. Stay there on Thursday.
NEWS AND FUNDAMENTALS:
Retail sales was down 0.3%, more than the expected drop of 0.1%. PPI was negative 0.2%. the consensus was plus 0.2%. On Thursday we get CPI, initial claims, the Empire State index, Philadelphia Fed and oil inventories.
————————————————————————————-
We’re on a buy for bonds as of October 23.
We’re on a buy for the dollar and a sell for the euro as of November 2.
We’re on buy for gold as of November 8.
We’re on a buy for silver as of November 8.
We’re on a sell for crude oil as of September 25.
We’re on a sell for Copper as of October 12.
We’re moving back to a sell for the Toronto Stock Exchange TSX as of today November 14.

INDICATOR PARAMETERS
Monetary conditions (+2 means the Fed is actively dropping rates; +1 means a bias toward easing. 0 means neutral, -1 means a bias toward tightening, -2 means actively raising rates). RSI (30 or below is oversold, 80 or above is overbought). McClellan Oscillator ( minus 100 is oversold. Plus 100 is overbought). Composite Gauge (5 or below is negative, 13 or above is positive). Composite Gauge five day m.a. (8.0 or below is overbought. 13.0 or above is oversold). CBOE Put Call Ratio ( Below .80 is a negative. Above 1.00 is a positive). Volatility Index, VIX (low teens bearish, high twenties bullish), VIX % single day change. + 5 or greater bullish. -5 or less, bearish. VIX % change 5 day m.a. +3.0 or above bullish, -3.0 or below, bearish. Advances minus declines three day m.a.( +500 is bearish. – 500 is bullish). Supply Demand 5 day m.a. (.45 or below is a positive. .80 or above is a negative).
No guarantees are made. Traders can and do lose money. The publisher may take positions in recommended securities.
RANKED # 1 BY TIMER DIGEST
Timer Digest of Greenwich, CT monitors and ranks over 100 of the nation’s best known stock market advisory services.
Once per year in January, Timer Digest publishes the rankings of all services monitored for multiple time frames.
For the years 2003, 2004 and 2005, The Todd Market Forecast was rated # 1 for the preceding ten years. For the year 2006, we slipped to # 3 and in 2007, we were ranked # 5.
Our bond timing was rated # 1 for the years 1997, 2007 and 2008.
Gold timing was rated # 1 for 1997 and # 2 for 2006. Late word! We were rated # 1 for 2011.
We were # 1 in long term stock market timing for the years 1998 and 2004 and # 4 in 2010.
To subscribe go to Contact Us.
In the late 1950s, John Bogle changed the investing world.
Bogle became the chief advocate for index investing, a strategy based around the idea that investors should stop trying to pick individual stocks, quit buying mutual funds, and just buy the big stock indexes.
Why would an investor take such a hands-off approach? Bogle cited research that proved that most actively managed mutual funds don’t beat the market — and on top of that, they charged hefty management fees for their mediocre performance. The data was damning, and Bogle’s fund, the Vanguard 500 Fund, became one of the most popular investment funds in history, today worth more than $26 billion.
The Vanguard 500 fund doesn’t pick stocks. Its managers don’t have opinions on which indexes are best. It just tries to mirror the S&P 500 Index as closely as possible. And it does it for a tiny management fee.
Today, there are scores of index funds and ETFs that mirror all sorts of different market indices. If you want to buy “the market” or “stocks in general,” just plow some cash into one of the funds. Passive, hands-off investing has become the norm for scores of investors in the last five decades, becoming the “buy and hold” strategy that most people know about.
So, if passive index investing is so great, why would you ever want to pick a stock again? Well, it’s because the hands-off, buy and hold approach isn’t so great after all.
Today, I want to bust some myths about everyone’s favorite way to invest…
For starters, there’s no such thing as a “buy and hold forever” approach (no matter what certain octogenarian billionaires in Omaha may claim). That’s because everyone who’s ever tried it is broke.
Even though everyone in the industry calls index investing “passive,” there’s really nothing passive about it. The Dow, the S&P, the Russell — they’re all active investment strategies. Don’t follow?
Of all of the stocks that were part of the original Dow Jones Industrial Average, only General Electric is still a part of the index. All told, the index has changed 48 times since it was created — all of those changes being picked by the editors of The Wall Street Journal. That means that the Dow is, in fact, an active stock-picking index.
It’s how they unloaded garbage names like Kodak, Chrysler, and Woolworth when they hit the skids…
The S&P 500 is no different. S&P components are picked by a committee at Standard & Poor’s, who try to make the index mirror the 500 biggest stocks on the market. Since the rules on who makes it into the S&P 500 are largely based on who’s the biggest, stocks that fall get tossed out, and stocks that increase in value get added. So, in other words, the S&P committee is selling the losers and buying the winners. It’s the very reason why Apple (NASDAQ:AAPL) is a bigger chunk of the S&P 500 now, and Enron isn’t. We’ll get back to that in a minute.
The bottom line is this: passive investing doesn’t spare investors from the risks of stock picking. It just takes the stock picking off of portfolio managers’ plates and leaves it up to Dow and S&P. Clearly, that hasn’t worked very well lately. In the last 12 years, for example, the S&P 500 has actually lost just over 2%. So much for “buy and hold” always working out in the long-term.
But there is a different way to invest — a better way…
The key is in that phrase I mentioned from the S&P: selling losers and buying winners. It’s ironic, but the most successful long-term strategy any fundamental investor can point out is in essence a technical approach known as “trend following”.
The main idea behind trend following is simple: the market moves in big, long-term trends, and if you can identify them, you can ride them. It’s an approach that some of the most successful investors in history have used — and one you can use too.
Trend following can also avoid the pitfalls that index investors have struggled with over the past few years. You see, the S&P’s approach to trend following is crude at best. Since correlations between stocks in the S&P are very high, it’s not as effective at reducing risk as it could be. That’s why a purpose-built trend following approach makes so much more sense than all of this buy-and-hold brouhaha.
So, what would it look like?
For trend followers, there are basically two steps to figuring out what to buy: identifying when a trend begins and identifying when a trend ends. To do that, we don’t rely on emotion or opinion — instead, it’s critical to base any investment decisions on a set-in-stone system.
Today, we’ll construct a quick one.
Spotting a Trend Using Math
If you’re familiar with “technical analysis” at all, you’ve probably heard of a moving average. In short, it’s the average price of a stock over a set number of days. A moving average is a stellar indicator of trend — if it’s moving steadily higher, then we know that a stock is generally moving higher over the time period that we’ve set. More importantly, we can define moving averages mathematically, so, we’ll go ahead and use a moving average as our “trend indicator”.
For simplicity’s sake, we’ll apply it to just one investment: the SPDR S&P 500 ETF (NYSE:SPY).
So let’s create a quick rule. If SPY moves above the 300-day moving average (a long-term average that approximates a year’s worth of price data), we’ll buy. If it falls below the 300-day, we’ll sell. In real terms, that rule says that if SPY moves above the 300-day moving average, Mr. Market is entering an uptrend, and if it moves below, it’s entering a downtrend.
So, how would that simple strategy have fared over the last fifteen years? The chart below shows the hypothetical profit and loss of sitting back and letting that simple system trade for you:
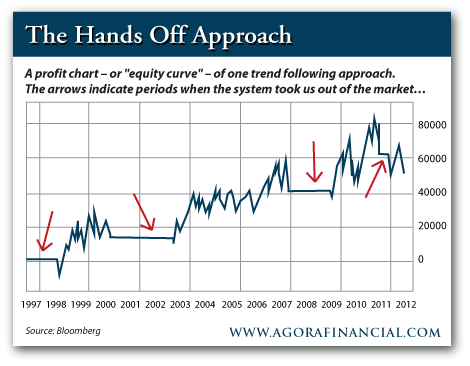
All told, you’d end up with gains of 74.3% — nearly double the 40% and change that a buy and hold approach would have earned you. But there’s an even more exciting story there…
See the handful of flat lines (with red arrows pointing to them) over that period? Those are the times you’re out of the market because the system said “sell”. So you didn’t touch stocks for almost 2 years while the tech bubble was bursting, and you were out of the market for all of 2008! I think you can see just how dramatically this system reduced the risks of being an investor.
Because despite that “hands off” approach to investing, you still beat the market by a wide margin.
Remember, the rules we just made up are crude. By adding some extra simple short selling rules to the approach, our trend following system could have upped its total profits to 80.8%, and actually made substantial profits when the floor was falling out for everyone else in 2008.
Our crude trend following system produced a chart that’s hard to believe, especially when you consider the fact that it includes two of the biggest market crashes in most investors’ memories.
There’s a lot an investor can do to improve performance beyond what I’ve shown you here — adding individual stocks, more complex rules, or introducing statistical optimization are all things that can easily improve returns under a trend following system.
But the key here is the fact that following trends (and not trying to predict them) can fuel some incredible returns while smashing risks much lower than you’d see from a “buy and hold” approach.
Regards,
Jonas Elmerraji, CMT,
for The Daily Reckoning
About Jonas Elmerraji
Jonas Elmerraji, CMT, is the co-editor of STORM Signals and Penny Stock Fortunes, and a contributor to Agora Financial’s Trend Playbook. Jonas got his start on the fundamental side of the market, poring over financial statements and valuations to find sound investments – today, he specializes in blending fundamental and technical analysis. Jonas is a senior contributor to TheStreet.com, and has been featured as an investment expert in Forbes, Investors Business Daily, and CNBC.com among others.
Jonas holds a degree in financial economics from UMBC and the Chartered Market Technician designation.
Special Video Presentation: Urgent Message About Your Net Worth The single, solution-packed book that could… literally… mean the difference between growing wealthy or suffering an ugly, vicious decline in your net worth. Discover how to claim a FREE copy of this book, right here.
Markets Will Drop at Least 20% “Actually I am not surprised the market is selling off because technically the market was weak already for a couple of months and we are in a down trend Mr Obama’s economic policies are obviously not good for an economic expansion”. Gloom, Boom & Doom’ report editor Marc Faber reacts to Obama’s victory and how it will impact investors in this Video Report 3:40 minutes:


-
I know Mike is a very solid investor and respect his opinions very much. So if he says pay attention to this or that - I will.
~ Dale G.
-
I've started managing my own investments so view Michael's site as a one-stop shop from which to get information and perspectives.
~ Dave E.
-
Michael offers easy reading, honest, common sense information that anyone can use in a practical manner.
~ der_al.
-
A sane voice in a scrambled investment world.
~ Ed R.
Inside Edge Pro Contributors

Greg Weldon

Josef Schachter

Tyler Bollhorn

Ryan Irvine

Paul Beattie

Martin Straith

Patrick Ceresna

Mark Leibovit

James Thorne

Victor Adair