
Stocks & Equities
The Bottom Line
Technical action by equity markets was a negative surprise. Furthermore, short term technical action has yet to show signs of bottoming and weak economic news this week attributed to Hurricane Sandy will not help. Preferred strategy is to accumulate equities and Exchange Traded Funds with favourable seasonality at this time of year that already are showing technical signs of performance or outperformance relative to the market (S&P 500 Index for U.S. markets or TSX Composite Index for Canadian markets). Sectors include agriculture, forest products, transportation, industrials, mines & metals, home builders, semiconductors, China and Europe.
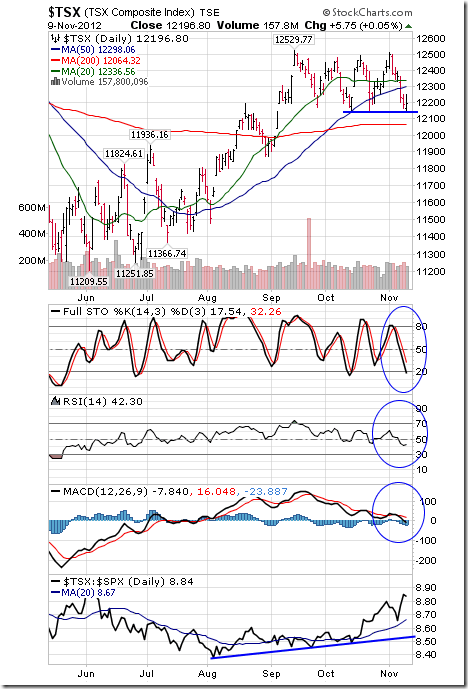
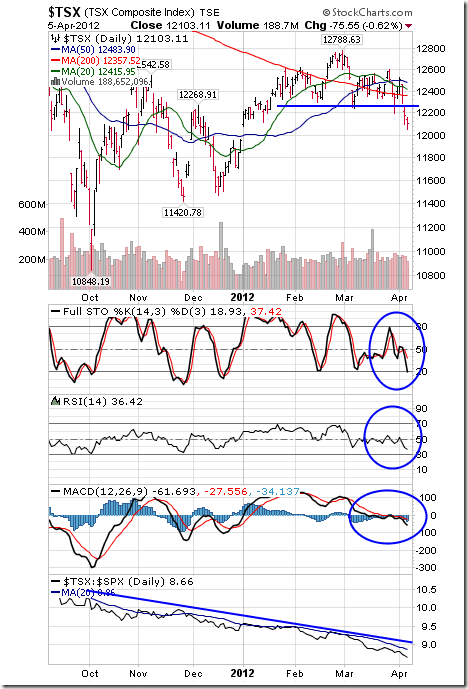
The TSX Composite Index fell 183.61 points (1.48%) last week. Intermediate trend is neutral. Support is at 12,137.18 set on October 15th. Resistance is at 12,529.77. The Index remains above its 200 day moving average and below its 20 and 50 day moving averages. Short term momentum indicators are trending down, but have yet to show signs of bottoming. Strength relative to the S&P 500 Index remains positive.
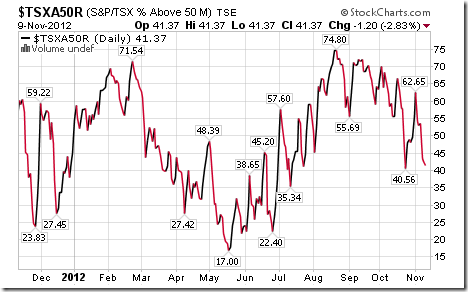
Percent of TSX Composite stocks trading above their 50 day moving average fell last week to 41.37% from 54.22%. Percent is in an intermediate downtrend.
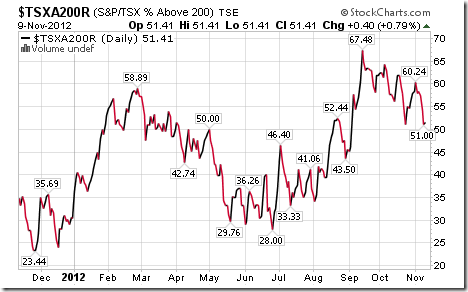
Percent of TSX Composite stocks trading above their 200 day moving average fell last week to 51.41% from 57.83%. Percent is in an intermediate downtrend.
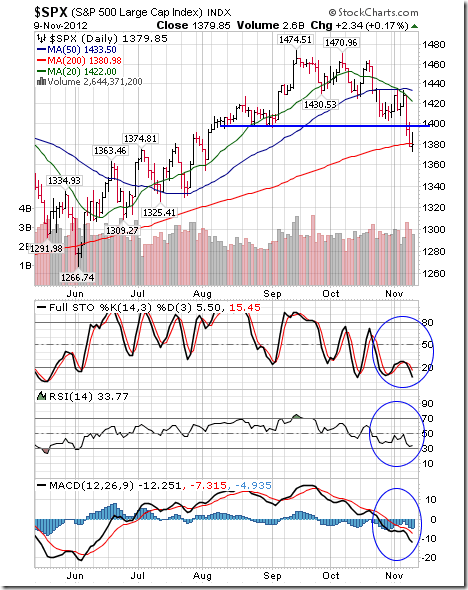
The S&P 500 Index fell 34.35 points (2.43%) last week. Intermediate trend is down. Support at 1,396.56 was broken on Wednesday. The Index remains below its 20 and 50 day moving averages and closed at its 200 day moving average on Friday. Short term momentum indicators are oversold, but have yet to show signs of bottoming.
Percent of S&P 500 stocks trading above their 50 day moving average dropped last week to 31.60% from 49.60%. Percent continues an intermediate downtrend.

Percent of S&P 500 stocks trading above their 200 day moving average dropped last week to 55.40% from 65.20%. Percent continues an intermediate downtrend.
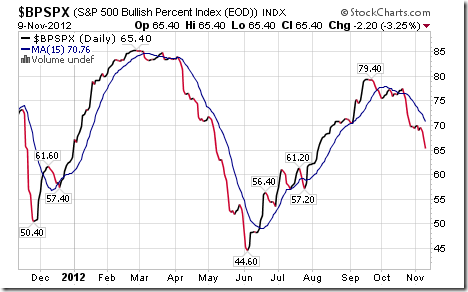
Bullish Percent Index for S&P 500 stocks fell last week to 65.40% from 70.20% and remains below its 15 day moving average. The Index remains in an intermediate downtrend.
 …
…
……….view the other 45 Major Stock Index, Gold, Currency, & Commodity Charts & Commentary HERE
Go to the top of this page HERE for a list of this weeks upcoming Economic News

WEEKLY COMMENTARY
This week’s Trading Lesson
Here is an excerpt from my upcoming book, The Mindless Investor, How to Make Money in the Market by Overcoming Your Common Sense. This piece is from the chapter, Price Direction Does Not Matter:
Most traders focus on buying stocks with an expectation that the price will rise. It is less common to try and make money from stocks going down. It is also possible to make money from price decline and, since markets often go down as well as up, it makes sense to be willing to do so.
Short Selling
Short selling is how you make money from a stock’s decline. When you short, you still buy and sell the stock, you just do so in reverse order. Sell first and then buy back later. But how do you sell something you don’t own?
The answer is to borrow the shares that you think are going to go lower. The brokerage you deal with has a great many customers. Between all of those investors, there are a large number of shares being held in many different companies. A person you have never met may have the shares of the stock that you think is going to go lower and, like a bank that lends out the money from its depositors, your broker is going to let you borrow someone else’s shares to sell.
Eventually you will have to return the shares you borrowed. Hopefully, the price will fall as you predict so that you can buy them back at a lower price. In this scenario, you have bought at a lower price than you sold them, netting the difference as profit.
You borrow the shares and sell them in the market. With the sale, you get an injection of cash into your account, a pretty good deal considering you didn’t even own the shares you sold. Sadly, it’s not that easy to grow your capital base. Your broker requires that you have sufficient capital to buy back the borrowed shares, so that they can return them to the person who owned them in the first place. The brokerage is not going to take a risk on your trade, so you must always maintain 150% of the value of the shares you sold so that you have enough capital to buy them back if necessary. The sale of the shares gives you 100%, but you have to add in another 50% and maintain that 150% of whatever the borrowed position is worth. If the stock goes up, you need more capital segregated to cover the short. If the stock goes down, you require less.
Is Short Selling Ethical?
You make money as long as the shares go down and you buy them back at a lower price. As a short seller, you’re speculating that the price of the shares is going lower-that the company is getting weaker and running into problems that make their shares worth less.
This has many people against short selling; they argue that it is counterproductive to business. These people reason that the job of the stock market is to give businesses a way to finance growth and innovation, and short selling only serves to limit that ability. These viewpoints are misguided.
Traders are always going to buy and sell, and the order in which they do it is irrelevant. Is it unethical to sell a stock that you bought six months ago because it has given you a 100% profit? Most would say no, so why is it wrong to short sell a stock that has gone up 100% if it looks like it’s going to go lower?
Short selling is important because it helps take emotion out of the market and provide liquidity when few are willing to buy. If a stock is going up very quickly because investors are acting with greed rather than a rational assessment of value, the short seller can provide some strength to the sell side in an effort to balance the market.
More importantly, if the short sellers who acted when the stock was strong are proven right and the share price falls, it will be the short sellers who provide demand for the stock when pessimism is at its highest. You know that many investors are nervous about buying stocks that are in downward trends, but the short sellers will be motivated to provide some support to the stock so they can lock in their profits by covering the positions.
It is more difficult to short sell stocks, making it harder to make money from markets that are moving lower. In order to short a stock, your broker must have the shares to lend to you. Large, widely held companies are easy to short because there will be customers of the brokerage who own shares. Smaller companies without as many shareholders can be harder to short because your broker doesn’t have the inventory. I have found that many stocks I would like to short are not shortable for this reason.
STRATEGY OF THE WEEK
Stocks were hammered this week, taking the S&P 500 back to its long term upward trend line. This line provides good support for stocks so there should be a short term bounce back in the next few days. With that in mind, I set out to find stocks that have been sharply sold but which are showing some signs that a bounce back may be imminent. I did this with the following Market Scan:
Volatility Index = High
Candle = Bullish Candle
Gain/Loss > 1% over the last 1 days
Number of trades > 5000
Short Trend = Bearish
Medium Trend = Bearish
This scan found 77 stocks, here are four that I think are worth watching next week for a bounce:
STOCKS THAT MEET THAT FEATURED STRATEGY
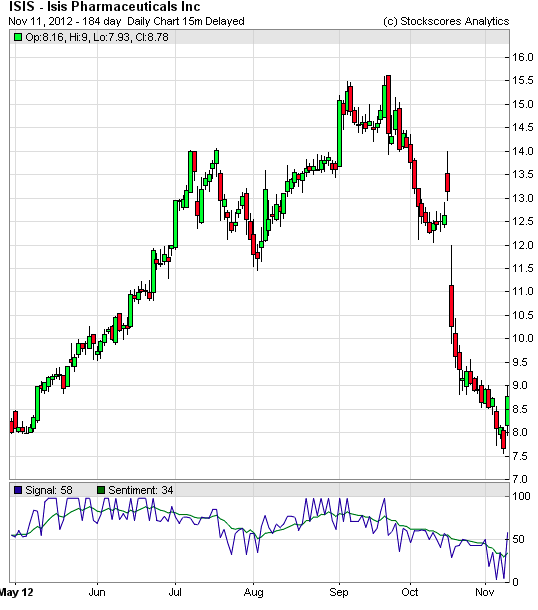
1. ISIS
ISIS is forming a rising bottom on the intraday after breaking the downward trend line, watch for a break up through $9.
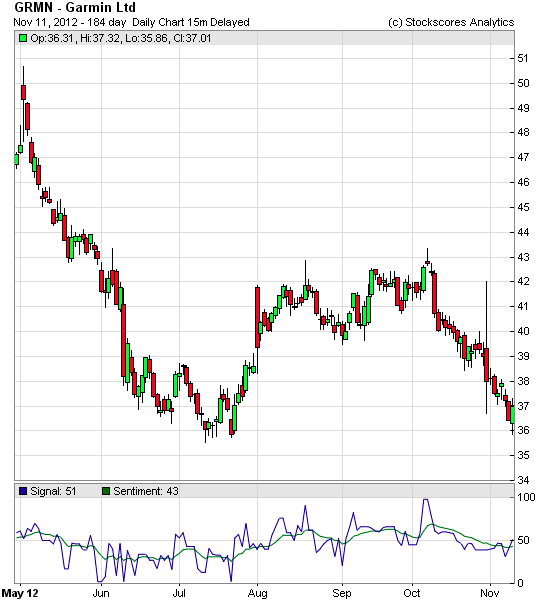
2. GRMN
GRMN is at long term support at $36 and closed above its open on Friday, a sign that the market will try to hold support. Stop loss it on a close below $36.
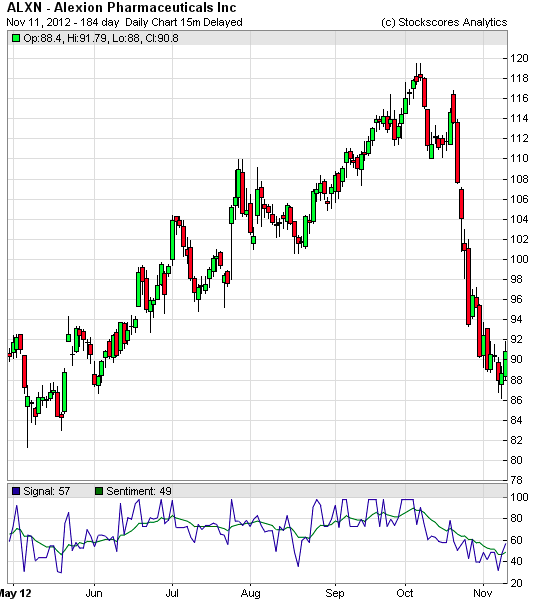
3. ALXN
ALXN has been hammered lately but is building a base around $90, a break up through $91.75 should be the start of a bounce back on an intraday cup and handle break.
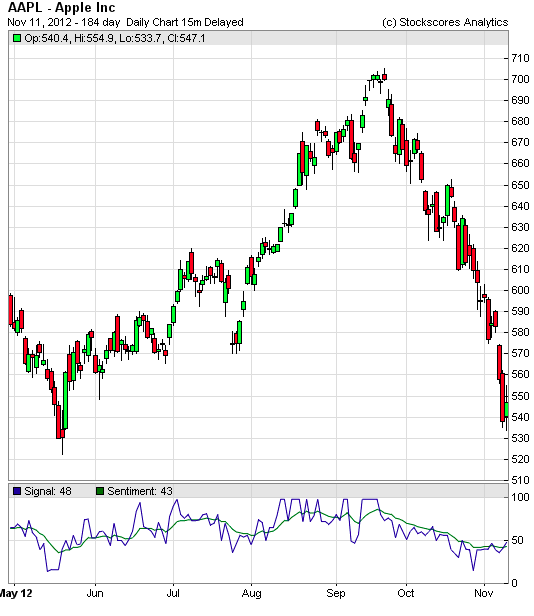
4. AAPL
Has taken a bungee jump down to support where the elastic should be stretched out enough to recoil.
Stockscores Club Meeting and Mindless Investor Book Launch Special Event
Calgary Monday Nov 12
Vancouver Tuesday Nov 13
Click here for information and to register for this free event
This is not an introductory seminar, instead it is mean to show the application of my approach to the market. I will provide my analysis on current market conditions and show the processes that I do to find trading opportunities. Free to attend and copies of my new book, The Mindless Investor, will be available for purchase for $30. Please register to attend and let us know how many copies of the book you wish to purchase in the comments section of the registration page so we can bring enough copies.
Stockscores Trader Training
The 12 week Stockscores Investor and Stockscores Active Trader training programs start with the live Foundation class on November 24th in Vancouver and November 25th in Calgary. Click here to visit the information page.
Live Trading Day
For those who have completed the StockSchool Pro, Investor or Active Trader classes in the past, I will be doing a live trading day in Calgary on Monday November 26th. Watch me trade live and learn the processes I go through to find day and swing trading strategies. Emailtylerb@stockscores.com for more information.
Stockscores Market Minutes Video
There is always a bull market somewhere, this week I look at how to make money buying in a market that is falling. You can watch this week’s Market Minutes video on Youtube by clicking here. To receive email alerts any time I upload a new video, subscribe to the Stockscores channel at www.youtube.com/stockscoresdotcom.
References
- Get the Stockscore on any of over 20,000 North American stocks.
- Background on the theories used by Stockscores.
- Strategies that can help you find new opportunities.
- Scan the market using extensive filter criteria.
- Build a portfolio of stocks and view a slide show of their charts.
- See which sectors are leading the market, and their components.
Disclaimer
This is not an investment advisory, and should not be used to make investment decisions. Information in Stockscores Perspectives is often opinionated and should be considered for information purposes only. No stock exchange anywhere has approved or disapproved of the information contained herein. There is no express or implied solicitation to buy or sell securities. The writers and editors of Perspectives may have positions in the stocks discussed above and may trade in the stocks mentioned. Don’t consider buying or selling any stock without conducting your own due diligence.

![]()
Back in the early 1960s, then University of Chicago PHD candidate, Eugene Fama published a thesis which was later developed into a theory called the Efficient Market Hypothesis (EMH). This theory gained widespread acceptance in the finance industry (at least among academics) for several decades afterwards and is still commonly referenced to this day. Essentially what Professor Fama was postulating is that stock markets, or most markets for that matter, were efficiently priced at any point in time and that it was inherently impossible to outperform the market on a risk adjusted basis outside of the aid of pure luck, thus making individual stock selection a futile pursuit.
Around the 1990s, Fama’s theory started to lose its appeal among the mainstream finance community. Empirical evidence and research did not support the EMH’s conclusion that capital markets were perfectly efficient and select investment strategies, such as buying stocks with low price-to-earnings and cash flow multiples, did demonstrate an ability to outperform the market on a risk-adjusted basis over time. Providing an explanation of the short-comings of the Efficient Market Hypothesis was a relatively new field known as Behavioral Finance. This new field sought to study the emotional traits of investors and the impact they had on investment decisions and market activity. EMH was largely based on the assumption that humans were perfectly rationale beings and that decisions were made instantaneously with full knowledge of all potential outcomes in an unbiased and emotionless process. However, studies in both psychology and finance have demonstrated that this perfectly rationale investor was largely a myth. Human beings in fact rely on emotional to a large extent when making important decisions and are subject to a wide variety of potential biases. An objective of Behavioural Finance is to integrate these real world human biases into modern day financial theory to create a more realistic explanation of how the markets work.
Behavioral finance and psychology have defined numerous biases that can lead to poor investment decisions. We have provided a few examples below.
Bias: Bandwagon Effect
Definition: This occurs when a certain idea, investment type, or investment style starts to become more popular. As popularity increases, more and more people adopt the groupthink mentality and adopt the mentality themselves which further accelerates popularity, and in the case of investing, asset overvaluation.
Example: Alex has been looking at the market for potential investment opportunities. He has noticed that many small-cap tech companies have been doing well. A few of his friends have started to invest heavily in the sector, with good results, but Alex is worried about the high risk nature of the securities. As time passes, more of Alex’s friends have gravitated towards the sector and he is starting to see more portfolio managers and experts talk about it on the financial news. More time passes and the popularity increases. Finally, Alex has grown tired of missing out on the returns and decides to make a significant purchase of these stocks. Unfortunately, the growing popularity of the asset class has pushed valuation far beyond reasonable levels and the sector is now in serious risk of a crash.
Bias: Recallability Trap
Definition: This occurs when an individual’s opinions and decisions are overly influenced by large scale (and often dramatic) events that have taken place in the past.
Example: John receives a call from his financial advisor informing him that he has compiled a report of several successful technology companies that offer strong investment value. All of the companies in the report are profitable, growing, maintain healthy financial positions, and are trading at attractive value. John tells his advisor that he has no interest in receiving the report as he was heavily invested in tech stocks shortly before the market crashed 2001. His opinion is that the sector is far too volatile and he has decided to stay out of it completely. Although John’s decision is understandable, he is now limiting the flexibility of his portfolio based on an irrational bias. The tech market crashed in 2001 because it was substantially overvalued but that does not mean that current opportunities do not exist in that space.
Bias: Confirmation Bias
Definition: When people have an existing belief, such as an opinion on an individual stock or the movement of the economy, we tend to overweight evidence that supports our original view and underweight, or even disregard, evidence that that conflicts with this view.
Example: Jane recently made a purchase of Company B which is advancing a new technology. She spent a great deal of time reading the company reports and speaking to management. About a week after the initial purchase, she hears an analyst on the news reiterate what the company said about the technology. Pleased to see more people taking notice of the company, Jane increases her position that day. About a week later, she hears another analyst with a respected background in science discuss the technology and conclude that it is not as commercially viable and the company suggests. Although somewhat concerned with the statements, Jane takes no action.
Bias: Anchoring and Adjustment
Definition: Very similar to confirmation bias, anchoring and adjustment is a tendency to not fully reflect and adjust for new information when reviewing an existing opinion or forecast. This is a very common bias in the professional analyst community, but can also been seen regularly with retail investors.
Example: Jim owns shares in Company C and believes that the stock price will appreciate from $5.00 to $9.00 in 12 months as a result of increased sales from a new product offered by the company. Company C releases a statement later on indicating that sales of the new product are falling significantly short of initial expectations. Disappointed, Jim decides that the stock is probably only worth $7.00 over the next 12 months and cuts his price expectation by $2.00. Considering the lack of visibility going-forward, a large reduction is the price expectation is justified but Jim is still being influenced (he is anchored) to this original target.
Bias: Overconfidence
Definition: This is when investors tend to place too much confidence in their ability to pick stocks or make investment decisions. It is typically the result of a past success or successes which may or may not have been the result of luck. Overconfidence can be dangerous because it can cause investors to underestimate risk, under-diversify their portfolio, and even disregard relevant information.
Example: Garth has been a buyer and seller of speculative junior mining stocks for the last several years with mixed success. Recently, he bought shares in Company E which made a notable discovery and appreciated in price substantially. Garth also noticed that many of his other junior mining stocks had been doing well over the past year but that his diversified portfolio had underperformed. Garth concluded that his experience in identifying opportunities in the sector had started to pay off. He was also ignoring the fact that many of his stocks were doing well as a result of a generally strong market over that period. The problem was that Garth didn’t buy enough of Company E to really boost his portfolio value. Confident in his abilities, Garth decides that he is going to search hard for another stock like Company E, only this time he plans to concentrate a large portion of this portfolio in the stock so that he can make a huge return.
Bias: Mental Accounting
Definition: This refers to the way that the people have a tendency to mentally compartmentalize their finances and separate capital to psychological accounts.
Example: Taylor is reviewing his finances and deciding how much money he can contribute to his investment account which is currently worth $20,000 and has been generating a 6% annual return. Taylor also noticed that his credit card balance was a hefty $10,000 on which he is paying 18% interest. Taylor understands the importance of paying down debt as well as saving for retirement so he splits his $5,000 annual contribution 50%/50% to debt repayment and investment. While this may seem appropriate, it is actually highly irrational. For this to be a rational decision, Taylor would need to generate a minimum return of 18% in his investment account which is highly unrealistic. Taylor’s investment portfolio would be better long term if he were to use both his annual contribution and his investment portfolio to completely pay down the high interest debt.
Now that we are aware of a few of the common investor biases we can start to evaluate whether or not our own decisions are impacted by irrational tendencies and counterproductive habits. The first step is simply awareness. While it may be asking too much of ourselves to be perfectly rational at all times, simply being aware of the common biases and reviewing our behaviour in that context can be highly beneficial with respect to making better investment decisions in the future.
KeyStone’s Latest Reports Section
As a result of a host of concerns (looming fiscal cliff, European debt crisis, slowing Chinese economy, geopolitical issues, etc.), the Dow has pulled back from its post-financial crisis high of one month ago. For some perspective, today’s chart illustrates the overall trend of the stock market (as measured by the Dow) since 2003. As today’s chart illustrates, the post-financial crisis rally was especially sharp during its first two years. Since then, the rally slowed but continued to trade above support (green line) — until now. The sharp selloff over the past two days has resulted in the Dow breaking below its 3.5-year, upward sloping support trendline.
Notes:
Where’s the Dow headed? The answer may surprise you. Find out right now with the exclusive & Barron’s recommended charts of Chart of the Day Plus.
<a href=”http://www.chartoftheday.com/”>Chart of the Day</a>
Quote of the Day
“Ride the horse in the direction it’s going.” – Werner Erhard
Stocks of the Day
Find out which stocks investors are focused on with the most active stocks today.
Which stocks are making big money? Find out with the biggest stock gainers today.
What are the largest companies? Find out with the largest companies by market cap.
Which stocks are the biggest dividend payers? Find out with the highest dividend paying stocks.
 The Dow plunged 313 points yesterday, but don’t believe news media reports that it was the nearness of the “fiscal cliff” that caused the selloff. What spooked investors is a bigger picture that recognizes the economically catastrophic implications of a second Obama term. To be clear, there is nothing Romney could have done to avoid the deflationary Depression that lies ahead. However, a Romney presidency might have at least served as a reality check, delaying the onslaught of hard times for perhaps long enough to allow Americans to put their financial houses in order before austerity hits with the force of an earthquake, as it has in Europe.
…..read more HERE
Here’s What President Obama’s Win Means For
Your Money
by Keith Fitz-Gerald , Chief Investment Strategist, Money Morning
As was widely expected leading up to the election, all of the major averages got slammed in early trading on news of President Obama’s victory. Just over an hour into yesterday’s session, the Dow dropped 262.51, the S&P 500 tumbled 27.58 and the tech- laden Nasdaq fell 59.55. Oil tanked 2.95% and $2.62 per barrel to $86.08 while 10-year bonds saw yields plummet 6.20% to 1.63%.
O-bummer.
There is a bright side, though. Now that all the hoopla is over, investors can get down to business.
Here’s what I’m expecting:
……read it all HERE
US stocks will fall 20-50% after Obama re-election warns Dr Marc Faber
Marc Faber, publisher of the Gloom Boom, & Doom Report, told Bloomberg Television’s Trish Regan and Adam Johnson on ‘Street Smart’ today that ‘Mr. Obama is a disaster for business and a disaster for the United States’ and that he ‘thought that the market on his reelection should be down at least 50 per cent.’
Faber also said ‘I doubt [Obama] will stay at the presidency for another four years. I think there will be so many scandals’ and that investors should ‘buy themselves a machine gun.’
…..read the 8 paragraph article HERE

-
I know Mike is a very solid investor and respect his opinions very much. So if he says pay attention to this or that - I will.
~ Dale G.
-
I've started managing my own investments so view Michael's site as a one-stop shop from which to get information and perspectives.
~ Dave E.
-
Michael offers easy reading, honest, common sense information that anyone can use in a practical manner.
~ der_al.
-
A sane voice in a scrambled investment world.
~ Ed R.
Inside Edge Pro Contributors

Greg Weldon

Josef Schachter

Tyler Bollhorn

Ryan Irvine

Paul Beattie

Martin Straith

Patrick Ceresna

Mark Leibovit

James Thorne

Victor Adair