
Stocks & Equities
Crude oil has had some large price swings this year and another one may be on its way. This report shows the seasonality of crude oil along with where oil is trading and what the oil service stocks are telling us is likely to happen going into year end.
Since WTI Crude Oil topped out in September at the $100 resistance level (Century Number) many traders are looking for a bounce or bottom to form in the next week. Historical charts show that on average the price of oil falls during November and the first half of December.
The charts of oil and oil stocks shown below have formed patterns on both time frames (weekly & daily) that lower prices are to be expected. If you did not read my Gold Seasonality Report I just posted be sure to review it here: Gold Seasonal Report
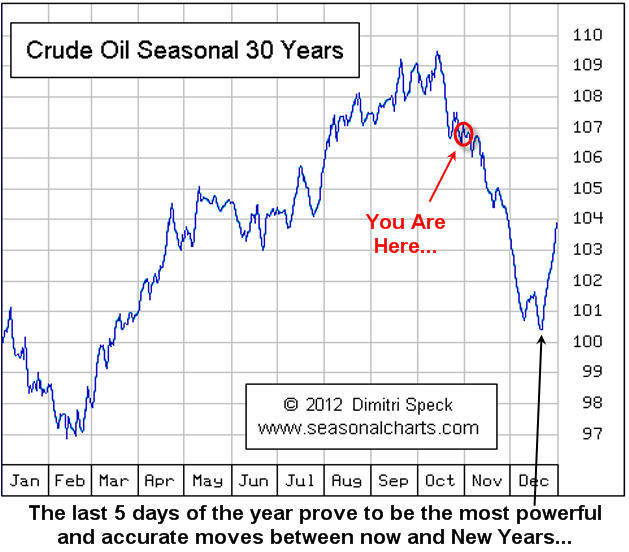
WTI Crude Oil Weekly Chart:
Here you can see that price tends to fall going into Christmas and rallies during the last week of trading. This price action falls in line with Dimitri Specks seasonal chart providing us with insight as to what we should expect. Later this week I will finish my report on the Election Cycle Seasonality report which shows weakness in the market during Oct & Nov when a president is up for re-election.

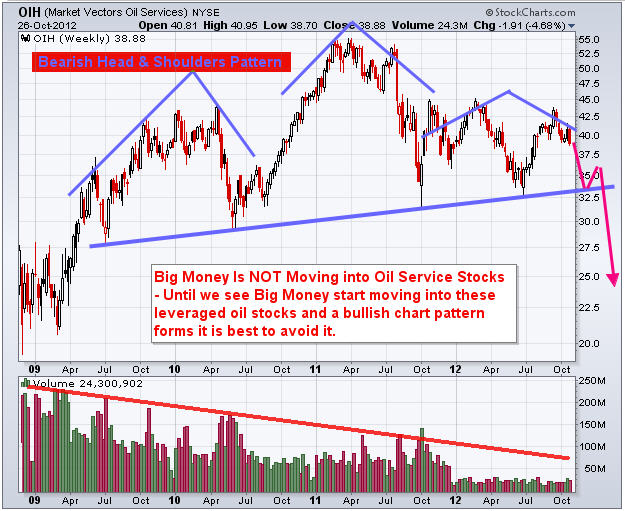
Oil Services Stocks – Weekly Chart:
If you follow oil closely then you know likely know already that oil related stocks can lead the price of oil by a couple weeks. What this means is that if big money is flowing into oil stocks (bullish price patterns with strong volume), then you should expect the price of crude oil to rise in the coming days. That said, if money is flowing OUT of oils stocks then lower or sideways oil price should be expected.
The weekly chart oil stocks show a very large bearish head & shoulders pattern. While I do not think the neckline will be broken it is very possible.
One of the most important pieces of data on the chart is the VOLUME. Notice the lack of it… Volume tells us how much interest and power is behind chart patterns and declining volume clearly tells us these investments are out of favor currently and that big money is not moving into them.
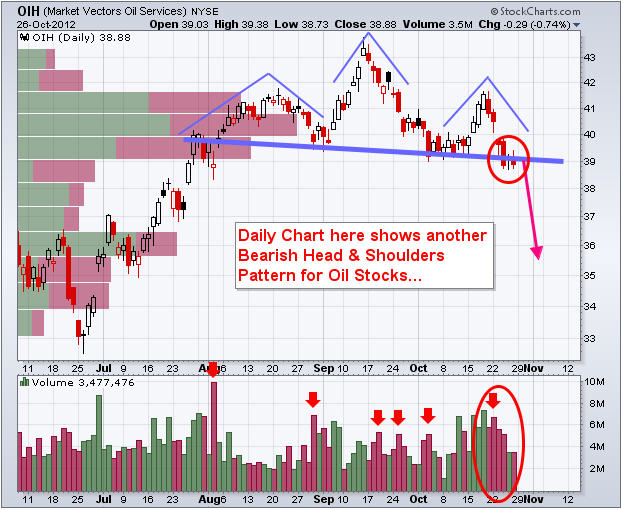
Oil Services Stocks – DAILY Chart:
Zooming into the daily chart of the oil service stocks we can see there is yet another bearish pattern unfolding. Another head & shoulders pattern which looks as though it is just starting to breakdown as of this writing. Next support level is $35-36.
WTI Crude Oil and Oil Service Stocks Trading Conclusion:
Looking forward 1-2 months (November – December) taking the seasonal price swings in oil, re-election cycle seasonality and price action of oil stocks I feel oil will trade sideways or down from here. With that being said, expect crude oil to rally during the last week of the year. I hope this provides some useful info for your trading!
Get my Daily Trading Analysis & Trade Setups at: www.TheGoldAndOilGuy.com
Chris Vermeulen is Founder of the popular trading analysis websitewww.TheGoldAndOilGuy.com. There he shares his highly successful, low-risk trade ideas. Since 2001 Chris has been a leader in teaching others to skillfully trade Currencies, Stock Indices, Bonds, Metals, Energies, Commodities, and Exchange Traded Funds. Reach Chris at: Chris[at]TheTechnicalTraders.com

The Bottom Line
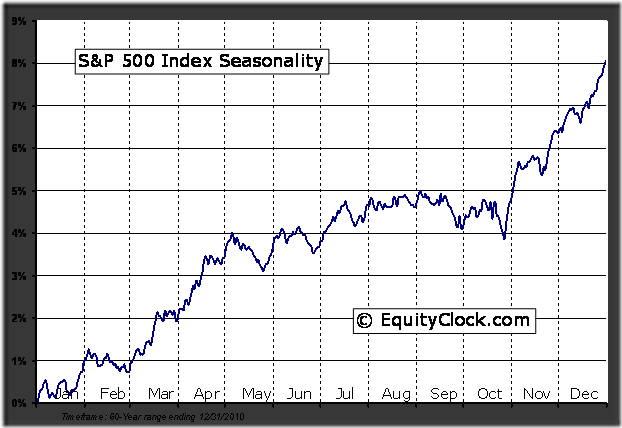
The entry point for the seasonal trade this year is here. The TSX Composite Index reached a low of 12,132 on October 15th. The low for the S&P 500 Index and Dow Jones Industrial Average has yet to be confirmed, but both indices showed evidence on Friday that they are trying to bounce from near key support levels. Downside risk is limited and upside potential into early next year is above average. Average gain during an election year by the S&P 500 Index from November 1st to February 1st is 5.0%. Preferred strategy is to accumulate equities and Exchange Traded Funds with favourable seasonality at this time of year that already are showing technical signs of performance or outperformance relative to the market (S&P 500 for U.S. markets and TSX Composite for Canadian markets). Sectors include agriculture, forest products, transportation, industrials, steel, consumer discretionary, semiconductors, home builders, China and Europe.
“For seasonal traders, this Monday is the day to buy stocks”.
Following is full text of Don Vialoux’s article in the Globe & Mail
The best time during the past 61 years to enter North American equity markets has been at the opening of trade on October 28th. This year, the optimal date is the opening of trade on Monday October 29th. How does the entry point look this year?
Thackray’s 2012 Investor’s Guide notes that the best period to own U.S. equities during the past 61 years has been from October 28th to May 5th. A $10,000 investment in the S&P 500 Index purchased each year on October 28th since 1950 and sold each year on May 5th during the past 60 periods increased in value to $1,057,851 by May 5th 2011. The trade was profitable in 53 of the past 61 periods. In contrast, a $10,000 investment in the S&P 500 Index purchased each year on May 6th and sold each year on October 27th fell in value to $6,862. Calculations did not include dividends or commission costs.
The best period to own Canadian equities is identical. Data for the past 34 years shows that a $10,000 investment in the TSX Composite Index purchased each year on October 28th since 1977 and sold each year on May 5th increased in value to $200,778 by May 5th 2011.The trade was profitable in 29 of the past 35 periods. In contrast, a $10,000 investment purchased each year on May 6th and sold on October 27th fell in value to $6,674.
The main reason for the period of seasonal strength is a response by equity markets to a series of positive annual recurring events from late October to early May. Annual recurring events include transactions for tax purposes, anticipation of quarterly and annual corporate reports, the timing of analyst opinion changes, key economic reports, and special holidays, including the U.S. Thanksgiving holiday and the Christmas holiday.
The beginning of the period of seasonal strength at the end of October typically happens just after a majority of S&P 500 companies have reported third quarter results. Prior to the end of October during the third quarter earnings report period, U.S. equity markets have a history of exceptional volatility. This year was no exception.
The October 28th to May 5th favourable period of investment is best known as the “Buy when it snows, sell when it goes” strategy. By coincidence, the phrase is particularly relevant this year. Calgary experienced its first snow storm yesterday.
Negative return indicated in the data during the May 6th to October 27th periods does not imply a “Sell in May, go away” strategy. “Sell in May and go away” is a myth. The S&P 500 Index has gained in 38 out of the past 61 periods and the TSX Composite has advanced in 20 of the past 35 periods. However, gains were modest and the losses were higher relative to the period of seasonal strength. The May 6th to October 27th periods is plagued by higher volatility and fewer annual recurring events that influence equity markets.
The October 28th entry date for the annual seasonal trade is an average date. The optimal date to enter the trade each year is fine-tuned using short term momentum indicators. The optimal date normally occurs on the average date plus or minus three weeks. Last year, the optimal entry date was October 5th.
What about this October? Short term momentum indicators for the S&P 500 Index and TSX Composite Index already are oversold, but have yet to show signs of bottoming. A trigger recording a momentum buy signal is likely to occur during the next few days.
Year-end “window dressing” by U.S. mutual fund companies could have an impact on U.S. equity markets this year. Most major mutual fund companies have a fiscal year end on October 31st. Managers of these funds frequently add best performing equities prior to November 1st in order to “pretty up” their portfolio for unit holder reporting purposes. Net result is a positive bias in equity markets during the last four trading days of October.
Thackray’s 2012 Investor’s Guide notes that the last four trading days in October has recorded an exceptional return on investment in U.S. equity markets. Average return per period from 1950 to 2010 for the S&P 500 Index was 1.0 per cent. Moreover, the first three trading days in November have provided above average returns.
Given current short term oversold condition in the U.S. equity market, chances of a successful trade this year starting this Friday and continuing to November 5th are above average.
An opportunity to enter into North American equity markets at current or lower prices for a seasonal trade lasting until spring has arrived. A wide variety of Exchange Traded Funds are available that track major U.S. and Canadian equity indices.
Equity Trends
The TSX Composite Index dropped 115.68 points (0.93%) last week. Intermediate trend is neutral. Support is at 12,137.18 and resistance is 12,529.77. The Index remains above its 200 day moving average and moved back above its 50 day moving average on Thursday. Short term momentum indicators are neutral. Strength relative to the S&P 500 Index remains positive.
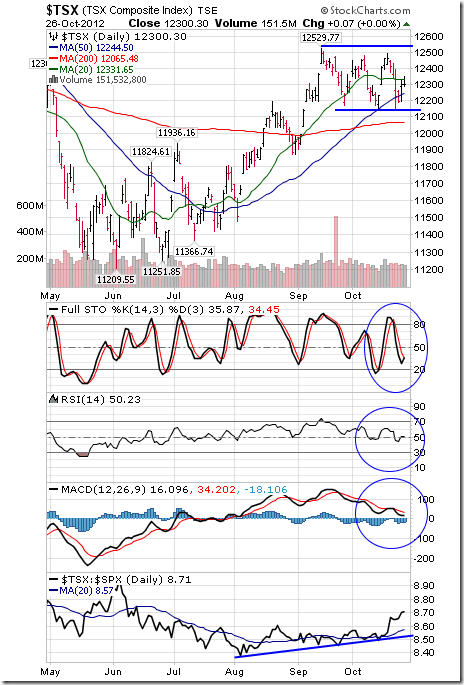
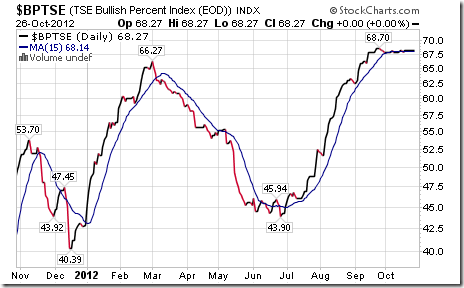
Bullish Percent Index for TSX Composite stocks was unchanged last week at 68.27% and remained above its 15 day moving average. The Index remains intermediate overbought.
Percent of TSX Composite stocks trading above their 50 day moving average fell last week to 49.00% from 57.83%. Percent continues to trend down.

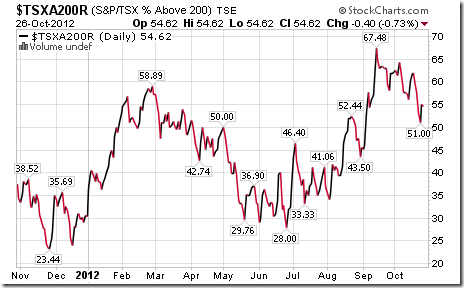
Percent of TSX Composite stocks trading above their 200 day moving average fell last week to 54.62% from 59.04%. Percent continues to trend down.
The S&P 500 Index fell 21.25 points (1.48%) last week. The Index has lost 4.25% from its September 14th high at 1,474.51. Intermediate trend is down. Support is at 1,396.56. The Index remains below its 20 and 50 day moving averages. Short term momentum indicators are oversold, but have yet to show signs of bottoming.
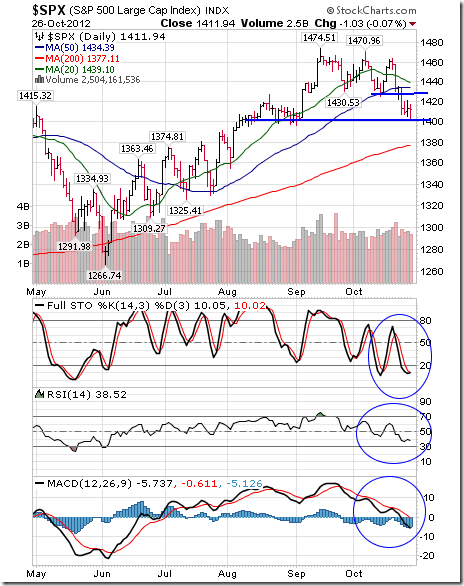
Percent of S&P 500 stocks trading above their 50 day moving average fell last week to 45.80% from 58.00%. Percent continues to trend down.
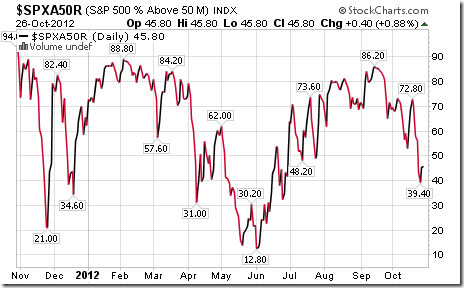
Percent of S&P 500 stocks trading above their 200 day moving average fell last week to 64.00% from 70.40%. Percent continues to trend down.

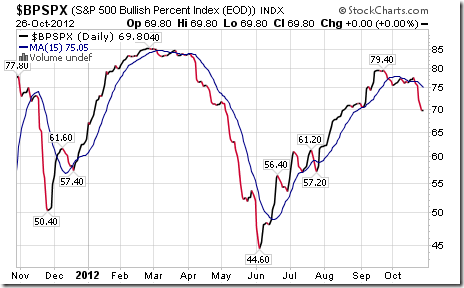
Bullish Percent Index for S&P 500 stocks fell last week to 69.80% from 76.20% and remains below its 15 day moving average. The Index remains intermediate overbought and trending down.
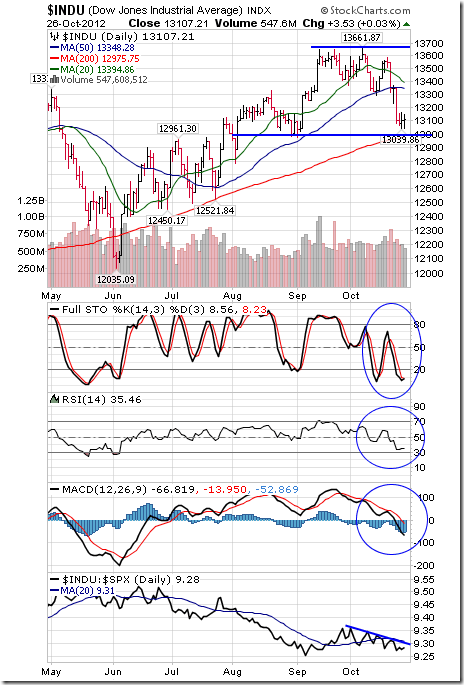
The Dow Jones Industrial Average fell 236.30 points (1.77%) last week. Intermediate trend changed from neutral to down on a break below support at 13,296.43. Next support is at 12,977.09. The Average remains below its 20 and 50 day moving averages. Short term momentum indicators are oversold, but have yet to show signs of bottoming. Strength relative to the S&P 500 Index has turned from neutral to negative.
…….read more including 45 charts and economic & earnings news this week in Don’s Monday Report HERE

Today’s chart illustrates the price to earnings ratio (PE ratio) from 1900 to present. Generally speaking, when the PE ratio is high, stocks are considered to be expensive. When the PE ratio is low, stocks are considered to be inexpensive. From 1900 into the mid-1990s, the PE ratio tended to peak in the low to mid-20s (red line) and trough somewhere around seven (green line). The price investors were willing to pay for a dollar of earnings increased during the dot-com boom (late 1990s), surged even higher during the dot-com bust (early 2000s), and spiked to extraordinary levels during the financial crisis (late 2000s). Since the early 2000s, the PE ratio has been trending lower with the very significant but relatively brief exception that was the financial crisis. More recently, the PE ratio has moved slightly higher. It is worth noting, however, that even with this recent uptick, the PE ratio still remains at a level not often seen since 1990.

Quote of the Day
“I conceive that the great part of the miseries of mankind are brought upon them by false estimates they have made of the value of things.” – Benjamin Franklin
Stocks of the Day
Find out which stocks investors are focused on with the most active stocks today.
Which stocks are making big money? Find out with the biggest stock gainers today.
What are the largest companies? Find out with the largest companies by market cap.
Which stocks are the biggest dividend payers? Find out with the highest dividend paying stocks.
Notes:
Where’s the Dow headed? The answer may surprise you. Find out right now with the exclusive & Barron’s recommended charts of Chart of the Day Plus.
“Friends of Fed chief Ben Bernanke say that Bernanke may not want a second term as Fed head. The Russell opinion is that Bernanke realizes that he is losing his war against the primary trend, and that he has had enough.” “I believe the bear is angry and is re-establishing himself.”
“Many subscribers think that Richard Russell is a perpetual bear and that nothing will turn him bullish. They could not be more wrong. I call ’em the way I see ’em. In 1957 I built my business on my lone bullishness, and I wrote a bullish article for Barron’s in late 1957 which sought to prove that a bull market was still in force, despite almost universal bearishness at the time (the nation was in the throes of a severe recession at the time).”
“Back in late 1974, I stood alone as probably the only bullish analyst in the business. What I mean to say is that I call it the way I see it, based on my own reading of the market, and regardless of what the popular opinion is at the time. Frankly, I would love to be bullish today, for the sake of my business and for the sake of my five children and for the sake of the United States, the land that I love.
I’ve stated that a primary bear market started in October 2007, with the Dow at 14,164, and that the same primary bear market is still in force. The period of 2009 to its recent high was an upward correction, a ‘breather’ that came within the confines of the continuing bear market.
As I write this, I believe that the bear market is resuming. The ‘breather’ convinced many experts and name analysts that a new bull market had arrived. I disagreed. The Bernanke Fed came in with their QE4 to infinity, and that further convinced many analysts that the worst was behind us and that the Fed had the situation well in hand.
I said that we were seeing a contest between the Federal Reserve along with their manipulative efforts versus the great primary trend of the market. The more powerful of the two would be the winner. Of course, the Fed was fighting one of the most flagrant series of non-confirmations in the D-J Averages that I have ever seen.
The Dow plowed higher until it appeared that a new high in the Dow was almost guaranteed. Then, at the last minute, the market turned down, which is where we are now. As I write the Dow is down 208 points. Over recent days, the Dow has lost almost 500 points. Thus, I believe the bear is angry and is re-establishing himself.
The period between now and election time will be beyond ordinary analysis. Whether the Federal Reserve will intervene is open to question. Now something new has been added. Friends of Fed chief Ben Bernanke say that Bernanke may not want a second term as Fed head.
The Russell opinion is that Bernanke realizes that he is losing his war against the primary trend, and that he has had enough. He is ready to bow out gracefully. Thus, the Bernanke Fed may be content to step aside and allow the stock market to have its way.
(Monday), I said that I wouldn’t put it past the Fed to buy Dow stocks near the close. At one point yesterday, the Dow was down over 100 points. It struck me as very strange to see the Dow drift back to minus 10 near the close, and then at the last minute the Dow turned plus by 2 points. And this with NYSE breadth down.
Therefore, I cannot imagine a better time for the Fed to come in and buy Dow stocks or maybe buy the DIAs. And no, I’m not getting paranoid. It’s getting so that I just don’t believe anything that comes out of Washington anymore.
To put it mildly, with multi-billions of dollars involved in this crazy election, why wouldn’t the Fed be manipulating the market? The Fed has bought just about everything else, so why not the Dow?
The chart below brings the Dow up to date. The Dow is now trading completely under its 50-day moving average. RSI and MACD are at about oversold, so it would not be surprising to see the Dow rally a bit from here.

Late Notes — Gold at 1709, and still testing its 1700 support level. It’s amazing how gold dribbles down day after day but still holds its 1700 support level — at least, so far.”
To subscribe to Richard Russell’s Dow Theory Letters CLICK HERE.
Russell also offers a TRIAL. (two consecutive up-to-date issues) for $1.00 (same price that was originally charged in 1958). Trials, please one time only. Mail your $1.00 check to: Dow Theory Letters, PO Box 1759, La Jolla, CA 92038 (annual cost of a subscription is $300, tax deductible if ordered through your business).
Richard Russell publishes a detailed Daily comment, the latest Primary Trend Index (PTI) figure for the day will be posted on his web site — posting will take place a few hours after the close of the market. Also included will be Russell’s comments and observations on the day’s action along with critical market data. Each subscriber will be issued a private user name and password for entrance to the members area of the website.if you subscribe to his Letter that is published and mailed every three weeks. To subscribe go HERE
Below are two of the most widely read articles published by Dow Theory Letters over the past 40 years. Request for these pieces have been received from dozens of organizations. Click on the titles to read the articles.
“Rich Man, Poor Man (The Power of Compounding)“
There’s one asset class that appears tailor-made to thrive in inflationary times…
Make no mistake. I know how horrible the inflation I expect will be for most Americans. But all I can do about it is try to position my readers to keep pace with the inflation that’s coming.
And these stocks are one of the best ways I know to do that…
There’s a reason many professional investors, including myself, believe insurance is the best business in the world.
Few individual investors understand why this is so…
One of my overriding goals is to give you the knowledge I’d want to have if our roles were reversed. When it comes to insurance and insurance stocks, I can only beg you to pay close attention. I believe if individuals would limit themselves to only investing in insurance companies – and no other sector – they would greatly increase their average annual returns. There’s no other sector of the market where I believe that’s true.
There’s a simple reason for this, which everyone can understand, immediately. It’s completely intuitive. But I’m pretty sure your broker has never explained it to you…
Insurance is the only business in the world that routinely enjoys a positive cost of capital. In every other business, companies must pay for capital. They borrow through loans. They raise equity (and most pay dividends). They pay depositors. Everywhere else you look, in every other sector, in every other type of business, the cost of capital is one of the primary business considerations.
But a well-run insurance company will routinely not only get all the capital it needs for free, it will actually be paid to accept it.
The best insurance companies make sure the fees they charge for capital are in excess of the risks they accept by extending insurance. These companies actually make a profit on their underwriting. They earn money by taking the capital of their customers. It’s incredible. These firms compound their equity by simply opening their doors every morning. They don’t have to do anything else. Nothing else in business is like it.
As legendary investor Warren Buffett explained in his 2011 letter to Berkshire Hathaway shareholders…
 Insurers receive premiums upfront and pay claims later. In extreme cases, such as those arising from certain workers’ compensation accidents, payments can stretch over decades. This collect-now, pay-later model leaves us holding large sums – money we call “float” – that will eventually go to others
Meanwhile, we get to invest this float for Berkshire’s benefit… If our premiums exceed the total of our expenses and eventual losses, we register an underwriting profit that adds to the investment income our float produces. When such a profit occurs, we enjoy the use of free money – and, better yet, get paid for holding it.
The beauty of insurance is that you can get paid to use capital. That’s a fantastic way to become very wealthy. And it’s precisely how (along with several great stock picks) Buffett became the world’s most successful investor.
The nature of this business gives Berkshire – and other insurance firms who can earn a profit with their underwriting and their investments – a truly mind-boggling advantage. And that’s not the only one.
Their other huge advantage – and it’s a doozy – is that they don’t have to pay taxes on those underwriting gains for many, many years because on paper, they haven’t technically earned any of the float until all of the possible claims on the capital have expired. So unlike most companies that have to pay taxes on revenue and profits before investing capital, Berkshire and other insurance companies get to invest all the float, without paying any taxes for years and years and years.
These companies, then, are sensitive to increased economic activity (which leads to more insurance being sold), interest rates (thanks to their float, they are extremely leveraged to the capital markets), and inflation.
Let’s assume I’m right, and the value of the U.S. dollar is going to collapse. If that happens, the dollars these insurance companies are collecting in premiums today will be invested with the full purchasing power the dollar has now. But they will only pay out claims over the next 10 or 20 years… when the value of that dollar will have fallen by 50% or more.
This inflation/time arbitrage almost guarantees big profits for the entire industry.
The biggest gains will go to the companies that earn a profit on their underwriting – that is, they collect more in premiums than they pay out in claims. Inflation will make future claims more expensive. (Prices will rise and damages will rise with them.) But inflation will also push up the value of the investments the insurance companies make – especially those firms that make equity investments.
I’m telling my readers to buy insurance stocks because I believe inflation will increase the size of policies sold… increase the return on float… and enable these companies to profit from the time arbitrage of inflation. (The dollars paid today in premiums will be worth substantially more than those same dollars paid back later.)
I also believe we have an investment opportunity in the insurance sector that only comes up every 20 years or so.
Financial stocks of all stripes have taken a beating since the financial crisis of 2008/2009. That will discourage many readers from buying these stocks, as lots of my more inexperienced readers still prefer to chase this year’s hot stock or trendy sector. I can only shake my head.
As the financial stocks and the insurance sector recover, I expect top-shelf insurance firms to perform well. That means… you might not have an opportunity this good in insurance stocks again for another 20 years… maybe ever.
Good investing,
Porter
|

-
I know Mike is a very solid investor and respect his opinions very much. So if he says pay attention to this or that - I will.
~ Dale G.
-
I've started managing my own investments so view Michael's site as a one-stop shop from which to get information and perspectives.
~ Dave E.
-
Michael offers easy reading, honest, common sense information that anyone can use in a practical manner.
~ der_al.
-
A sane voice in a scrambled investment world.
~ Ed R.
Inside Edge Pro Contributors

Greg Weldon

Josef Schachter

Tyler Bollhorn

Ryan Irvine

Paul Beattie

Martin Straith

Patrick Ceresna

Mark Leibovit

James Thorne

Victor Adair