
Stocks & Equities
Market Buzz – ETFs 101 – Using Exchange Traded Funds (ETFs) to Enhance Your Portfolio
Exchange Traded Funds or ETFs are a highly versatile investment product that every active investor should make themselves fully aware of. They operate much like mutual funds in that they pool capital together to build a portfolio that is invested with specific objectives. Each investor owns a share of the fund and can redeem or sell units when they request. As a relatively new investment product, ETFs are designed to track (generate an identical return) to specific market sectors and indexes. You can buy an ETF that tracks the overall market in Canada, the market in a foreign country like China or India, a specific sector like technology or mining, or a commodity like gold or oil. Unlike mutual funds, ETFs trade like stocks, so instead of buying and redeeming a unit at its net asset value (as with mutual funds), you buy units at a price based on supply and demand, which can be above or below net asset value (but is usually fairly close).
So say you decide that you want to gain exposure to the investment returns in an emerging market like China. First of all, foreigners are forbidden to purchase a company trading on the Shanghai Stock Exchange (SEE), and even if they weren’t, where would you start? No problem, just purchase one of the several ETFs that track the index. What if you want to gain exposure to gold? You’re not naïve enough buy bullion that is stored in the Cayman Islands and you don’t have the time or the industry knowledge to start researching a bunch of gold miners. Just buy the ETF.
Passive Investing versus Active Investing
One of the most important decisions that a portfolio manager must make (whether it be a professional portfolio manager or a private individual managing their own portfolio) is whether to invest actively or passively. Active investors spend time researching investments in order to outperform the market, whereas passive investors either don’t believe it is possible to outperform the market or just don’t want to spend the required time. The passive investor simply wishes to generate a return that mimics the overall market return. One of the key differences between mutual funds and ETFs is that the vast majority of mutual funds are actively managed while nearly all ETFs (with only a few exceptions) are passively managed.
The main argument for passive investing over active investing is that over 80% of actively managed mutual funds do not outperform the market over time. Even though you are paying professional managers a hefty fee (averaging about 2% of invested assets) to generate superior returns to the market, statistically most will be unsuccessful in doing. This does not mean that you should only invest passively; there are numerous examples of skilled money managers who have generated superior returns for clients in up and down markets. However, if you are simply relying on some cookie cutter, Large-Cap mutual fund to do the job, you will probably end up disappointed; and you will be even more disappointed to find out that you paid your manager 2% + of your total invested assets to underperform a passive fund that only charges 0.5%.
The good news is you don’t necessarily have to choose between active and passive investing. There is a third choice, the hybrid approach, where you allocate a portion of your portfolio to passive investing and a portion to active investing. The hybrid investor recognizes that opportunities do exist to find undervalued investments that offer the potential for higher returns. But this investor also recognizes that investing actively also carries additional risk, requires an investment of time, and that good undervalued opportunities are not always plentiful. The exact allocation would depend on the characteristics of the investor. An investor that makes the 20%/80% between passive and active investing has a high level of confidence in either themselves or their manager to outperform the market. The investor that makes the 80%/20% allocation has substantially less confidence in the active strategy, but does not want to miss out on rare opportunity to make a great investment.
Passive Mutual Funds (Index Funds) versus ETFs
Although the majority of mutual funds are actively managed, there are also some passively managed vehicles which are referred to as index funds. Much like ETFs, index funds attempt to mimic the return of the overall market index, specific sectors or even commodities. We are not averse to investing in index funds; in fact we adamantly support them as an alternative to investing in actively managed mutual funds. In trust, there are several pros and cons with regard to investing in ETFs as opposed to index funds. One favourable characteristic that is unique to ETFs is the ‘in kind’ redemption which provides tax deferral for unit holders. When an index fund sells stock to fulfill redemption requests, the capital gain tax liability is spread amongst the unit holders, regardless of whether or not they are redeeming. Investors in ETFs can realize return by either selling their units on the open market or by exercising the ‘in kind’ redemption, whereby they would receive a basket of securities proportional to the units they are redeeming. In either instance, no tax liability is incurred by investors who are not redeeming units. For the investor that redeemed ‘in kind’, tax liability would only be incurred if they sell from the basket of securities they received (assuming there is a capital gain of course).
Understanding Discounts and Premiums
Because ETFs trade like stocks, their prices often hover above or below the net asset value contained within the fund. If the ETF is selling for more than its net asset value, it is trading at a premium, if it is selling for less, it is trading at a discount. There are a number justifiable reasons that if the premium or discount is small, then its impact should be minimal, but in some cases the difference could be significant and it can affect the return on your investment. A good example would be an ETF that tracks the return of a foreign country that restricts foreign investment. This ETF will typically trade at a premium to net asset value because it is one of the few methods that can be used to access this market. If however, the government of this foreign entity decides to loosen the restrictions on foreign investment, then the premium is likely to decline significantly and so is the value of your investment. This is a single example of how premiums and discounts on ETFs work. While I don’t suggest you try to speculate on the movement of the premium (which defeats the purpose of ETFs), it is important that you understand how it can affect your return.
How to Buy ETFs
A great thing about ETFs is that they are extremely easy to buy and sell. They trade on an exchange and like any stock, they can be purchased through a discount brokerage. You simply need to decide what ETFs you want to buy, get the trading symbol, and enter your limit order with your discount broker. Two institutions that offer ETFs in Canada are iShares (www.ishares.com) and Claymore Investments (www.claymoreinvestments.ca). You can also find additional information on ETFs at Yahoo Finance Canada (www.ca.yahoo.finance.com/etf) and Globeinvestor (www.globeinvestor.com/v5/content/etf_hub/).
Contact KeyStocks: By Email | By Phone: 1-888-27-STOCK or 604-273-1118
KeyStone’s Latest Reports Section


After surging sharply in August and early September, gold stocks have been consolidating sideways ever since. Naturally this loss of momentum has sapped the nascent trader enthusiasm for this sector. But stalling out temporarily certainly doesn’t negate gold stocks’ dazzling fundamentals. They remain deeply undervalued relative to gold, the metal that drives their profits and hence ultimately their stock prices.
While sentiment (greed and fear) dominates short-term stock-price swings, over the long run stock prices are nearly exclusively determined by fundamentals. Investors buy stocks to own fractional stakes in the underlying companies’ profit streams. The bigger those profits grow, the higher the stocks are bid of the companies earning them. And for gold stocks, the gold price controls the vast majority of profitability.
Unlike most other companies, gold miners effectively have infinite demand for their product. They can easily sell every single ounce of gold they manage to produce. They never have to discount, the market price is what they get. And with mining costs largely fixed, higher gold prices flow directly into bottom-line profits. And because of these fixed costs, profits rise much faster than the underlying gains in gold.
This profits leverage is easy to understand. Imagine a miner selling gold today for $1700 that it produced for $700. Its profit is $1000 per ounce. But if gold rises 25% to $2125, profits would surge to $1425 since production costs are essentially fixed as mines are planned and built. That’s a 43% increase in profits driven by a 25% gold rally! This profits-leverage growth is more exponential than linear as gold climbs.
…..read much more beginning 4 paragraphs above this this chart HERE


FABER BIGGEST WARNING YET – Global Crash Coming! Dr. Doom, Marc Faber, warns of a global crash. He discusses China, as well as gold’s next move. “Unfortunately I have a lot of dollars,” he said. “I just want to have a lot of cash because I think that within the next six to nine months we can buy just about anything 20 percent lower than it is now.” ….more on Marc’s personal website HERE
Key Points on the video below: Marc Faber vs Jim Rogers @ the 4:30 minute mark. Faber vs Rogers on Surviving in The Money Printing Environment @ the 9:10 minute mark.
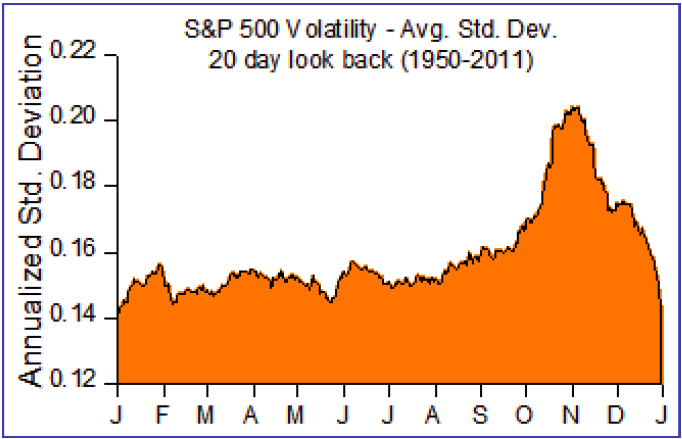
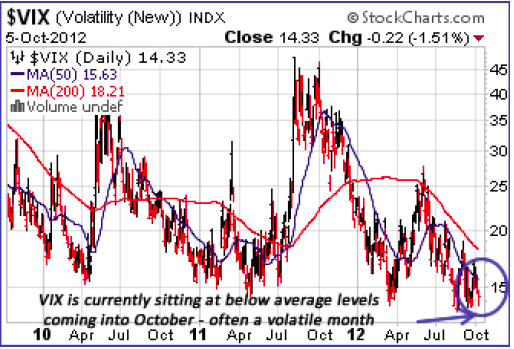
Time In Time Out: Outsmart the Stock Market Using Calendar Strategies, my first seasonal book, written in 1999, I performed a basic seasonal volatility analysis. Investors often use the CBOE Volatility Index (VIX), which was originally designed in 1993 to measure the market’sexpectation of 30-day volatility implied by at-the-money S&P 100 Index (OEX) option prices. Although calculating seasonal volatility from the VIX is a good current measure of volatility, VIX data does not go back as far as I would like to establish a trend in a broad market. As a result, I have approximated volatility as a dispersion of end of day prices for the S&P 500 using a twenty day standard deviation look back. Although there is a time lag issue with this methodology, it does give a general indication of a spike in volatility in October. The month of October, on average has the highest volatility. The point is that volatility in October can present opportunities to increase equity positions. Last year the market corrected severely in September and the market started a strong rally at the beginning of October. HAC increased equity positions early in October to 30% last year. This year, without a major correction in September to “bounce” the market at the beginning of October, investors should lean towards adding their equity towards the end of October.
It is interesting to note that the volatility in the stock market,as represented by the VIX is historically low, during October, which on average has the highest volatility. This divergence is interesting and indicates that the market is very complacent and is susceptible to a large correction.
The weakest part of October occurs from the 19th to the 27th. From 1950 to 2011, this time period has produced an average loss of 0.8% and has been positive 56% of the time. Even taking out the huge correction on October 19th, 1987, the numbers are still weak. If another large drop does occur in mid-October to late October, it should be viewed as an opportunity.
….to read the entire Brooke Thackray Market Letter go HERE
More Proof they Crush the Market
In the past week, I came across an article in the Globe and Mail which highlighted an investment approach that sounded strangely familiar. The strategy was based on a paper entitled “Value Investing: The Use of Historical Financial Statement Information to Separate Winners from Losers,” authored by Chicago accounting Professor Joseph Piotroski. The paper focused on stocks with high book/market ratios (the inverse of the price/book ratio). Mr. Piotroski realized that some high book/market stocks might be inexpensive for good reason – financial distress. These we would like to avoid.
To compensate for this risk, Piotroski ran high book/market stocks (those in the market’s top 20%) through a variety of accounting-type tests to make sure they were on solid financial footing. Mr. Piotroski showed that from 1976 through 1996, a portfolio that was long high book/market stocks that passed his tests, and short those that did not, would have produced a 23% annualized return – more than double the S&P 500’s return over that period. One Canadian fund manager who is now employing a 10-stock Piotroski-inspired portfolio stated in the article that it has been the best performer of his Canadian portfolios this year. Strangely enough, 2 of the 4 stocks mentioned from the portfolio are current BUY recommendations from KeyStone.
Of course this is why the strategy seems so familiar. It has been used for half a century as part of the tool box for some of this world’s most successful investors including, an investor you may have hear a little bit about, Mr. Warren Edward Buffett.
It is part of the strategy we have employed at KeyStone for the past 14 years.
While not revolutionary, we thank the Globe and the professor for highlighting the dramatic success this type of company specific investing can produce long term in a focussed growth stock portfolio. True, it is not as sexy or easy as following a pair of squiggly trend lines on a graph that will purportedly lead you to some euphoric truth about a stock. But, it works.
In fact, a modified version of this strategy was used in our “2012 Cash Rich, Profitable Small-Cap Stock Report” – Highlighting Great Cash Rick, Cash Producing Takeover Opportunities. The report has produced tremendously positive results and we are currently preparing our 2013 version for release.
Each year, the Special Report literally takes months to complete as we scan through all TSX and TSX Venture listed Micro to Mid-Cap stocks (with a weighting towards the mid-range Small-Cap stocks) using our own blend of fundamentals, cash flow, current cash, etc. and narrow our list down to about 65 individual companies on which we perform statistical analysis and management interviews if necessary. From here, we narrowed our list to 14 companies from varying industries to highlight in our report.
The Results for 2012
In the 7 Months since our Cash Rich, Profitable Small-Cap Report was published;
1. 12 of the 14 Stocks Highlighted Have Posted Positive Gains
2. 4 of the 14 Stocks Highlighted Have Already Been Acquired (Takeovers) – Miranda Technologies Inc. (MT:TSX), La Mancha Resources Inc. (LMA:TSX), WGI Heavy Minerals Incorporated (WG:TSX), and Lifebank Corp.
3. 7 of the 65 Total Stocks Already Been Acquired (Takeovers)
4. Strong Gains Achieved in an Environment when the S&P/TSX Composite Index has Gained Only 3.8% Year-to-Date.
Sign-up for our Small-Cap Research Special Offer today via our special offer to gain access to our 2013 Cash Rich, Profitable Small-Cap Report – Do not miss out this year!
It is gratifying to see that we are looking for value and growth in the right areas and with the right methodology.
Invitation to an “Evening with Michael Campbell”
Finally, we end this week’s edition with a personal invite from our friend Michael Campbell who is hosting an evening with market prognosticator David Bensimon.
Date: Wednesday, October 10, 2012
Time: 6pm-9pm
Place: The Hyatt Regency, Vancouver
Click here for a personal invitation from Michael Campbell: http://moneytalks.net/featuring-david-bensimon.html
KeyStone’s Latest Reports Section


-
I know Mike is a very solid investor and respect his opinions very much. So if he says pay attention to this or that - I will.
~ Dale G.
-
I've started managing my own investments so view Michael's site as a one-stop shop from which to get information and perspectives.
~ Dave E.
-
Michael offers easy reading, honest, common sense information that anyone can use in a practical manner.
~ der_al.
-
A sane voice in a scrambled investment world.
~ Ed R.
Inside Edge Pro Contributors

Greg Weldon

Josef Schachter

Tyler Bollhorn

Ryan Irvine

Paul Beattie

Martin Straith

Patrick Ceresna

Mark Leibovit

James Thorne

Victor Adair