
Stocks & Equities
Dow skyrockets near 20,000 by 2014? In two years? Then crashes near 10,000 by 2016 presidential elections? Possible? You bet. Déjà vu 2007-2008.
So what’s your biggest risk as an investor? Listening and acting on the relentless manipulative B.S. from Wall Street’s media bulls in the next few years.

Last week USA Today suggested the stock market will soon set a new record high, “How high? How about an all-time high in six months, 16% higher in 12 months, almost 40% higher two years from now.” Yes, 40% said one bullish technician with a mega-bullhorn sounding the rally call for all bulls: “Now is the time to finally break out” of today’s secular bear market.
New secular bull market driving stocks up 40% in just two years, by 2014? Yes, halfway through the next presidential term the DJIA would have to rocket past the 2007 peak of 14,164 to a record close just under 20,000, ignoring GOP leaders warnings that gridlock of all tax, jobs and economic programs will continue if Obama is reelected.
Now compare that with my recent report that says the Dow would drop 20% by 2016,down near 10,000. But it’s not really an impossible scenario: The U.S. stock market could rise near 20,000 in the first two years of the next presidential term. Then by 2014, a global crisis could sink the Dow to 10,000 by the 2016 presidential elections, like 2008.
Wall Street never learned lessons of 2008, so we’re doomed to repeat
Repeating? Yes. Here’s why today’s stock market parallels the 2007-2008 run-up to Wall Street’s disastrous subprime credit meltdown. Remember, the Dow hit 14,164 in October 2007. Then lost more than 50% of market value, crashing to around 6,600 in March 2009. Get it? Lots can happen in two years. And unfortunately technicians can’t fit this kind of macro-volatility into their myopic equations.
How do I know? Earlier when I was publishing my own financial newsletter I developed a healthy skepticism of predictions made by technicians. One day with a commodities trader, after watching his two-minute ticker moves, I asked him about predicting the market two weeks down the road: No can do. Besides, they don’t want to. Like today’s high-frequency traders, they think short-term, in minutes, micro-seconds, not weeks.
Besides, too many variables. It’s tough enough just focusing on short-term technical numbers. In the process, they have to minimize other key analytical tools — fundamental analysis, MPT and macroeconomic trends — and speculate on Fed policies, fiscal cliffs, internecine partisan political wars, jobs, terrorist attacks, China’s exports, and so many other technically less-quantifiable big-picture factors for long-term predictions.
Warning: 93% of Wall Street’s message intentionally misleading B.S.
So if you remember nothing else today, here’s your big take-away: You can never trust Wall Street bulls, they’re lying to you 93% of the time. Studies tell us analysts signal “buys” vastly more than “sells.” And behavioral-science research tells us that bankers, traders and other market insiders are misleading us, manipulating us 93% of the time in their securities reports, PR, ads, speeches, sales material, in their predictions on television, cable shows and when quoted in newspapers and magazines.
Get it? It’s 13-times more likely that Wall Street’s telling you a lie than the truth. Yes, they’re manipulating you 93% of the time. They know your brain’s easy to manipulate. That’s just what they do. They can’t help themselves in today’s highly competitive world. And they’ll never change. So they always win, you always lose.
17 stupid statements bulls make to deny a bear recession
You have to “tune your B.S. detector to high,” as the great financial adviser Jane Bryant Quinn says in her classic “Making the Most Out of Your Money.” Quinn’s warning was reinforced with the publication of “Bull! 144 Stupid Statements from the Market’s Fallen Prophets,” which hit the book stores near the end of the 30-month recession a decade ago, after $8 trillion of the retirement money for 95 million Americans was wiped out.
We picked 17 of the stupidest statements made by Wall Street’s leading minds to illustrate their tendency 93% of the time to mislead and manipulate investors using hype, happy talk and pure biased B.S.
….read page 2 HERE


American society is becoming increasingly politically polarized. Indeed, a June Pew Research Center survey found that while philosophical divisions between groups based on race, education, income, religion and gender have remained largely flat since 1987, the division based on political differences has almost doubled during that same time and has ramped dramatically since 2009.

This trend is happening at the same time that people increasingly turn to online sources for their news. In particular, as Figure 2 indicates, non-traditional media outlets are gaining share at the expense of mainstream media, especially print newspapers. Barriers to entry for individuals creating and publishing content online are low – in effect democratizing content creation. This opens societies to a more diverse and free-ranging marketplace of ideas and opinions.

But it also creates challenges for individual publishers: Getting noticed among the thousands of others competing for mindshare is becoming harder. This is complicated further by the use of text messages and social media services such as Twitter to disseminate information, which limit the articulation of viewpoints to very brief messages. It is difficult to distill complex ideas into a 140-character tweet.
- Earnings may grow
- Valuations may increase
- Companies may pay dividends
Considering each of these individually:
1. Earnings growth – more specifically earnings per share growth. If earnings don’t grow, but just stay flat, then this term of the equity return equation would be zero. Where do corporate earnings come from? They come from economic activity. Earnings growth for the market as a whole ultimately comes from economic growth. If an economy stops growing, corporate earnings also might not grow, but they could still be positive.

Remember, however, that our professors in statistics classes usually went out of their way to teach us that “correlation does not equal causation.” In other words: Just because two things look related does not mean one necessarily caused the other. Similarly, a lack of apparent correlation does not necessarily mean a lack of causation. Many other factors could also be at play that cause direct correlations to appear to break down.


2. Valuations – P/E multiples can expand. As fear decreases and confidence increases investors are often willing to pay more for the same dollar of earnings. Hence even if earnings are flat stocks still have the potential to generate positive returns by people paying more for the same earnings. There are many measurements of earnings – last twelve months, forward twelve months, cyclically adjusted. Each has advantages and disadvantages. Overall valuations of stocks seem reasonable at today’s level in a historical context with a developed market P/E of 14 times and emerging markets at 12 times (measured by the S&P 500 and the MSCI Emerging Market index, respectively). We aren’t forecasting strong P/E expansion from here, though if left tail risks are reduced, it is certainly possible.
3. Dividends. Even if an economy were to stop growing, corporate profits were to stop growing and P/Es were to remain flat, stocks still have the potential to generate a positive return by paying dividends. Hence economic growth is not a hard ceiling on stock returns, but again the overall linkage between economic activity and corporate profits and dividends is clear. Economies that grow more quickly fuel corporate earnings that can then grow more quickly. Corporations that experience sustained growth and strong cash generation are more likely to pay and increase their dividends. In past decades when economic growth has been slower, dividends have been a larger share of equity returns than capital appreciation. Figure 6 shows equity returns by decade, broken out by capital appreciation and dividends. One can see in the slow growth 1970s dividends were a larger share of total equity returns. Given our New Normal outlook of continued sluggish economic growth, we believe investors should focus on companies with a strong ability to pay and grow their dividends.

- Active management becomes increasingly important. If we believed the equity market would provide very strong growth, then we’d believe the cheapest passive exposure to stocks would likely be enough. Unfortunately we don’t think that’s the case, so alpha generation or selecting stocks that can outperform the market as a whole, is essential to meeting overall return objectives.
- Look to companies that can grow faster than the market as a whole. Where a company is headquartered is not nearly as important as where it does business. The best way for a company to overcome the constraints of a slow domestic economy is to sell into higher growth economies. Sometimes companies headquartered in higher growth economies are best positioned to capitalize on them. Sometimes large multinationals are better equipped to take advantage of those growing markets. We believe investors should consider an unconstrained approach that allows investors to concentrate in the best companies, wherever they may be domiciled. In addition, some companies are able to out-compete entrenched players and take market share.
- Don’t overpay for companies. Look to well-run companies that sell into higher growth markets, but of course it doesn’t make sense to pay too high a price for them. We believe focusing on quality is a smart investment strategy, especially in a low growth environment with ever-present macro risks. But we believe a prudent investment approach should be anchored in a rigorous valuation framework. Sometimes buying a somewhat lower quality company at a steep discount makes more sense than overpaying for the highest quality company.
- Actively manage downside risk. This is a constant refrain of my colleagues and me at PIMCO. In the next six months there are several major policy drivers that each individually could overwhelm market fundamentals: the ECB’s actions to stabilize the eurozone, the U.S. Presidential election and the U.S. Fiscal Cliff. While we believe policymakers are well-intentioned and our base case scenario avoids left tails in the near future, political factors could constrain policymakers. We believe hedging against extreme downside risks is prudent, even if it means giving up a little on the upside.
So, as you can see, the story of stocks is more nuanced than one tweet, one headline or even one discussion. It is a story of assessing risks and balancing potential outcomes – one that presents real opportunities for investors even in a lower return environment utilizing a process grounded in both solid, bottom-up analysis and top-down, macro insights.
And yet the same hyperbolic polarization that we are seeing in our politics continues to extend to other subjects important to our lives. You may be wondering what the title of this piece, “The Cure for Baldness” has to do with equity investing. I must confess: nothing at all. I wanted a headline that would capture attention, and I know I have a lot of company among the fellow follically challenged in the investment industry.
Hyperbolic polarization during a Presidential election cycle shouldn’t be unexpected, and since we each only get one vote, for one candidate or the other, it really is all or nothing. Fortunately investing isn’t all or nothing. We can allocate to individual companies that we believe are positioned to grow faster than the market and those that we believe will be more resilient against market shocks. Given how hard people work over many years to save for their future and for their families, we believe it is worthwhile to take time to craft an investment strategy that can withstand a range of market outcomes. Reports of the death of smart investing have been greatly exaggerated (and the cure for baldness is right around the corner).
Past performance is not a guarantee or a reliable indicator of future results. All investmentscontain risk and may lose value. Equities may decline in value due to both real and perceived general market, economic, and industry conditions. Investing in foreign denominated and/or domiciled securities may involve heightened risk due to currency fluctuations, and economic and political risks, which may be enhanced in emerging markets. There is no guarantee that these investment strategies will work under all market conditions or are suitable for all investors and each investor should evaluate their ability to invest long-term, especially during periods of downturn in the market. Investors should consult their financial advisor prior to making an investment decision.
The correlation of various indices or securities against one another or against inflation is based upon data over a certain time period. These correlations may vary substantially in the future or over different time periods that can result in greater volatility.
This material contains the opinions of the author but not necessarily PIMCO and such opinions are subject to change without notice. This material has been distributed for informational purposes only and should not be considered as investment advice or a recommendation of any particular security, strategy or investment product. Information contained herein has been obtained from sources believed to be reliable, but not guaranteed. No part of this material may be reproduced in any form, or referred to in any other publication, without express written permission. ©2012, PIMCO.
Downside risk in North American equity markets exceeds upside potential in equity markets during the next 2-3 weeks prior to start of the third quarter earnings report season. Thereafter, prospects turn positive. Selected positive seasonal trades such as gold and energy have performed well, but are approaching their end of their period of seasonal strength. Similarly, selected negative seasonal trades such as Transportation and Semiconductors are approaching the end of their seasonal weakness. The time to take profits in these seasonal trades is rapidly approaching. Short term technical indicators will be useful for determining exit points. A new series of seasonal trades will appear as the end of October approaches.
The weakest period in the year for North American equity markets from September 16th to October 9th is happening again this year. This is the time of year when companies most frequently lower guidance prior to release of third quarter results (i.e. earnings confession season). Lots of examples last week including FedEx, Norfolk Southern and Bed Bath & Beyond! Possibilities of more frequent guidance declines this year are higher than usual. Third quarter year-over-year consensus for Dow Jones Industrial Average companies already calls for a 1.6% decline. Consensus for S&P 500 companies is a decline of 2.7% (down from 2.1% a week ago) despite a 20.2% gain by Apple Computer. Since release of second quarter reports, 80% of S&P 500 companies that changed guidance lowered their guidance. Consensus for TSX 60 companies is an average decline of 7.8%. Despite consensus estimates calling for lower earnings on a year-over-year basis, consensus estimates appear too high and likely will continue to fall prior to release of third quarter results.
Macro events outside of North America also will influence equity markets. A decision by Spain to ask the European Central Bank to purchase Spanish sovereign debt is scheduled on Thursday. The Eurozone consumer confidence index is released on Thursday.
U.S. economic news this week is expected to be mixed. Case-Shiller and Consumer Confidence on Tuesday are potential positive events. Weekly initial jobless claimes, Durable Goods Orders on Thursday and Chicago PMI and Michigan Sentiment on Friday are potential negative events.
Earnings reports this week are not expected to be significant. Focus is on Nike on Thursday.
Historically, North American equity markets have moved lower from mid- September to mid-October during a U.S. Presidential election year (particularly when the polls show a close election as is indicated this year. Thereafter, equity markets have moved higher until at least the beginning of January (The exception was the year 2000 when confirmation of President Bush as President was delayed until January 2001).
Cash on the sidelines is substantial and growing. However, political uncertainties (including the fiscal cliff) preclude major commitments by investors and corporations before the Presidential election.
Equity Trends
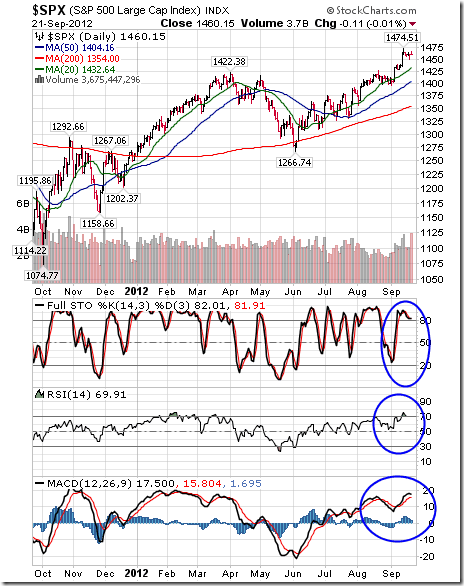
The S&P 500 Index slipped 5.62 points (0.38%) last week. Intermediate trend is up. The Index remains above its 20, 50 and 200 day moving averages. Short term momentum indicators are overbought and showing early signs of rolling over (e.g. a fall by RSI below its 70% level on Friday).
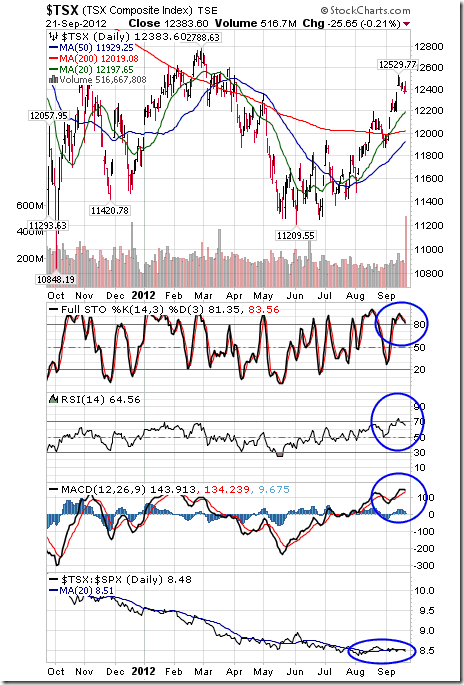
The TSX Composite Index fell 115.87 points (0.93%) last week. Intermediate trend is up. The Index remains above its 20, 50 and 200 day moving averages. Short term momentum indicators are overbought and showing early signs of rolling over (e.g. RSI falling below the 70% level). Strength relative to the S&P 500 Index remains neutral.
Ed Note: to view another 44 charts on Equities, Currencies and Commodities go HERE
For more than a decade, I’ve used a simple quiz to guide my investments.
This quiz has helped my Retirement Trader readers close 61 consecutive trades with a profit. And it’s allowed myRetirement Millionaire readers to safely make more than 20% per year in regular stocks.
This quiz takes less than 30 seconds to complete. And if you start using it, you could drastically improve your investing results.
All you have to do to take the quiz is ask, “Does the company I’m investing in enjoy tremendous customer loyalty?
If the answer is no, chances are good that you should pass on the stock.
But if the answer is yes, chances are good that you’ve found a safe, long-term stock investment… one you can hold for years and compound wealth at 10%-15% per year.
Take Coca-Cola for example. Coke enjoys customer loyalty because its products taste good. They are consistent. They are everywhere. And for less than a dollar, a customer can enjoy a brief bit of pleasure. Since 1995, Coke’s shareholders are up 250%, including dividends.
Other great consumer brands like Hershey (chocolate) and McDonald’s (fast food) enjoy this loyalty as well.
These are familiar examples of “retail” loyalty. But there’s another little-known type of loyalty… This form of loyalty comes down to “switching costs” for larger companies.
You see, when a company is considering moving its business from one service provider to another, it must consider the costs.
Take Microsoft, for example. If your 500-employee office is used to using Windows and Office software, it’s going to be difficult for your company to ever switch to new software.
If your company is going to switch 401(k) providers or payroll managers, there’s going to be a big cost. If it’s going to switch the phone system it uses on thousands of phones, there’s a big cost. A company might think another service provider would be better, but it won’t ever switch from its current provider because the “switching costs” are too high.
This means constant sales and insulation from competition for Microsoft, communication equipment provider Cisco, and tech giant IBM. Since 1995, IBM investors have seen a total return of more than 1,100%.
No matter what form it comes in, loyalty ensures a constant and unrelenting demand for products… which keeps profit margins high and sales growth strong. It also helps insulate a company from competition… which is a crucial attribute for a long-term investment.
Remember… in the “survival of the fittest” world of capitalism, a business must get every possible bit of insulation from upstart competitors. Otherwise, it will eventually fail and leave its shareholders empty-handed.
By now, most DailyWealth readers know that owning great dividend-paying businesses is the key to long-term stock market success. These companies get you on the road to compounding.
These businesses are almost always identified by their extreme customer loyalty. And this loyalty ensures big profit margins, steady sales growth, and extreme resistance to competition. Plus, they allow you to sleep well at night. These are the sorts of companies I look for in my advisories.
And all it takes to recognize them is a 30-second quiz.
Here’s to our health, wealth, and a great retirement,
Dr. David “Doc” Eifrig
Retirement Trader is written by Dr. David Eifrig Jr., MD, MBA. David worked for major Wall Street banks (including Goldman Sachs) before retiring, going to medical school, and becoming an ophthalmologist. Now, in his latest “retirement,” David is sharing the trading and investing secrets he learned while working for the Street.
With over 32 years of investing experience “Doc” (as we call him around here) Eifrig will show you how to apply simple and safe investment strategies, used by many of the elite trading desks on Wall Street.
Twice a month, Doc will show you step-by-step how to extract more money from the markets than you knew possible. From insight into the market’s safest investments in high yielding stocks, to selling options on below book value businesses, to uncovering cheaply priced warrants and convertible bonds, Retirement Trader covers a wide range of investment strategies, all designed to improve your retirement and your portfolio.
Subscribe Now | Click here to learn more.

Consumers are paying down debt rather than spending, businesses leaders remain nervous and governments across Canada are unlikely to invest in further economic stimulus unless something major threatens our recovery. TD Economics’ latest quarterly outlook for the Canadian economy is a mixed bag at best. Next year will be better, we mean it this time.
The report makes a number of predictions about Canada and global factors that could impact our economy:
- The economy will grow, but not dramatically. Real gross domestic product (GDP) growth will be 1% this quarter, 1.8% in Q4 and plus-2% throughout 2013. Diana Petramala, an economist with the bank, told me that what’s holding us back has less to do with the 2008 financial crisis than it does with other, more systemic factors. “The first is poor productivity performance,” she said. “The second is our aging population. The labour force isn’t growing as fast as it has in the past … We’re pretty much growing right at our potential growth rate.”
- Federal and provincial governments will spend less, and may even raise taxes. Despite Prime Minister Stephen Harper’s comments last week, we shouldn’t count on further government stimulus. This will have a negative effect on economic growth. Petramala told me that if the domestic economy went into a sustained downturn, then of course this wouldn’t be the case. “But we think that the economic environment will start to improve in 2013 and government will have the capacity to remain on-track and get their budgets balanced,” she said.
- Consumer spending will be relatively soft. Relative to income levels though, consumer and household debt will remain high. “Incomes aren’t growing as fast as they have in the past,” said Petramala. Still, a lot of consumers have gotten the message about debt. “In the last quarter, we saw the savings rate rise from 3.1% to 3.6%. So it’s not that they can’t go out and spend, it’s that they’re choosing to focus more on restraint.”
- The Canadian housing market is 10% over-valued on average, and prices will come down accordingly. We’re not looking at a crash. Prices are expected to come down over a two- to three-year period. Vancouver and Toronto are over-valued by something more like 15%.
- Business spending, particularly among exporters, will start to pick up next year. There’s still uncertainty in Europe, the U.S. and in emerging markets. This all contributes to the Canadian economy’s weakness in the short term. But next year and the year after will see a 7% to 10% boost in business spending according to TD Economics.
- The Bank of Canada’s overnight interest rate isn’t moving until the second half of 2013. Expect a 50-basis point increase next year, followed by the same again in 2014. From there, look for gradual steps to “bring the overnight rate back to a more normal level,” Petramala told me. One of the effects of the latest round of quantitative easing in the U.S. is that “the Bank of Canada won’t be able to go as quickly as maybe it would like.”
A couple of other interesting calls: the U.S. recovery will strengthen next year; we’ll see more positive growth in the eurozone and emerging markets; and crude oil will hit US$102 per barrel.


-
I know Mike is a very solid investor and respect his opinions very much. So if he says pay attention to this or that - I will.
~ Dale G.
-
I've started managing my own investments so view Michael's site as a one-stop shop from which to get information and perspectives.
~ Dave E.
-
Michael offers easy reading, honest, common sense information that anyone can use in a practical manner.
~ der_al.
-
A sane voice in a scrambled investment world.
~ Ed R.
Inside Edge Pro Contributors

Greg Weldon

Josef Schachter

Tyler Bollhorn

Ryan Irvine

Paul Beattie

Martin Straith

Patrick Ceresna

Mark Leibovit

James Thorne

Victor Adair