Stocks & Equities

Fed Pulls Trigger – New Pumping Begins

The Federal Reserve fulfilled expectations of more stimulus for the faltering economy, taking aim now at driving down mortgage rates until an improvement in unemployment that the central bank says will be a problem for several years.  Ben Bernanke recently spoke of the benefits of “non-traditional policies”

The US central bank has announced it will resume its policy of pumping more money into the economy via so-called quantitative easing. The Federal Reserve said it will “increase policy accommodation by purchasing additional agency mortgage-backed securities at a pace of $40bn per month”. Interest rates in the US have been close to zero for several years now. 

The purchases will be open-ended, meaning that they will continue until the Fed is satisfied that economic conditions, primarily in unemployment, improve. 

“The committee is concerned that, without further policy accommodation, economic growth might not be strong enough to generate sustained improvement in labour market conditions,” said the Fed, led by chairman Ben Bernanke

The stock market, which had been slightly positive prior to the decision surged while bond yields, particularly farther out on the curve, jumped higher.

(Ed Note: Chart below taken at 12.45 pm PST)

Screen Shot 2012-09-13 at 12.51.02 PM

Gold and other metals gained at least 1 percent across the board while the dollar slid against most global currencies. (Ed Note: Gold chart taken at 12:58 PST)

Screen Shot 2012-09-13 at 12.56.49 PM

“There’s strong hints that they’ll do Treasurys next,” Joe LaVorgna, chief economist at Deutsche Bank Advisors, said in a phone interview from London. “They’re pulling out all the stops to try to get this economy to gain some traction and, most important, to get unemployment down.”  (Ed Note: It would seem that investors are thinking the Fed will act next on Treasurys as T-Notes rallied back to their pre-announcement levels. Chart taken at 1.06 pm PST)

Screen Shot 2012-09-13 at 1.03.31 PM


…read more:

Fed’s Stimulus Move Ignites Wall Street

Fed Bets Big in New Push To Rescue Economy

Federal Reserve to buy more debt to boost US Economy


The Little Guy Has an Advantage

Picture 2

perspectives commentary

The Canadian market is likely to start catching up to the US market which has outperformed year to date, This week’s Market Minutes video highlights shows how. Check it out by clicking here. (Ed Note: The Outlook for Canadian Stocks, US Stocks, Gold & Oil is are in Tyler’s Sept. 10th Market Minutes video)

I wrote a new book over the summer, it will be available in a pre-release version to Stockscores users before the end of the year. Over the next few weeks I will share excerpts from the book, The Mindless Investor – Make Money in the Market by Overcoming Your Common Sense. Here is a piece from the chapter, The Little Guy Has an Advantage.

Performance Is Easier with Less Capital
Assuming you don’t have hundreds of millions of dollars or more in your trading account, you have an advantage over any fund manager. It’s a lot easier to double $100,000 than to make a 100% return with $100 million, $1 billion or $10 billion. With a method that is appropriate for the amount of capital you have to invest, you can beat the market, and doing so is easier with a relatively small amount of capital.

The key, of course, is having a good method for trading the market-one that gives you the ability to beat the market. With that and a relatively small pool of capital, you can outperform even the most successful big money managers.

As an individual investor you can choose strategies that require you to move in and out of stocks quickly, to hold them only when they are trending and to get out when the trend is losing momentum. Since the size of your positions will be relatively small, you can buy and sell quickly and without a significant impact on the price you pay when you buy or the price you receive when you sell.

You can trade opportunities that can only be taken advantage of if the trade size is small. One of my strategies requires that I buy stocks as close to the open of the trading day as possible. This strategy works well, but there are few stocks that trade actively enough to absorb a trade of more than half a million dollars in the short time this strategy requires. A large investor could never make these trades and have an impact on the performance of the fund.

The Right Approach for the Capital You Have
The less capital you have to trade with, the less your ability to do in-depth analysis of the companies you buy. Analyzing a company’s business properly takes time, knowledge and costly resources. When you try to compete with large investment funds on this level, it’s unlikely that you can produce better results than a fund that has industry experts and millions of dollars to devote to research.

But you can be on a level playing field with the big investment funds if you use stock charts and trading data to make your decisions. This information is easily available and comes at a low cost. Whether you’re a large or small investor, you look at the same stock chart.

There are advantages to being small. As an individual investor, you can probably enter and exit any trade in just seconds. You have a greater opportunity to beat the market because the market-beating opportunities you find can have a dramatic effect on the overall value of your portfolio. Provided you have the knowledge and discipline to trade well, it is better to manage your own money than to leave it to someone who has a large amount of capital to invest on behalf of many people. Not because the person running an investment fund lacks skill, but simply because the challenge of beating the market increases as the capital under management goes up. With an approach that matches your capital base, you can beat the big funds.

perspectives strategy

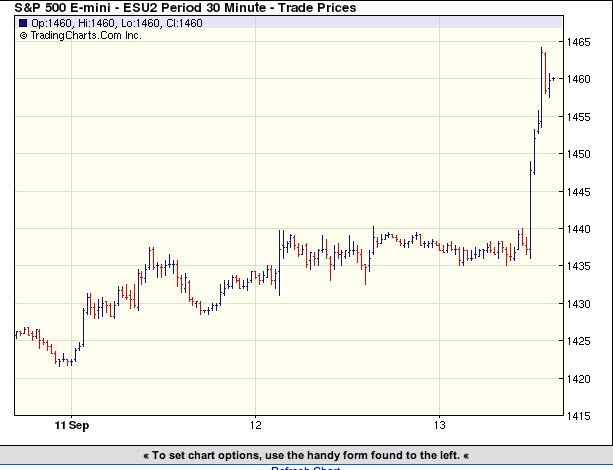
The US markets have moved up in anticipation of stimulus from the ECB and US Fed. We have already learned of Europe’s plan to lower interest rates through the purchase of short term bonds and this week we will hear if the US Fed will do anything stimulative.

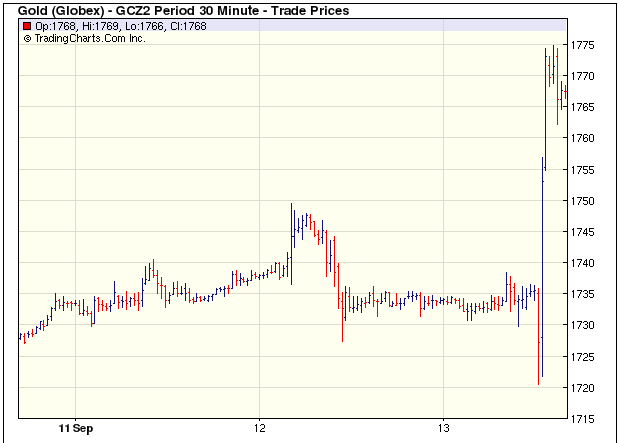
The market has been speculating that there will be action by the US Fed, causing stocks to go higher and the US Dollar to go lower. We are now seeing money rotate in to the commodity and financial sectors.

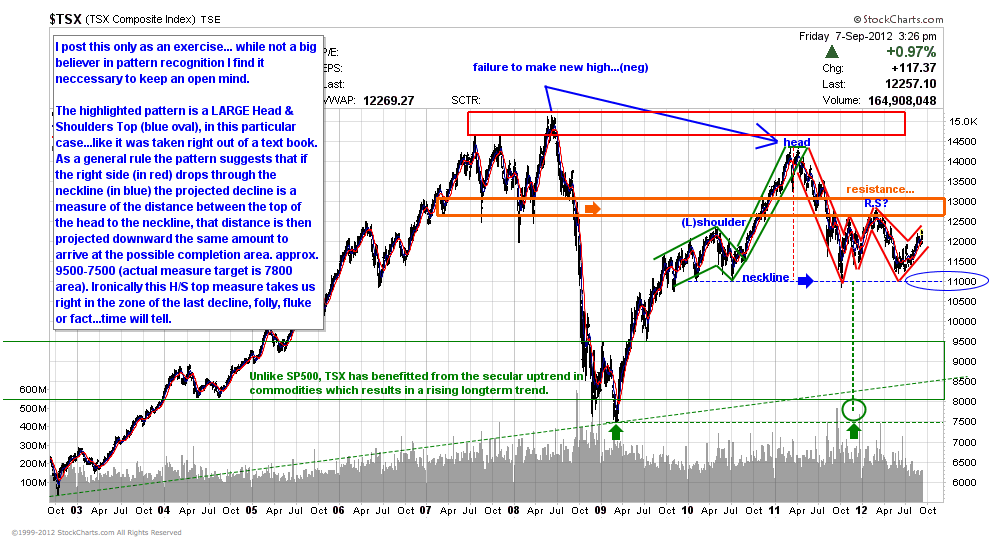
If the Fed does take stimulative action this week, expect that the Canadian market will benefit the most. The TSX has underperformed the US market this year and has a lot of catching up to do. A rotation in to commodity stocks will help the TSX improve its performance.

This week, I did my Market Scan for Canadian stocks with good charts. Here are a few names to consider:

perspectives stocksthatmeet

1. V.MEI

Breaking out from a long term cup and handle pattern with strong volume today, looks likely to continue the strength it has shown over the past couple of months. Support at $1.80.
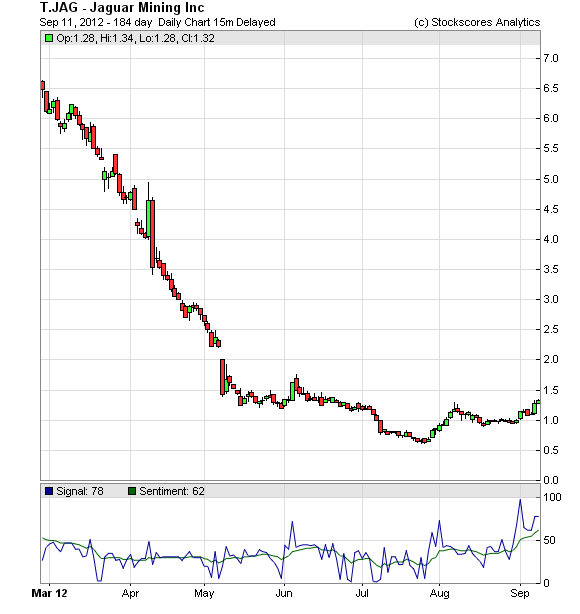
chart 1

2. T.JAG

I featured this in my daily newsletter (available at www.tradescores.com) on Monday, the stock appears to be in the early stages of a turnaround. Support at $1.09.

chart 2

References

  • Get the Stockscore on any of over 20,000 North American stocks.
  • Background on the theories used by Stockscores.
  • Strategies that can help you find new opportunities.
  • Scan the market using extensive filter criteria.
  • Build a portfolio of stocks and view a slide show of their charts.
  • See which sectors are leading the market, and their components.

    Disclaimer
    This is not an investment advisory, and should not be used to make investment decisions. Information in Stockscores Perspectives is often opinionated and should be considered for information purposes only. No stock exchange anywhere has approved or disapproved of the information contained herein. There is no express or implied solicitation to buy or sell securities. The writers and editors of Perspectives may have positions in the stocks discussed above and may trade in the stocks mentioned. Don’t consider buying or selling any stock without conducting your own due diligence.

Gold Stocks: History Argues for More Upside

Gold and silver stocks are not only the most volatile sector but the highest beta sector. Therefore the percentage moves can be quite exaggerated relative to the market. Currently, the shares have emerged from a W bottoming pattern. They have gained substantially (in percentage terms) in just the past month. I wanted to consult history and in particular the rebounds following the bottoms in 2000, 2005 and 2008 to get a sense of the reasonable upside potential over the coming months. Judging from history, one should not be alarmed about the recent gains because these rebounds tend to run much longer and higher.

Below we chart the HUI in weekly form dating back to 2000. We also plot the HUI’s rate of change for 18 weeks and 26 weeks (equivalent to four and six months) and we note the length of time it took the HUI to break to a new high following the start of the cyclical bears. The market typically rebounds 50%-70% four months following a bottom and roughly 75% six months after a bottom.

sep10huied

If the HUI rebounds 50% from the May 2012 low then we are looking at a target of 558 by or in October. That target is essentially on par with the Q1 2012 high of 555. Secondly, a six month rebound of 65% would take the HUI to 615 (exactly the level of the red line) by or in December. Even if these targets are hit a month or two later, we still would experience a bullish outcome. Keep these targets in mind as we move to short-term analysis.

Next we chart GDX, GDXJ and SIL. In recent days these markets achieved significant breakouts on ‘gap up’ moves. Monday’s action is a strong signal that these markets could fill their open gaps (see circles) and then retest previous resistance which is now support. GDX is very comparable to the HUI. The initial rebound target for the HUI (558) is equivalent to GDX $57. Furthermore, $57 is the 62% retracement (from the 2011 high to 2012 low) and the target from the length of the W bottoming pattern ($48-$39 = $9, $9+$48=$57).

sep10edall

While gold and silver equities have had a strong run, they have only broken out from their multi-month bottoming patterns. A retreat and fill of the gaps would alleviate the current overbought condition, temper sentiment a bit and facilitate another strong leg higher. Moreover, judging from history, this rebound still carries substantial upside potential in the coming months. Traders and investors should look to take advantage if the miners fill their gaps and retest the breakout. If you’d be interested in professional guidance in uncovering the producers and explorers poised to outperform then we invite you to learn more about our service.

Good Luck!

Jordan Roy-Byrne, CMT
Jordan@TheDailyGold.com

The Daily Gold

Twitter: TheDailyGold

Skype: Trendsman

The Bottom Line

The Bottom Line

Downside risk exceeds upside potential in equity markets during the next six weeks. The breakout by the S&P 500 Index last week implies that depth of the downside risk is less than previous. Selected seasonal trades continue on the upside (gold, energy, software) and downside (transportation). However, many of these seasonal trades reach the end of their period of seasonal strength this month. September is a month of transition. Trade accordingly.

Equity Trends

The S&P 500 Index gained 26.79 points (1.90%) last week. Intermediate trend is up. The Index broke above resistance at 1,426.68 to reach a four year high. The Index remains above its 50 and 200 day moving averages and moved above its 20 day moving average. Short term momentum indicators have rebounded to overbought levels.

 clip image001_thumb4

The TSX Composite Index added 185.78 points (1.54%) last week. Intermediate trend is up. The Index broke above resistance at 12,196.77 on Friday. The Index remains above its 50 day moving average and moved above its 20 and 200 day moving averages last week. Short term momentum indicators have recovered to overbought levels. Strength relative to the S&P 500 Index has changed from negative to at least neutral.

 clip image006_thumb4

Seasonality refers to particular time frames when stocks/sectors/indices are subjected to and influenced by recurring tendencies that produce patterns that are apparent in the investment valuation.   Tendencies can range from weather events (temperature in winter vs. summer, probability of inclement conditions, etc.) to calendar events (quarterly reporting expectations, announcements, etc.).   The key is that the tendency is recurring and provides a sustainable probability of performing in a manner consistent to previous results.

Identified below are the periods of seasonal strength for each market segment, as identified by Brooke Thackray.   Each bar will indicate a buy and sell date based upon the optimal holding period for each market sector/index.

Picture 1

….go HERE to view Equity Clock’s Seasonality Chart for 26 other individual sectors, Commodities, Bonds etc.

Other Issues

Two unexpected events last week triggered a surprising upside move in equity markets last week, China’s $150 billion fiscal stimulus package announced on Thursday night and the ADP report showing a gain in U.S. private employment in August instead of a loss. Gains were muted on Friday when the less than expected U.S. employment report was released.

The economic focus this week is on the FOMC meeting. The Fed widely is expected to announce an additional monetary stimulus program that probably will include the purchase of mortgage backed securities by the Fed that effectively will replace Operation Twist that is expected to expire at the end of the month. However, the effectiveness of a new program is somewhat suspect. At best, it may reduce mortgage rates slightly, but mortgage rates already are near all-time lows. Importance of an additional monetary stimulus program is psychological (Investors relate monetary stimulus to higher equity prices). If the Fed chooses not to introduce another stimulus program, equity markets are vulnerable to significant short term downside risk. If the Fed chooses to go beyond a token purchase (or promise to purchase) mortgage backed securities, equity markets will move higher. The Fed in order to show political neutrality is unlikely to act beyond the September FOMC meeting until after the election.

U.S. economic news other than the FOMC meeting is expected to be neutral to slightly bearish for equity markets this week (higher trade deficit, higher inflation, higher inventories, lower consumer sentiment, but continuing strength in retail sales).

Macro events outside of the U.S. once again focuses on China this weekend and Europe later this week. Negotiations between ECB President Draghi and Greece continue on Tuesday. The German constitutional court rules on the eligibility of ECB lending on Wednesday. The Netherlands holds parliamentary elections on Wednesday.

Short and intermediate technical indicators for most equity markets and sectors improved last week but have returned to overbought levels.

North American equity markets have a history of moving lower from September to mid-October during a U.S. Presidential election year(particularly when polls show a tight race as indicated this year). Thereafter, equity markets move higher.

Cash on the sidelines on both sides of the border is substantial and growing. However, political uncertainties (including the Fiscal Cliff) preclude major commitments by investors and corporations before the Presidential election.

….read more & view 50 charts on Commodities, Interest Rates, Currencies HERE


Juggling Dynamite – The Case For a 4000 Point TSX Drop

Big picture charts offer some helpful perspective on where we are at after the wild jolts of taxpayer-funded capital injections the past few years. Canada–hardware store to a world where 82% of manufacturing data is now contracting–continues to look weak and vulnerable. We can also look forward to a more normal cyclical recovery in stocks (note the slower, steady price action from the bottom in 2002-03 until the credit mess blew in 2006) one day once central banks stop flooding and let slow demand find its own organic level.

Click on chart or HERE for larger image. 

TSX-Sep-7-2012

Source: Cory Venable, CMT, Venable Park Investment Counsel Inc.

by Danielle Park of Juggling Dynamite

About Danielle

Portfolio Manager, attorney, finance author and a regular guest on North American media, Danielle Park is the author of the best selling myth-busting book “Juggling Dynamite: An insider’s wisdom on money management, markets and wealth that lasts,” as well as a popular daily financial blog:www.jugglingdynamite.com

Danielle worked as an attorney until 1997 when she was recruited to work for an international securities firm.  Becoming a Chartered Financial Analyst (CFA), she now helps to manage millions for some of North America’s wealthiest families as a Portfolio Manager and analyst at the independent investment counsel firm she co-founded Venable Park Investment Counsel Inc.www.venablepark.com.  In recent years Danielle has been writing, speaking  and educating industry professionals as well as investors on the risks and realities of investment behaviors.

A member of the internationally recognized CFA Institute, Toronto Society of Financial Analysts, and the Law Society of Upper Canada.  Danielle is also an avid health and fitness buff.