
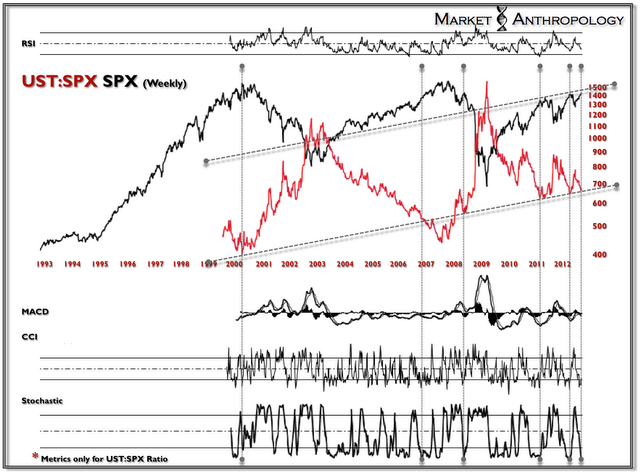
As the market sets sail into what historically has been the most treacherous month of the year (September) – a number of my analog and comparative charts continue to flash warning signals as they extend themselves up to resistance (UST:SPX ratio), into historical extremes (Apple) and into possible momentum downturns (2007/2012 SPX Analog). (Ed Note: The UST:SPX ratio is the 10 Yr US T-Note Price / S&P 500 Large Cap Index)
Stocks & Equities
Evidence Mounts
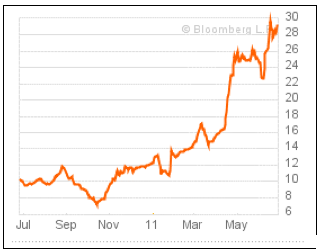
Apple continues to defy gravity with its parabolic run over the past year. If past is prologue, this parabolic performance chase of the largest market-cap company in the world will mark a major equity market top when the tide turns. It is not a question of if – but when – and the pronounced head and shoulders formation on the MSWORLD index is approaching another turn lower this coming fall.

I have been contrasting aspects of the 2007 daily and hourly tapes over the past several years because of the fractal similarities along various timeframes to the current market. This past spring the market began tracing out a broadening top/megaphone formation that was very similar to the structure of the 2007 market – right before it broke down and established the inverted head and shoulders formation – also a pronounced structure of the 2007 tape. This was initially detailed Here and then subsequently in the following notes, Here and Here.

The weekly analog has extended itself further then where I had anticipated it would turn. This may be considered well past an audible – however, it did so in a similar fashion this past March as it worked its way to the pivot lower in April.
Perhaps it is my own bias of perspective, but if it were not for the seasonality, the agreement of various charts – also including the Aussie model that continued to turn down last week – I would be willing to retire the comparison.
I am not.
As always – Stay Frosty.

George Soros and Warren Buffett are two of the world’s most successful investors. While Buffett holds stocks for the long term, Soros is more likely to trade in and out of positions with greater frequency.
Both of their viewpoints overlap on eight stocks. The largest positions they hold in common are: Walmart (WMT), Kraft (KFT), DirecTV (DTV), DaVita (DVA) and Johnson & Johnson (JNJ).
Walmart (WMT)
Warren Buffett owns 46,708,142 shares of WMT, valued as $3.3 billion as of June 30, 2012, which accounts for 4.4% of his equity portfolio. George Soros owns 4,831,800 shares of WMT, valued as $337 million as of June 30, 2012, which accounts for 4.9% of his equity portfolio.
Walmart Stores Inc. is the world’s largest retailer. Walmart Inc. has a market cap of $243.99 billion; its shares were traded at around $72.59 with a P/E ratio of 15.4 and P/S ratio of 0.6. The dividend yield of Walmart stocks is 2.2%. Walmart Inc. had an annual average earnings growth of 11.3% over the past 10 years. GuruFocus rated Walmart the business predictability rank of 5-star.
Walmart in its second quarter reported earnings per share increased 10.1% from the previous quarter, and revenue increased 6.4%, with its fourth consecutive quarter of positive comp sales. Net sales at Walmart International grew 6.4%. The company raised and narrowed its full-year EPS guidance to a range of $4.83 to $4.93 from its previous range of $4.72 to $4.92.
…to read about each of the other 4 stocks go HERE
To print or not to print? Odds are that Fed Chairman Bernanke has been contemplating this question while drafting his upcoming Jackson Hole speech. The one good thing about policy makers worldwide is that they may be fairly predictable. As such, we present our crystal ball as to what the Fed might be up to next, and what the implications may be for the U.S. dollar and gold.

First off, we may be exaggerating: on process rather than substance, though. That is, Bernanke isn’t just thinking about whether to print or not to print as he is sitting down to draft his speech. Instead, he considers himself a student of the Great Depression and has been pondering policy responses to a credit bust for some time. Consider the following:
- Bernanke has argued that going off the gold standard during the Great Depression helped the U.S. recover faster from the Great Depression than countries that held on to the gold standard for longer.
- Bernanke is correct: subject to many risks, debasing a currency (which going off the gold standard was) can boost nominal growth. Think of it this way: if the government takes your purchasing power away, you have a greater incentive to work. Not exactly the mandate of a central bank, though.
- Note by the way that by implication, countries that hold on to the gold standard invite a lot of pain, but have stronger currencies. Fast forward to today and compare the U.S. to Europe. While neither country is on the gold standard, the Federal Reserve’s balance sheet has increased more in percentage terms than that of the European Central Bank since the onset of the financial crisis. Using a central bank’s balance sheet as a proxy for the amount of money that has been “printed”, it shouldn’t be all that surprising that the Eurozone experiences substantial pain, but the Euro has been comparatively resilient.
- Possibly the most important implication: Bernanke considers the value of the U.S. dollar a monetary policy tool. When we have argued in the past that Bernanke might be actively working to weaken the U.S. dollar, it is because of comments such as this one. This is obviously our interpretation of his comments; a central banker rarely says that their currency is too strong, although such comments have increasingly been made by central bankers around the world as those pursuing sounder monetary policy have their economies suffer from competitive devaluations elsewhere.
- Bernanke has argued that one of the biggest mistakes during the Great Depression was that monetary policy was tightened too early. Here’s the problem: in a credit bust, central banks try to stem against the flow. If market forces were to play out, the washout would be severe and swift. Those in favor of central bank intervention argue that it would be too painful and that more businesses than needed would fail, the hardship imposed on the people is too much. Those against central bank intervention point out that creative destruction is what makes capitalism work; the faster the adjustment is, even if extremely painful, the better, as the recovery is healthier and stronger.
- If the policy choice is to react to a credit bust with accommodative monetary policy, fighting market forces, and then such accommodation is removed too early, the “progress” achieved may be rapidly undone.
- We are faced with the same challenge today: if monetary accommodation were removed at this stage (interest rates raised, liquidity mopped up), there’s a risk that the economy plunges right back down into recession, if not a deflationary spiral. As such, when Bernanke claimed the Fed could raise rates in 15 minutes, we think it is a mere theoretical possibility. In fact, we believe that the framework in which the Fed is thinking, it must err on the side of inflation.
Of course no central banker in office would likely ever agree with the assessment that the Fed might want to err on the side of inflation. But consider the most recent FOMC minutes that read:
- An extension [of a commitment to keep interest rates low] might be particularly effective if done in conjunction with a statement indicating that a highly accommodative stance of monetary policy was likely to be maintained even as the recovery progressed
As the FOMC minutes were released three weeks after the FOMC meeting, many pundits dismissed them as “stale”; after all, the economy had somewhat improved since the meeting. Indeed, it wasn’t just pundits: some more hawkish Fed officials promoted that view as well. But to make clear who is calling the shots, Bernanke wrote in a letter dated August 22 (the same date the FOMC minutes were released) to California Republican Darrell Issa, the chairman of the House Oversight and Government Reform Committee: “There is scope for further action by the Federal Reserve to ease financial conditions and strengthen the recovery.” Various news organizations credited the faltering of an incipient U.S. dollar rally on August 24 with the publication of this Bernanke letter.
For good order’s sake, we should clarify that the Fed doesn’t actually print money. Indeed, printing physical currency is not considered very effective; instead, liquidity is injected into the banking system: the Fed increases the credit balances of financial institutions in accounts held with the Fed in return for buying securities from them. Because of fractional reserve banking rules, the ‘liquidity’ provided through this action can lead to a high multiple in loans. In practice, one of the frustrations of the Fed has been that loan growth has not been boosted as much as the Fed would have hoped. When we, and Bernanke himself for that matter, have referred to the Fed’s “printing press” in this context, referring to money that has been “printed”, it’s the growth in the balance sheet at the Federal Reserve. That’s because the Fed’s resources are not constrained; it’s simply an accounting entry to pay for a security purchased; that security is now on the Fed’s balance sheet, hence the ‘growth’ in the Fed’s balance sheet.
Frankly, we are not too concerned about the environment we are in. At least not as concerned as we are about the environment we might be in down the road: that’s because we simply don’t see how all the liquidity can be mopped up in a timely manner when needed. At some point, some of this money is going to ‘stick’. Even if Bernanke wanted to, we very much doubt he could raise rates in 15 minutes. To us, it means the time for investors to act may be now. However, talking with both existing and former Fed officials, they don’t seem terribly concerned about this risk. Then again Fed officials have rarely been accused of being too far sighted. We are concerned because just a little bit of tightening has a much bigger effect in an economy that is highly leveraged. Importantly, we don’t need the Fed to tighten: as the sharp selloff in the bond market earlier this year (and the recent more benign selloff) have shown, as soon as the market prices in a recovery, headwinds to economic activity increase as bond yields are rising. That’s why Bernanke emphasizes “communication strategy”, amongst others, to tell investors not to worry, rates will stay low for an extended period. This dance might get ever more challenging.
In some ways, Bernanke is an open book. In his ‘helicopter Ben’ speech a decade ago, he laid out the tools he would employ when faced with a collapse in aggregate demand (the credit bust we have had). He has deployed just about all tools from his toolbox, except for the purchase of foreign government bonds; recently, he shed cold water on that politically dicey option. Then two years ago, in Jackson Hole,Bernanke provided an update, specifying three options:
- To expand the Fed’s holdings of longer-term securities
- To ease financial conditions through communications
- To lower the interest rate the Fed pays on bank reserves to possibly 10 basis points or zero.
We have not seen the third option implemented, but the Fed might be discouraged from the experience at the European Central Bank: cutting rates too close to zero might discourage intra-bank lending and cause havoc in the money markets.
![]()
As such, expect Bernanke to give an update on his toolbox in Jackson Hole. The stakes are high as even doves at the Fed believe further easing might not be all that effective and could possibly cause more side effects (read: inflation). As such, we expect him to provide a framework as to why and how the Fed might be acting, and why we should trust the Fed that it won’t allow inflation to become a problem. For investors that aren’t quite as confident that the Fed can pull things off without inducing inflation, they may want to consider adding gold or a managed basket of currencies to mitigate the risk to the purchasing power of the U.S. dollar.
Please sign up to our newsletter to be informed as we discuss global dynamics and their impact on gold and currencies. Please alsofollow me on Twitter to receive real-time updates on the economy, currencies, and global dynamics.
Axel Merk
President and Chief Investment Officer, Merk Investments
Merk Investments, Manager of the Merk Funds
Engage Us – Have a Question? Click Here to Ask

I moved to the sidelines Tuesday Aug 21 after being bullish the US stock market for the past couple of months. I posted a note on my blog Tuesday Aug 21 about my “change of heart.”
On Aug 20 I had said that I would remain long until the market told me that it was no longer going up…well, I think we got a signal that the short term rally is running out of steam. I did NOT go short…the trend remains up from the June 4, 2012 lows, the Oct 4, 2011 lows and the March 2009 lows…as my long time friend Dennis Gartman says, “In a bull market there are only three different positions you can have, long, really long or aside.”
The “psychological set-up” for what looks to be at least a short term top had several parts:
1) the VIX, the fear index, had closed at a 5 year weekly low close Aug 17…no worries mate,
2) the DJI had closed Aug 17 at its highest weekly close since Dec 2007,

3) the DJI had rallied ~10% from the June 4 lows…on very low volume and could easily have been seen as short-term overbought,
4) the story of Apple’s rising market cap was becoming increasingly public…the “news” that it had eclipsed the previous All Time High Market Cap set by Microsoft years ago hit the “front pages” all over the world on Monday…and on Tuesday APPL jumped to new all time highs early in the day…dragging the overall market with it…and then turned lower…taking the overall market down,
5) the S+P 500 share index briefly traded to new highs for the year on Tues Aug 21, and to its best levels since May 2008, but then turned lower,
6) The Spanish and Italian stock markets turned lower early Tuesday, after being the hottest stock markets in the world since Draghi’s famous, “We will do whatever it takes” comment July 26,
7) US bond yields, which had been trending higher since July 26, turned lower Tues Aug 21.
The DJI dropped 300 points from Tuesday’s highs to Friday’s lows. It rallied back Friday on media comment suggesting that QE3 is coming soon….and perhaps also rallied back on short covering after a quick 3 day drop…the market has, after all, been climbing a wall of worry for nearly 3 months…the 300 point drop in the DJI may have been only a brief correction.
QE3: There was a lot of speculation this past week about QE3…especially following the release of the Fed minutes on Wednesday. There were public comments from Fed members and lots of media comment. The timing of QE3 is particularly in question with the Jackson Hole meetings at the end of this week and the November elections looming….it would seem that if the Fed is going to start QE3 they have to act soon.
In precious metals the sequence of the rallies had Platinum first out of the gate (Aug 16) with specific impetus from the violence at the South African mine, then Silver broke out (Aug 20) and lastly Gold broke out (Aug 21.) The PMs had been in a narrowing range for the past few months and a breakout appeared imminent. The upside breakout in gold on rising open interest is positive…but I was not a buyer…either I was too slow to see the opportunity or a little suspicious of the move in the thin markets of late August …or both.
Trading: I start this week virtually flat in my short term trading accounts…looking for worthwhile trading opportunities…and hoping to trade what the market is doing…rather than what I think it should be doing!
Article provided by:
Drew Zimmerman
Investment Advisor
Union Securities Ltd. | Vancouver, BC
Tel: 604-646-2031 | Fax: 604-646-2067
Email: dzimmerman@union-securities.com
Web: www.union-securities.com
Victor Adair
Victor Adair is a Senior Vice President and Derivatives Portfolio Manager at Union Securities Ltd. Victor began trading financial markets over 40 years ago and has held a number of senior positions during his long career as a commodity and stockbroker. He provides daily market commentary on CKNW AM 980 radio Vancouver and is nationally syndicated on Mike Campbell’s weekly Moneytalks radio show. Victor’s trading focus is primarily on the currency, precious metal, interest rate and stock index markets and his clients are high net worth individuals and corporations.
You can reach Victor Adair at:
The Bottom Line
Equity markets on both sides of the border have had a good ride since their lows on June 4th. Now they are showing short and intermediate technical signs of an intermediate peak. It’s time to take profits in selected seasonal trades such as agriculture and leisure & entertainment. Other seasonal trades such as energy and gold have additional intermediate upside potential, but no longer are buy candidates. A cautious stance appears appropriate until the second half of October when upside opportunities are expected to re-appear.
Economic News This Week
The June Case/Shiller 20 City Home Price Index to be released on Tuesday at 9:00 AM EDT is expected to improve on a year-over-year basis from -0.7% to -0.3%.
The August Consumer Confidence Index to be released at 10:00 AM EDT on Tuesday is expected to slip to 65.5 from 65.9.
The Fed Beige Book is scheduled to be released at 2:00 PM EDT on Wednesday.
U.S. second quarter revised real annualized GDP to be released at 8:30 AM EDT on Wednesday is expected to be revised upward to 1.7% from 1.5%.
July Personal Income to be released at 8:30 AM EDT on Thursday is expected to increase 0.3% versus a 0.5% gain in June. July Personal Spending is expected to increase 0.5% versus no change in June.
Weekly Initial Jobless Claims to be released at 8:30 AM EDT on Thursday are expected to slip to 370,000 from 372,000 last week.
Canada’s June GDP to be released at 8:30 AM EDT on Friday is expected to slip to 1.6% on a year-over-year basis versus growth at 1.9% rate.
The August Chicago Purchasing Manager’s Index to be released at 9.45 AM EDT on Friday is expected to slip to 53.5 from 53.7 in July.
The August Michigan Consumer Sentiment Index to be released at 9:55 AM EDT on Friday is expected to remain unchanged at 73.6.
Other Issues
The VIX Index jumped 1.73 (12.9%) last week. Short term momentum indicators are trending higher from oversold levels.

The earnings focus this week is on the Canadian banks. Look for modest gains on a year-over-year basis. At least two of the banks are expected to increase their dividend.
Economic reports this week are expected to have a mildly negative impact on equity markets (Consumer confidence, Chicago PMI, Michigan consumer sentiment).
Macro news heats up this week. The focus is on Bernanke’s speech next Friday at 10:00 AM EDT and Draghi’s speech on Saturday morning. Other events to watch include Eurozone consumer confidence on Thursday and China’s PMI next Saturday (estimated to fall from 50.1 to 49.8).
Short and intermediate technical indicators for most equity markets and sectors are overbought and are showing signs of rolling over. Mary Ann Bartels, Merrill Lynch’s technical analyst predicted downside risk by the S&P 500 between now and the end of September at 8-10%. Following is a link from CNBC to her video: http://www.cnbc.com/id/48756751
North American equity markets have a history of moving lower from the beginning of September to mid-October during a U.S. Presidential election year (particularly when polls show a close race. Thereafter, equity markets move higher regardless of who wins.
September is the weakest month of the year for North American equity markets. This is the month that analysts review their estimates for the current year, realize their estimates are too high and revise them accordingly. History is about to repeat.
Other issues that could impact equity markets include Hurricane Isaac, the Republican convention and increasing media comments about the possibility of Israel attacking Iran before the Presidential election.
Cash on the sidelines on both sides of the border is substantial and growing. Bank of Canada’s Mark Carney highlighted the situation in Canada last week. However, political uncertainties (including the Fiscal Cliff) preclude major commitments by investors and corporations before the Presidential election.
Equity Trends
The S&P 500 Index slipped 7.03 points (0.50%) last week. Intermediate trend changed from neutral to up when the Index briefly moved above resistance at 1,422.38. However, the Index also recorded a bearish key reversal last Tuesday implying the likelihood of at least a short term peak. The Index remains above its 50 and 200 day moving averages, but is testing its 20 day moving average. Short term momentum indicators have rolled over from overbought levels and are trending down.
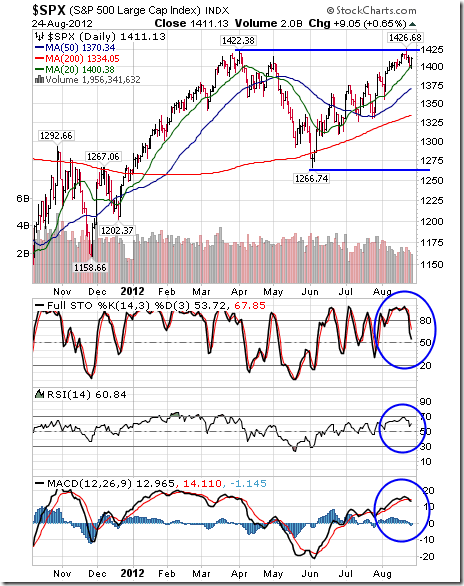
Percent of S&P 500 stocks trading above their 50 day moving average fell last week to 73.40% from 81.40%. Percent is intermediate overbought and has rolled over from above the 80% level, a frequent indicator that the Index has passed a short term peak.

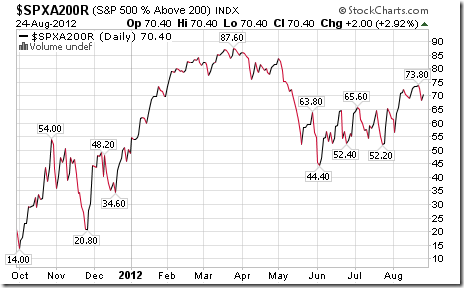
Percent of S&P 500 stocks trading above their 200 day moving average slipped last week to 70.40% from73.40%. Percent is intermediate overbought and showing early sign of peaking
The ratio of S&P 500 stocks in an uptrend to a downtrend (i.e. the Up/Down ratio) slipped last week to (279/127=) 2.20 from 2.26. Twenty three stocks broke resistance and 24 stocks broke support (mostly utility stocks).
Bullish Percent Index for S&P 500 stocks increased last week to 70.40% from 70.00% and remained above its 15 day moving average. The Index is intermediate overbought.

The Up/Down ratio for TSX Composite stocks increased last week to (151/73=) 2.07 from 1.72. Twenty stocks broke resistance and two stocks broke support.
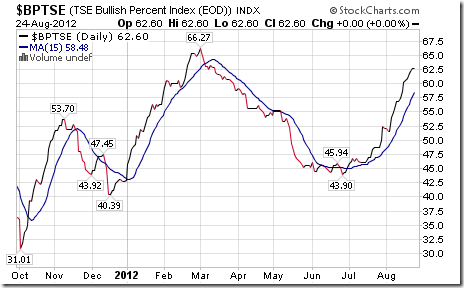
Bullish Percent Index for TSX Composite stocks increased last week to 62.60% from 60.57% and remained above its 15 day moving average. The Index remains intermediate overbought.
The TSX Composite Index slipped 7.66 points (0.06%) last week. Intermediate trend is up. The Index remains above its 20, 50 and 200 day moving averages. Short term momentum indicators are overbought and showing early signs of rolling over. Strength relative to the S&P500 Index has been negative, but is showing early signs of change.
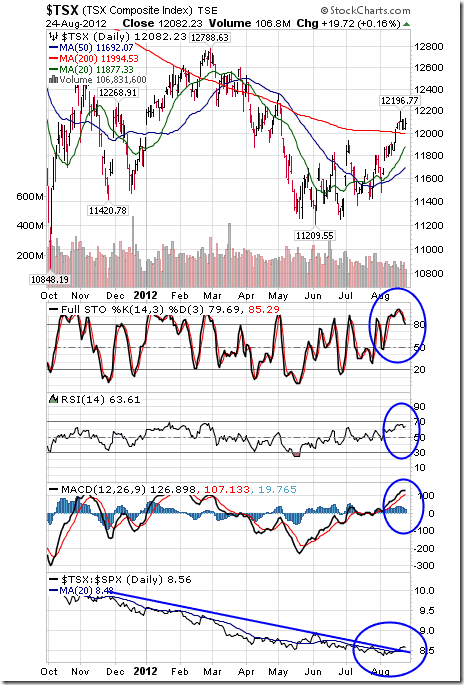
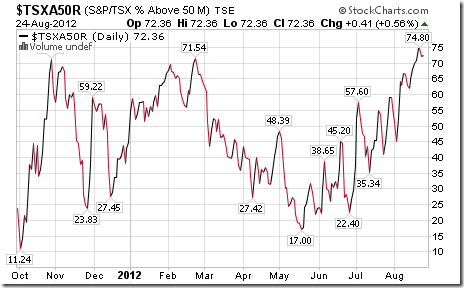
Percent of TSX stocks trading above their 50 day moving average increased last week to 72.36% from 69.92%. Percent is intermediate overbought above the 70% level. Peaks from above the 70% level normally lead to at least a short term correction by the Index.
Percent of TSX stocks trading above their 200 day moving average increased last week to 51.63% from 48.37%. Percent is intermediate overbought.
…..for 40 more charts and commentary go HERE
Don Vialoux
Don Vialoux has 37 years of experience in the Investment Industry. He is a past president of the Canadian Society of Technical Analysts (www.csta.org) and a former technical analyst at RBC Investments. Don earned his Chartered Market Technician (CMT) designation from the Market Technician Association in 1995. His CMT paper entitled “Seasonality in Canadian Equity Markets” was published in the Spring-Summer 1996 edition of the MTA Journal. Don also has extensive experience with Exchange Traded Funds (also know as Index Participation Units) as well as conservative option strategies. In 1990 he wrote a report that was released in the International Federation of Technical Analyst Journal entitled “Profiting from a Combination of Technical and Fundamental Analysis”. The report introduced ” The Eight Phases of the Stock Market Cycle”, an investment concept that continues to identify profitable entry and exit points for North American equity markets. He is currently a member of the Toronto Society of Fundamental Analyst’s Derivatives Committee. Now he is the author of a daily letter on equity markets available free on the internet. The reports can be accessed daily right here at www.dvtechtalk.com.
Impossible! That’s what institutional investors say about “Timing the Market”. Mr. Vialoux will explain that, indeed, it can be done with the appropriate analysis. He also will explain why timing the market will be important during the next decade. Buy and Hold strategies are not working anymore; Investors are looking for alternatives. Mr. Vialoux will demonstrate four techniques that can be used to time intermediate stock market swings lasting 5-15 months. The preferred investment vehicles for investing in intermediate stock market swings are Exchange Traded Funds.
Security positions held or not held by Mr. Vialoux will be indicated at the end of each Tech Talk report.
Comments in Tech Talk reports are the opinion of Mr. Vialoux. They are based on technical, fundamental and/or seasonal data that is believed to be accurate. The comments are free. Mr. Vialoux receives no remuneration from any source for these services. Comments should not be considered as advice to buy or to sell a security. Investors, who respond to comments in Tech Talk, are financially responsible for their own transactions.
All charts in Tech Talk come from StockCharts.com. Stock Charts can be accessed at no cost throughwww.stockcharts.com.

-
I know Mike is a very solid investor and respect his opinions very much. So if he says pay attention to this or that - I will.
~ Dale G.
-
I've started managing my own investments so view Michael's site as a one-stop shop from which to get information and perspectives.
~ Dave E.
-
Michael offers easy reading, honest, common sense information that anyone can use in a practical manner.
~ der_al.
-
A sane voice in a scrambled investment world.
~ Ed R.
Inside Edge Pro Contributors

Greg Weldon

Josef Schachter

Tyler Bollhorn

Ryan Irvine

Paul Beattie

Martin Straith

Patrick Ceresna

Mark Leibovit

James Thorne

Victor Adair