
Stocks & Equities
Peter Grandich: “The market itself is not what it once was. It has really become one big crap shoot. A week doesn’t go by when there isn’t news of somebody who has illegally or in some way didn’t go about it the right way, used the market to a disadvantage or advantage over the general public. And I also think that while that might have spooked the retail person out I believe that continues in many areas unabated. We saw just a few weeks ago a computer error, just one entry by a programmer almost wiped out and severely wounded a major brokerage house. That’s how big and bad the Casino has become and one day that will come back to bite us in a very bad way but for now its really become more like a casino than what was originally intended….a place where you could purchase part ownership in a business but that isn’t what really drives the market anymore”.
What really concerns Peter is the complacency of people who have accepted what the market has become, a place where more and more evidence comes forth that the markets are not fair, that it is heavily tilted against individuals. According to Peter there doesn’t seem to be any change coming, nor desire to change from the regulators who have accepted that it is the new norm”.
Markets are Rigged…So What?
Great gobs of money continue to drain away from stock mutual funds. And even some big-name investors have put up the white flag. Louis Bacon famously gave back $2 billion to his investors a couple of weeks ago because, he says, he can’t figure the market out.
This has led some to say that the era of stocks is over. “The cult of equities is dying,” writes the oft-quoted Bill Gross, who manages money at Pimco. “Like a once bright-green aspen turning to subtle shades of yellow then red in the Colorado fall, investors’ impressions of ‘stocks for the long run’ or any run have mellowed as well.”
Well, maybe…
I’m with David Goldman, who writes in the Asia Times under the penname Spengler that Gross is only “half-right.” The market, as always, has its enthusiasms. He writes:
Visible and reliable cash flows trade at an unprecedented premium as bond yields collapse. Valuations of utility, tobacco, energy trust and other big dividend payers are stupidly rich and are likely to remain so. A sea change in equity valuations has put a premium on secure cash flows while amplifying the effect of uncertainty. It is possible to measure these changes by a number of statistical means, some direct, some indirect.
Goldman points to mining stocks, which are very uncertain and have returned a negative 24% in the last two years. Utilities, by contrast, are very stable. Utilities have returned 30% in the last two years. That’s very frustrating for those holding mining stocks.
He offers more evidence, but you get the idea. Stable, predictable cash flows and yields are popular. Unstable, uncertain cash flows with no yield are not. (Eventually, this will break. Timing is, as always, uncertain.)
Second, I wonder if the points Gross raises are even relevant. I mean, investors have been yanking their money out of stock mutual funds since the crisis of 2008. The market has more than doubled since. And it is now within spitting distance of all-time highs.
Volume, liquidity, public participation in equities… All of these are overrated concepts. Market values can move dramatically with hardly any volume at all and be just as real as a change accompanied by lots of volume.
Beyond these objections, though, I think there is some truth to what Gross is saying.
I hear more and more people say the market is rigged against them. They say it is a game for insiders to fleece gullible outsiders. Wall Street has not helped this image at all. There seems to be no end to lurid scandals or crises of confidence in the system.
I have to say I, too, have felt this way more often of late. However, I believe there are ways to invest safely and feel good about it. You can ignore the scandals. You can ignore Wall Street.
One way does involve direct investments in stocks, but by paying careful attention to the tenets of what I call the CODE System:
- Cheap — as measured by stocks trading below replacement costs or below private market value
- Owner-operators — as measured by high insider ownership of the people in charge and/or a good track record of delivering results for shareholders
- Disclosures — which means a business we can understand and that reports results with good disclosures. Transparency is another word for the virtue we seek here
- Excellent financial condition — as measured by a relative absence of liabilities, lots of cash and/or cash flow and the ability to “do deals” (i.e., borrow at super-attractive rates, take advantage of opportunities, convert assets to other uses, etc.).
I like to call this philosophy “investing like a dealmaker.” It is one I’ve distilled from a decade of experience as a corporate banker doing deals, along with my own ongoing two-decade study of investing. Of course, I’ve also managed money on my own account all along the way.
Another way to beat rigged markets is to invest in funds or private partnerships that also pass the CODE test.
For example, you can easily buy shares in Gabelli’s Focus Five Fund (GWSVX). This is a fund with a well-defined mission and cut from a process that has produced stunning results. Own some shares and sit on them. Let portfolio manager Dan Miller do the hard work for you.
So my ultimate answer to Gross is this: Who cares? For those of us willing to dig, there are always plenty of opportunities — some of them in the stock market and some not. The question is not about any cult of anything. It’s about what makes sense and what doesn’t. Whatever other people do or think is irrelevant.
I’ve been particularly influenced by the ideas of Martin Whitman, who for years managed the Third Avenue Value Fund. He’s also written a pair of excellent, though technical, books that express similar ideas: Value Investing: A Balanced Approach and The Aggressive Conservative Investor. (Far less technical, though written in the same spirit, is my own first book, Invest Like a Dealmaker: Secrets From a Former Banking Insider.)
In my Capital & Crisis newsletter, I’ve been more draconian in applying the CODE of late, which in part has accounted for an itchy trigger finger in selling positions. The time to get tough is when the market is merrily rolling along. Before things roll over — not after. Otherwise, I’m happy to sit with my cash for a while until an extraordinary new opportunity opens up.
More time and care yield a much more-satisfying result. This is the way it is in life. Investing is no different. The results will be better and more satisfying than if we try to take shortcuts to find and trade more ideas. In my mind, it’s a lot like finding and eating good food.
Last night, we ate dinner on the back patio amid the hum of cicadas. We had basil from our garden, tomatoes from my in-laws’ garden and cheese from a local farm. Of course, it would be easier to just buy tomatoes and cheese from the grocery store. But it would not be the same.
I grilled chicken thighs over hardwood charcoal. (We raise chickens, but for eggs.) It’s a rare thing to do it this way nowadays. It takes more time. You have to light the fire and let the coals ash over and spread them around. The heat is uneven and you have to watch more closely what you are grilling.
I remember one little guest asking once, “What’s that?”
“Charcoal,” I said.
“Oh,” he said. “My dad just turns it on,” he said.
Yes, it would be faster to have an electric grill that you just turn on. But I can’t help but think of the words of that great eater (and cook and writer) Nicolas Freeling. “Nothing, of course, could be more stupid than an electric barbecue,” he writes in his classic The Kitchen Book. “The principle of a grill is that the food should meet smoke as well as heat.”
Of course, it would be much easier to just buy ticker symbols based on what you hear other people tell you on TV or what you hear in the news, rather than do all this research. But the result, like a store-bought tomato, is very different from the juicy blood-red tomato from a home garden. It is the difference between the work of an electric grill and that done by flames and smoke.
Everyone is always in a hurry, it seems to me. I say relax and slow down with your life and money. Enjoy, savor and seek out quality over quantity.
I just finished reading Bill and Will Bonner’s book, Family Fortunes: How to Build Family Wealth and How to Hold on to It for 100 Years. The key to old money — those long-lasting fortunes — boils down to one thing. “The secret is simply this,” the authors write: “The rich take the long view.”
They go on:
“If you look carefully, almost all ‘Old Money’ secrets can be traced to a single source: a longer-term outlook. The truly wealthy are careful to spend their money on things that hold their value over time…
“Serious Old Money investors barely follow the news and never react to it. They know that the really important trends take years to develop and then many years to play themselves out. You can take your time… months… years… before making a decision. There is no need to feel rushed…
“Investment success happens by taking big positions in big trends and leaving them alone for a long time.”
Not easy to do, but I think this is right. It is something to shoot for.
Regards,
Chris Mayer,
for The Daily Reckoning
Chris Mayer is managing editor of the Capital and Crisis and Mayer’s Special Situations newsletters. Graduating magna cum laude with a degree in finance and an MBA from the University of Maryland, he began his business career as a corporate banker. Mayer left the banking industry after ten years and signed on with Agora Financial. His book, Invest Like a Dealmaker, Secrets of a Former Banking Insider, documents his ability to analyze macro issues and micro investment opportunities to produce an exceptional long-term track record of winning ideas. In April 2012 Chris will release his newest book World Right Side Up: Investing Across Six Continents.
Video Report: Legally Collect Thousands of Dollars Each Year…From the OTHER government-backed retirement program! Finally – you can get on the inside! Here’s why you must do so now…


The past 5 – 6 weeks have seen equity prices move considerably higher amid growing concerns regarding the European debt crisis, the instability of the Middle East, and ultimately the potential for a major economic slowdown in the United States.
U.S. equity indexes have continued to climb the proverbial “Wall of Worry” since the first week of June and have put on an incredible run. This past Friday saw the S&P 500 Index (SPX) post the highest weekly close of 2012. The perma-bears have been calling for a top and continue to run scared as light volume and volatility have given the bulls an edge during August.
The next key overhead resistance level for the S&P 500 Index to hurdle is the 1,440 resistance zone lingering slightly overhead. I try to refrain from calling tops or bottoms as I feel its a fool’s game that ultimately humbles most market prognosticators. If calling tops and bottoms was easy, investors and traders alike would be able to produce monster gains all the time with uncanny precision.
Instead of trying to predict where the S&P 500 Index will find resistance or create an intermediate to longer-term top, I will simply posit some technical and macro-economic data that indicates we are likely closing in on a major top.
As stated above, the recent rally we have seen has taken place on relatively light volume and plunging volatility as measured by the Volatility Index (VIX).
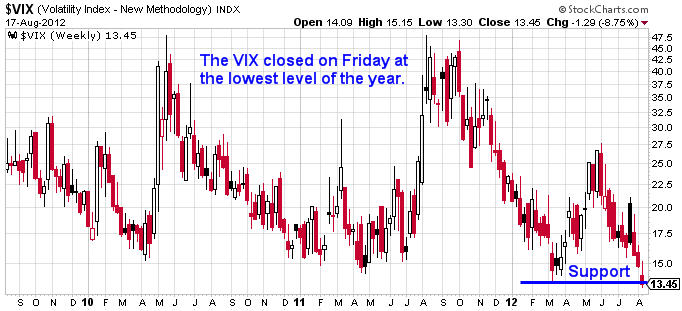
As can be seen above, Friday’s weekly close for the VIX was the lowest in 2012 and ultimately one of the lowest closing price levels in several years. While the VIX is trading at a major intermediate low, there remains a lower support level going back to late 2006 and the early part of 2007 around the 10 price level.
The perma-bulls would argue that we could see those 2006 – 2007 lows tested, but based on September monthly VIX options the option market seemingly is arguing that we are approaching an intermediate low in the Volatility Index. The chart below illustrates the September VIX option chain based on Friday’s closing prices.
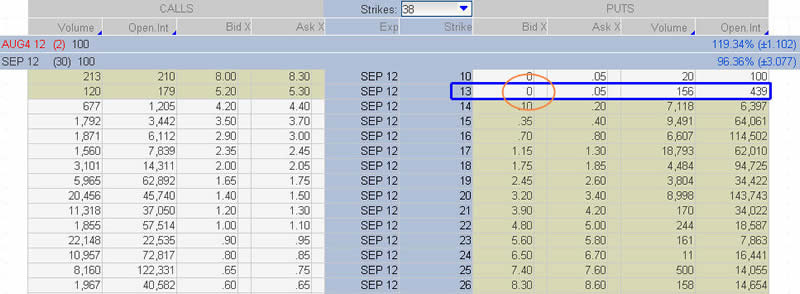
Price action is never wrong, but many times a great deal of information can be acquired by simply reviewing option prices. As can be seen above, the VIX closed on Friday at 13.45, a new 2012 low. However, when we consider the prices in the VIX September option chain shown above I would point out that the VIX September 13 Puts are 0 bid.
What this essentially means is that the VIX options market is saying that the Volatility Index is unlikely to move below 13 in September. For readers unfamiliar with options, selling a naked put or using a put credit spread are two trading structures that are bullish regarding the underlying asset which in this case is the VIX.
The VIX September 13 puts are offered at 0.05 on the ask, but are at 0 on the bid. This means that the VIX market makers are not expecting to see the VIX move below 13. Clearly this is not a guarantee as there is never a sure thing in financial markets. However, this pricing situation for the September 13 VIX Puts is favorable for the equity bears in September.
In layman’s terms, the VIX needs to move higher in the next 3 weeks based on the fact that the September VIX 13 Puts are 0 bid. This is one of several clues that we could be nearing a major top in the S&P 500 Index in the very near future.
When we look at a weekly chart of the S&P 500 Index (SPX) it is obvious that we have a major longer term breakout which occurred this past week. However, there remains additional resistance overhead in the 1,440 – 1,450 price range.
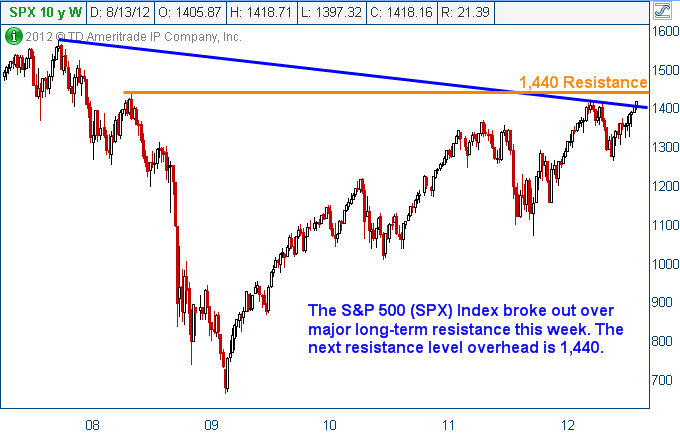
While 1,440 might be a major area where a significant top could form, a rally above this level cannot be ruled out entirely. However, the chart above gives traders and investors a context for where possible tops could form.
A reversal could play out almost immediately at the current levels or we could move considerably higher before finding major resistance that holds. For now, we do not have enough evidence based on the S&P 500 Index price chart to proclaim that a top has formed or will form in the near future.
Another underlying asset that I monitor closely is copper futures. Generally speaking, if copper futures are rallying economic conditions tend to be strong. The opposite can be said when copper futures are under selling pressure. Recently copper futures prices have been trading in a relatively tight trading range, but the longer-term weekly chart shown below demonstrates that should prices start to selloff, a major selloff could transpire.
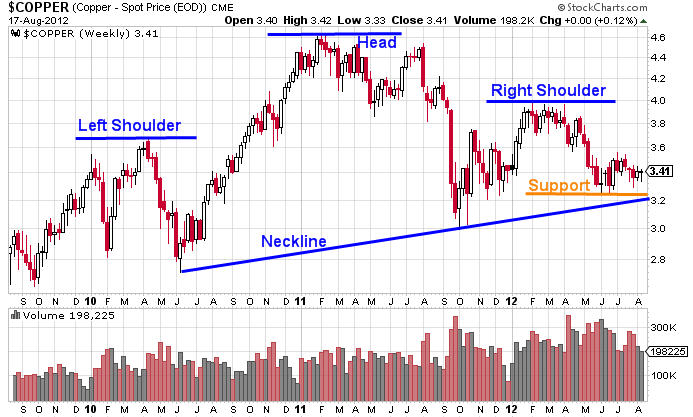
As shown above, there is a monstrously large head and shoulders pattern (bearish) that goes back to early 2010 that has formed on the weekly chart. Should the neckline of this pattern get taken out on a weekly close the selling pressure that could transpire could be devastating regarding the price of copper.
However, a major selloff in copper would also indicate that economic conditions were weakening globally. If copper triggers this bearish pattern, it would likely not be long before other risk assets followed suit.
In addition to the possibility that major selling pressure could await copper should that pattern trigger, another macroeconomic data point would argue that economic conditions are already starting to contract. The chart shown below, courtesy of Bloomberg, illustrates the amount of waste hauled by railroad cars and the implicit correlation to U.S. gross domestic product (GDP).
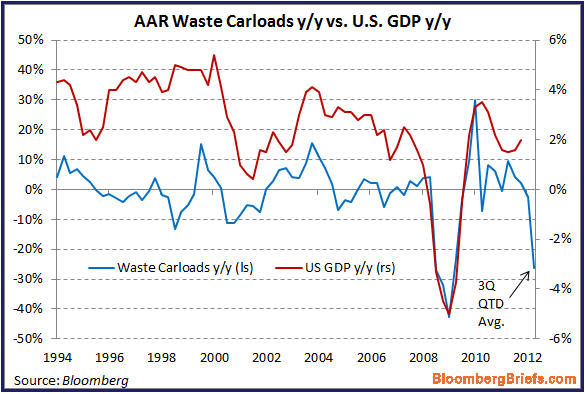
Recently Zerohedge.com posited an article that featured this chart and a link to that article is found HERE. The article and the accompanying chart demonstrate that as more products are produced, additional waste can be expected. As shown above, the amount of waste being produced and hauled by railcar has fallen off a cliff and should longer-term correlations remain intact a contraction in U.S. GDP is likely not far away.
There are a multitude of other topping triggers that I follow that are all screaming that a major intermediate and possibly even a longer-term top is nearby. However, at the moment the price action in the S&P 500 Index (SPX) is arguing otherwise.
Picking tops and bottoms in advance is extremely difficult and generally foolhardy, however when multiple triggers are going off regarding a possible type I pay close attention to price action. While I will not go as far as to say where specifically a top in the S&P 500 Index will form, I believe that a top is forthcoming and could even occur in the next 2 – 3 weeks.
Price is never wrong, and eventually I suspect that price will tell us what we wish to know. For now, I am going into the next few weeks with caution regarding the upside in risk assets. However, it is important to point out that I am not looking to get short risk assets either.
My research indicates that a major inflection point is coming and it could coincide with the Federal Reserve’s Jackson Hole summit. It could coincide with an event that we are unaware of as well. At the moment risk in either direction seems high and caution regardless of directional bias should be exercised. The next few weeks should tell the ultimate tale.
By Chris Vermeulen and J W Jones
If you would like to receive my free weekly analysis like this, be sure to opt-in to my list:http://www.thegoldandoilguy.com/free-preview.php
By Chris Vermeulen
Chris@TheGoldAndOilGuy.com
Please visit my website for more information. http://www.TheGoldAndOilGuy.com
If you are looking for a simple one trade per week trading style then be sure to join www.OptionsTradingSignals.com today with our 14 Day Trial.
J.W. Jones is an independent options trader using multiple forms of analysis to guide his option trading strategies. Jones has an extensive background in portfolio analysis and analytics as well as risk analysis. J.W. strives to reach traders that are missing opportunities trading options and commits to writing content which is not only educational, but entertaining as well. Regular readers will develop the knowledge and skills to trade options competently over time. Jones focuses on writing spreads in situations where risk is clearly defined and high potential returns can be realized.

Legendary investment adviser Dr Marc Faber thinks the S&P 500 is on the brink of a 10 per cent correction that would herald QE3 money printing from the Fed. He is always worth following and often accurate.
Dr Faber reckons the S&P is seeing its high for the year and that 2013 will be a very difficult year for stocks…
What? You’re not happy with the market? It could be worse. You could have loaded up on the Facebook IPO at 44, and today the dog is selling at 19.07. But I’m not sure I feel sorry for Zuckerberg. After all (sniff) he’s no longer one of the five richest tech-lords. Now there is talk that he should be removed as CEO, because he’s too immature.
Fred Hickey, my vote as the top expert in tech, thinks the tech bubble has popped, and that tech is now in a secular bear market. I agree with him, only because I can’t really work my iPhone (I claim it’s not really user-friendly), and because I think playing with Facebook is a royal pain.
Hickey, by the way, is a huge fan of gold and the gold mining stocks. But don’t get me wrong about tech, I love Amazon and Google, and I love the Internet. I think the Net has changed the world. It allows almost everyone on earth to know what’s going on in the rest of the world, and we know that “the truth will set you free.” Every dictator loathes and fears the Internet, because the Net allows people to know what’s going on. Why even North Korea is showing signs of crumbling, not only because of the Internet — but because their newest boy dictator was educated in Switzerland.
Yesterday, the Dow almost made it to its May 1st peak, but at the close they sold the Dow off. The Transports still have a way to go before they can close above 5285.97. What will I do if both D-J Averages do close above their May peaks? In that case, the facts will have changed, and I’ll change with them. There’s nothing stupider in this business than an analyst who dreams up a scenario and who sticks with his scenario no matter what. I often have a scenario, and as long as the markets go in harmony with my scenario, I’ll stick with it, but when the facts change I revise or jettison my scenario — to do otherwise would be idiotic.
I may appear fussy in my insistence that the two D-J Averages close above their May peaks, but whether they do or do not could be unbelievably important.

….read mor from 84 Year Old Richard Russell HERE
The following is an excerpt from Richard Russell’s Dow Theory Letters
Two days ago, amid all the low volume and sluggishness, the Transports gave us just a hint of something hopeful. It was a breakout of the declining trendline, as you can see on the chart. The Transports have been the laggers all year, and it seemed as though if the Industrials closed above their May peak, the Transports would not confirm. Now with this little upside breakout, the Transports are giving us a ray of hope. Maybe, just maybe, the Transports will add on a few more point, and get in the game.
Market psychology: One of my all-time favorite market quotes is from the 1987 movie Wall Street wherein Gordon Gekko declares that, “Money itself isn’t lost or made, its simply transferred from one perception to another.” Well perceptions have certainly changed…three months ago the market was very worried that the European financial crisis would spin out of control with contagion hitting all global markets…now fear is greatly reduced…especially since Draghi made his famous, “Whatever it takes,” statement on July 26…and that change in perception has shown up across asset classes.
Stocks: since the Key Turn Date and Key Weekly Reversal of June 4 theDJI has closed higher 9 out of 11 weeks, is up 1175 points (~10%) and closed this week at its highest weekly close since 2007. Since Draghi’s comments the major North American stock indices have risen ~5%, the German DAX is up ~11%, the UK FTSE is up ~7%, while Spanish and Italian stock indices are up ~25%!

VIX: the “fear” index, closed this past week at a 5 year low down ~50% from its June 4 Key Turn Date.

US and CAD interest rates: have risen sharply across the curve since Draghi’s comments while Spanish and Italian bond yields have fallen sharply.
Gold: implied volatility is near its lowest point of the past10 years…gold has been trading in a narrower and narrower range over the past 4 months…breakout ahead?

Crude: WTI hit a low of $78 on June 28…it’s now $96 up ~23%…Iran/Israel fears?
TSE: up 200 points on the week, up 755 (~6.5%) points since the June 4 lows.
Apple: hit a new all-time-high this week (up ~13% since Draghi’s statement) with a market cap of over $600 Billion. To put that market cap in perspective….it’s ~$200 Billion more than 2nd place Exxon, it’s double the market cap of third place Microsoft…double the combined market cap of Canada’s top 5 banks.
Royal Bank: closed at a 3 month high up ~16% from the June 4 lows…the broad US Bank Share Index is up ~15% from the June 4 lows.
CAD: is up over 5 cents from its June 4 lows at a 3 month high above 101.
Volume: share trading volume has been on a declining trend for the past few years and 2012 is on track to register the lowest annual volume in 15 years. This past week appears to be the lowest weekly volume in years…and it felt like it…summer doldrums in spades! (As an aside…the declining trading volumes and low interest rates are a double-whammy hitting the stock brokerage business…brokerage firms are losing money…expect consolidation across the industry.) If there is an Achilles heel to the recent stock market gains it may be that the rally has been on very light volume.
Money is mobile: Prices change as perceptions change…and as perceptions change money moves from one place to another…it moves from the center to the periphery…and back…from the “old reliable” to the exotic…and back…from low beta to high beta…and back…from New York to emerging markets…and back…from low yields to high yields…and back. A change in perceptions shows up across asset classes…in some sooner than others…in some more dramatically than others…by watching how these asset classes move relative to one another you can get a sense of how market perceptions are changing…you can find trading opportunities that “go with the flow.”
Trading: my theme for the past several weeks has been that, “this market wants to go higher.” I will maintain long positions in

-
I know Mike is a very solid investor and respect his opinions very much. So if he says pay attention to this or that - I will.
~ Dale G.
-
I've started managing my own investments so view Michael's site as a one-stop shop from which to get information and perspectives.
~ Dave E.
-
Michael offers easy reading, honest, common sense information that anyone can use in a practical manner.
~ der_al.
-
A sane voice in a scrambled investment world.
~ Ed R.
Inside Edge Pro Contributors

Greg Weldon

Josef Schachter

Tyler Bollhorn

Ryan Irvine

Paul Beattie

Martin Straith

Patrick Ceresna

Mark Leibovit

James Thorne

Victor Adair