
Stocks & Equities
This market wants to go up: My theme the past few weeks has been, “This market wants to go up,” and it was up again this week with the DJI up 100 points (Toronto up 230 points) to a new 3 month high. There have only been 3 higher weekly closes on the DJI since 2007…and if it had closed 30 points higher this past Friday it would have been the highest weekly close since December 2007.
Ed Note: Transcript continues below, or click on image for BNN Segment:
Low volume: Summer doldrums, European vacations and the Olympics contributed to the lowest weekly volume in the DJI for 2012 YTD.
Since the June 4 Key Turn Date: (a date that saw several Key Weekly Reversals) the DJI is up nearly 1200 points, the TSE is up nearly 700 pts, the CAD is up 5 cents and the higher-beta AUD is up 10 cents. Since the October 4, 2011, Key Turn Date (a date that saw a very rare and very powerful Monthly Key Reversal in the DJI) the DJI is up 2,800 points.
Climbing a Wall of Worry: I’ve written about this market “Climbing a Wall of Worry“ and there has been a lot to worry about (isn’t there always a lot to worry about?) One example of the worried investor psychology is the torrent of cash going into the perceived “safe haven” government bonds at lifetime low yields…even while governments are issuing record amounts of debt to cover their deficits…deficits that seem likely to continue for years…what self-respecting bond vigilante could have ever imagined a scenario wherein bond yields were this low while governments issued mountains of paper to fund trillion dollar deficits?
Psychology: Within the last 5 years investors have been hit with crashes in the stock market, the commodity market, and, in the United States, the housing market…it’s no wonder that investor psychology…particularly among the boomers… is now cautious…fretful…perhaps even fearful that the recent stock market gains could be gone in a heartbeat…and thus the rising market is subject to nasty short term breaks as cautious optimism is undercut by the latest wave of fear.
What’s changed? The European financial crisis has probably been the market’s biggest, most immediate worry…it was easy to imagine it spinning out of control with contagion effects clobbering all markets. Rightly or wrongly it seems as though the fear of a European inspired financial panic is diminished…and markets, with the weight of that worry reduced, are able to rise.
Trading: One of the notes taped to my trading screens says, “Are you trading what you think the market should be doing…or what it is doing?” I’ve thought about that a lot lately. It seems impossible to NOT have an opinion about what the market should be doing. When I think back to the times when I stayed with a losing position too long it was almost always because I thought that if I gave the trade a little more time then the market would “wake up” and come around to my point of view…in hindsight, not a good trading strategy!
These days I still have opinions about what the market should be doing…but, if it is not doing what I think it should be doing then I wait…until it does do what I think it should be doing before I make my trade…I anticipate a trade and then wait for a confirmation that the time is right to put on the trade.
I remain long the US stock market indices in my short term trading accounts.

The S&P 500 Could Soar To 1,500 Before Collapsing
In the near term, I believe that markets can still rally somewhat for the simple reason that in every market, you have a few strong stocks, and they are breaking out on the upside. Then, you have a lot of stocks that are down 40 or 50 percent and are very oversold, so they can also rebound…
I think that we may still rally somewhat into August – mid-August, end of August – and then probably we’ll have a tougher second half. In other words, September, October, and November could be somewhat tougher months…
The high was this year on April 4 at 1422. I think it’s possible, based on the few stocks that are strong and the rebound candidates, that we will exceed that high – maybe move to 1450 or even 1500.
“I think these lows could be exceeded and I think it may be October or November – or after the U.S. election – we could essentially have a decline of around 20 percent in the market.”
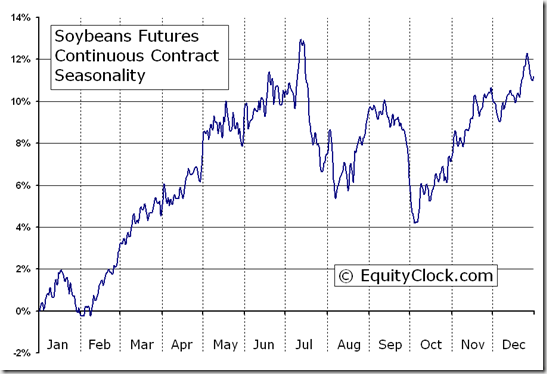
Ed Note: Seasonality studies from EquityClock.com also seem to support Marc Faber’s take:


Dr. Marc Faber author of the Gloom, Boom and Doom report is a world class Investor, Doctor Faber ‘s typically controversial and contrarian views have earned him the label of Dr. Doom. Doctor Doom also trades currencies and commodity futures like Gold Natural Gas and Crude Oil.Even his harshest critics must admit that he’s been unerringly correct in his market forecasts over the past three decades
This week’s Market Minutes video discusses how to know when the market is likely to produce good trades, check it out by clicking here.
There are many who consider trading the stock market to be a form of gambling. Quite truthfully, the way many people trade the stock market it is a form of gambling. Legal, easily accessible and perhaps more addictive than a slot machine, I have seen many people suffer great financial loss in the pursuit of easy market profits. How is it that trading can be gambling for some and a legitimate income source for others?
Because, for most, the value of the outcome of their trades in not known before the trade is made. We all understand that what happens with stock price is uncertain but that does not mean it is not predictable. A gambling trader may hope that he or she makes money on their trades but the professional trader knows what he expects to make on the trade. They know the expected value of the trade.
Suppose you devise a trading system that says buy any time the 20 day moving average crosses above the 40 day moving average and the volume is at least double the 20 day volume average (I have no idea if this is a good strategy, I doubt it so don’t try trading it). You then test your trading strategy along with some rules for exit and find that, over a sample of 300 trades, the average profit was $410 and the average loss was $230. Profits happened 67% of the time so, of course, losses occurred 33% of the time (again, all hypothetical).
The pro trader recognizes this as a money making system (it should be noted that the statistics above are not all that a person needs to consider when assessing whether a strategy is effective, I just want to keep it simple for this discussion). The expected value of a trade is as follows:
Probability of profit times the average profit – the probability of loss times the average loss so for this example;
0.67 times $410 – 0.33 times $230 = $198.80.
The trader who does this analysis finds that this simple strategy is expected to make them $198.80 each time they make a trade. While they do not know if the next trade will be profitable or not, they can predict what the profit should average out to over a large sample of trades, provided that what has happened in the past continues to happen in the future.
So, let me now ask if you know the expected value of the trades you make?
If you answer no then you may be a gambler. I say may because some traders may not have tested their rules to know the expected value but have still proven in their actual trading history that their strategy has a positive expected value.
In short, if you have no idea if your trading rules actually work or if you don’t even have a set of rules, relying instead on gut feel, then you are gambling at the stock market casino. Sadly, this casino will not comp you a room or give you free drinks when you play.
Successful trading involves taking risks; we are probably never certain of what the outcome of our next trade will be. Taking risk is necessary if we are hoping to make a return. However, there is a difference between taking risks and being reckless.
Think about what it means to be reckless. I like to mountain bike, race cars and fly planes; all things that most consider to be risky. But when I am on my bike, I don’t try to do 75 foot gap jumps like Matt Hunter, I don’t go 200 mph in to a corner like Lewis Hamilton, I don’t do wing to wing aerobatic maneuvers like the Snowbirds. I work within my abilities and limits and in doing so, avoid letting risk turn in to recklessness.
Buying a stock without knowing the expected value of the trade is reckless, it is gambling. Additionally, what is a simple risk for one person may be reckless for another. You have to know what your limits are and work within them. I may trade a strategy which has a positive expected value and not be reckless but if the experience required to execute that strategy is beyond your limits then trading it for you would be reckless.
If you want to be a successful trader you have to stop gambling and make sure you are trading with an expected outcome that is positive. You need to work within the limits of your skills and experience and avoid being reckless.
I did a number of Market Scans on Stockscores.com tonight to find stocks that had decent charts, including the Abnormal Breaks and Stockscores Simple strategies. Here are a few stocks that I think are worth keeping an eye on, their charts show good potential.
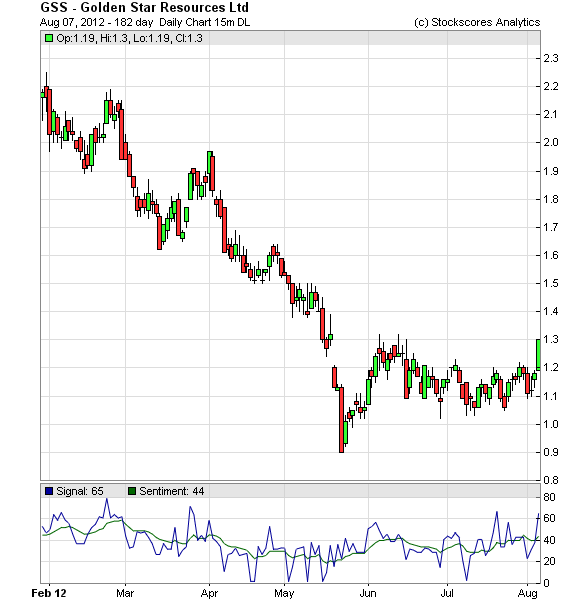
1. GSS
GSS broke out from a pennant pattern today with strong volume and abnormal price action. This move takes it through its downward trend line, making the chart a good turnaround candidate. Support at $1.09.
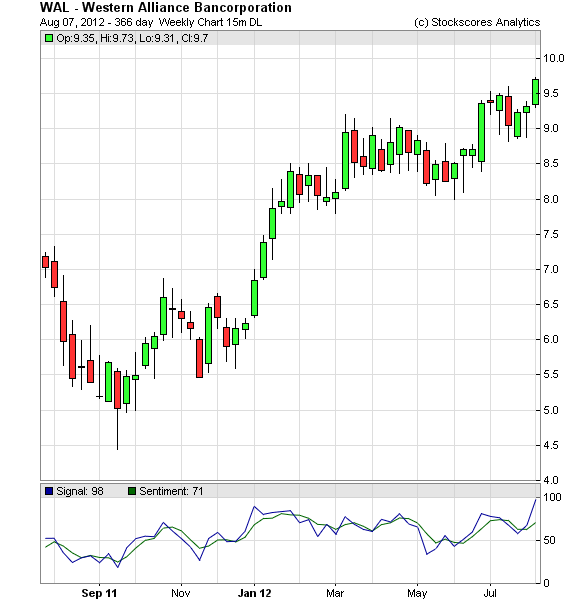
2. WAL
WAL is breaking to new highs for the year and has a very good long term weekly chart showing signs of a turnaround. Support at $8.85.
3. GPOR
GPOR breaks from an ascending triangle pattern after breaking its long term downward trend line a few weeks ago. The Sentiment Stockscore has recently crossed above 60. Support at $19.50.
References
- Get the Stockscore on any of over 20,000 North American stocks.
- Background on the theories used by Stockscores.
- Strategies that can help you find new opportunities.
- Scan the market using extensive filter criteria.
- Build a portfolio of stocks and view a slide show of their charts.
- See which sectors are leading the market, and their components.
Disclaimer
This is not an investment advisory, and should not be used to make investment decisions. Information in Stockscores Perspectives is often opinionated and should be considered for information purposes only. No stock exchange anywhere has approved or disapproved of the information contained herein. There is no express or implied solicitation to buy or sell securities. The writers and editors of Perspectives may have positions in the stocks discussed above and may trade in the stocks mentioned. Don’t consider buying or selling any stock without conducting your own due diligence.
“Equity markets on both sides of the border have had a good ride since their lows set on June 4th. The Dow Jones Industrial Average is up 8.8% and the S&P 500 Index has gained 9.8%. Investing in equity markets has become less attractive. Accumulation of seasonal trades on weakness continues to make sense as long as the seasonal trades are outperforming the market. Sectors in this category include agriculture, energy, leisure & entertainment, software and gold. A cautious bullish stance appears appropriate”.
Two major negative events and one positive event impacted equity markets last week. The negative events were no change in monetary policy by the Fed and no tangible news from European Central Bank head, Mario Draghi. The positive event was the employment report released on Friday. Unfortunately, news on these three events is unlikely to have a lasting impact on equity markets.
Economic news this week is quiet and is not expected to have a significant impact on equity markets.
Earnings news this week focuses on Canadian companies. Most of the biggest S&P 500 companies already have reported. A significant impact on equity markets is unlikely. Second quarter earnings continue to slightly exceed consensus earnings estimates, which, in turn are lower than the second quarter last year.
Macro events are expected to be relatively quiet this week. Watch out for the start of hurricane season!
North American equity markets have a history of moving flat to lower during the first two weeks in August.
Short and intermediate technical indicators for most equity markets and sectors are overbought, but have yet to show signs of peaking. Most equity indices and sector indices have entered into a band of intermediate resistance. Upside potential is possible, but limited.
North American equity markets have a history of moving higher from June to December during Presidential Election years. However, at least one correction during that period normally occurs.
Cash on the sidelines remains substantial and growing. However, political uncertainties (including the Fiscal Cliff) preclude major commitments by investors and corporations.
The S&P Energy Index added 1.49 points (0.28%) last week. The Index remains above its 20, 50 and 200 day moving averages. Short term momentum indicators are overbought, but continue to trend higher. Strength relative to the S&P 500 Index remains positive ‘Tis the season!

The above chart represents the seasonality for Crude Oil Futures Continuous Contract (CL) for the past 20 years Via EquityClock.com
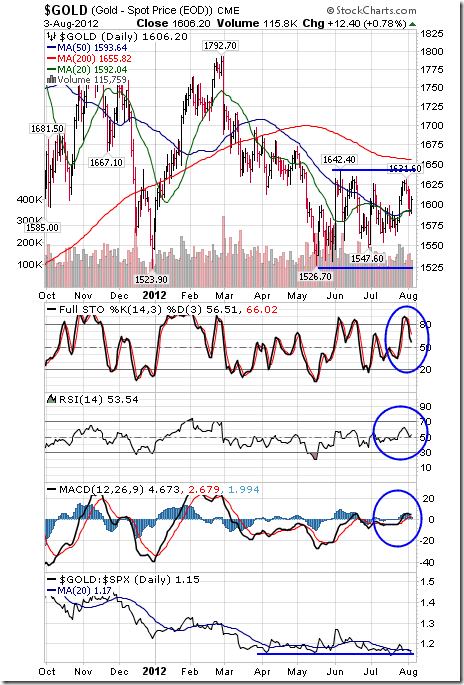
Gold slipped $13.70 per ounce (0.85%) last week. Intermediate trend is down. Support is at $1,526.70 and resistance is at $1,642.40. Gold remains below its 200 day moving average, but bounced nicely on Friday from near its 20 and 50 day moving averages. Short term momentum indicators are neutral. Strength relative to the S&P 500 Index remains neutral/slightly positive ‘Tis the season!
The above chart represents the seasonality for Gold Futures (GC) Continuous Contract for the past 20 years Via EquityClock.com
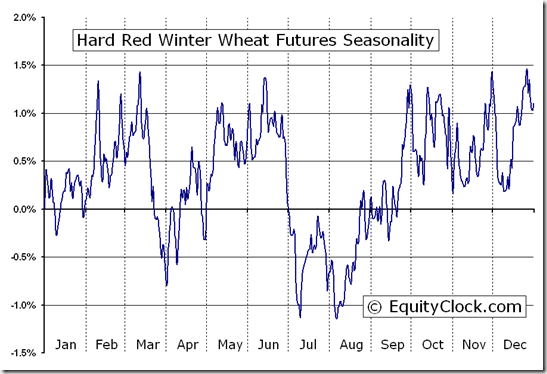
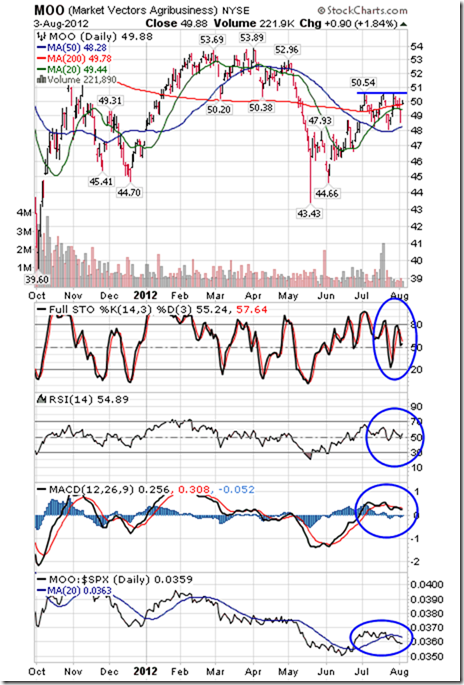
The Grain ETN added $0.46 (0.74%) last week. Intermediate trend is up. The ETN remains above its 20, 50 and 200 day MAs. Strength relative to the S&P 500 Index remains positive.
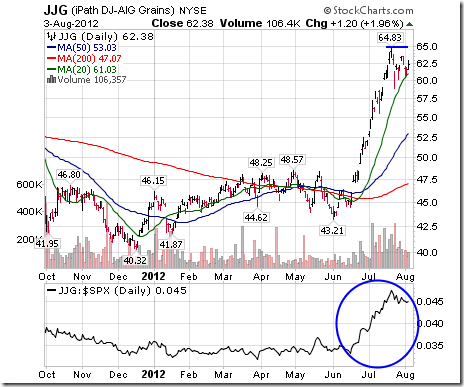
The Agriculture ETF slipped $0.48 (0.95%) last week. Intermediate trend is up. Units are testing resistance at $50.54. Units remain above their 20, 50 and 200 day moving averages. Short term momentum indicators are neutral. Strength relative to the S&P 500 Index is neutral/slightly negative.
About
Tech Talk / Timing The Market — Completely free seasonality, fundamental and technical analysis of the stock markets from a certified market leader. Market letters are published daily and are accessible though DVTechTalk.com and TimingTheMarket.ca. Comments in Tech Talk reports are the opinion of Mr. Vialoux.
Security positions held or not held by Mr. Vialoux will be indicated at the end of each Tech Talk report.

A few weeks ago, Ed Easterling and I updated the work we published almost ten years ago about secular bear and bull markets in chapters 5 and 6 of Bull’s Eye Investing. This week I am in Maine at the annual Shadow Fed fishing trip (for those of us whose invitation to Jackson Hole keeps getting lost in the mail). Ed has graciously agreed to do another piece with me on the earnings, or business, cycle, which is different in timing than the secular stock market cycle but is part of the total warp and woof of the markets. When you combine them, you get a much clearer picture of the markets.
Earnings are a topic of great debate. At any given time, you can hear someone on TV talking about how “cheap” the market is, while the person on the next channel goes on about how expensive the market is. Today we look at the cycle of earnings, rather than a specific point in time. Let me give you a little preview. In terms of time, this earnings cycle is already longer than average, and in terms of magnitude it is projected to go to all-time highs. Which makes one want to think about whether current projections are realistic. So let’s jump right in. (Note: This letter sets the Thoughts from the Frontline record for the number of charts, so it will print longer than usual, but the number of words is about average.)
But let me note that this week is the start of the 13th year of Thoughts from the Frontline. I started in August of 2000, talking about how the US would be in recession in 2001, analyzing the yield curve, which was beginning to seriously invert and which was also the signal for the recession call for 2007. I began with about 2,000 email addresses, gathered from readers of a previous print letter for another publisher and the readers of my first best-seller; and for whatever reason the list began to grow, and within a few years my entire business model changed, thanks to you, the readers and friends of this letter. The list has now grown to around 1 million of my closest friends and is posted on more websites than I ever imagined it would be. Who knew, 13 years ago, that this thing called the internet would be so cool? I am very grateful for your support.
I started Thoughts from the Frontline as a free service and hope to continue writing it for free for many years, as long are there are a few close friends who will still read my musings. My writing and thinking have evolved over the years, but I still sit down each Friday, wherever I am, and write about what I found interesting in all the reading I did the past week. I still find it exhilarating to hit the send button at the end of the process, every Friday night, and I relish the connection I feel with and the feedback I get from my readers.
And so, with an appreciative heart, here is this week’s letter, as we kick off another year. And what a year it promises to be!
Time to Row, or Sail?
In April 2007, while forecasters predicted at least two more years of increases, the first “Beyond The Horizon” article stated:
“Earnings have increased at double-digit growth rates for five consecutive years – although many agree that earnings growth may be slowing, it’s beyond almost everyone’s foreseeable horizon that earnings might actually experience a decline.”
By the end of 2007, earnings per share (EPS) for the S&P 500 declined versus 2006.
By the end of 2008, after an 80%+ decline in reported earnings, it was beyond almost everyone’s horizon that reported net earnings would recover to more than $90 per share over the subsequent several years … yet this year’s forecast is now $93 and next year is expected to top $103 per share.
Since the fundamental principles of the business cycle cause history to repeat itself, a decline in EPS should not be beyond your horizon!
Currently, profit margins are cyclically high, near historical highs, and already at unsustainable levels, with projected further increases over the next two years. Beware.
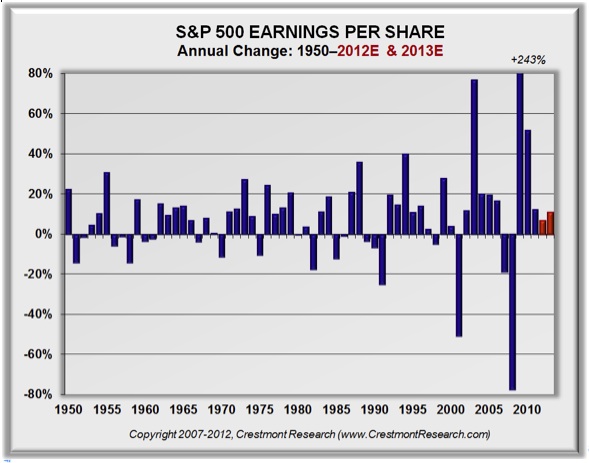
A look back at history provides insights about the earnings cycle and what is considered to be normal. Despite the statistics about average earnings growth, the business cycle drives periods of surge and stall. And the stall is generally a year or two of outright retreat, rather than smoothly slower growth. As reflected in Figure 1, earnings typically grow handsomely for three to five years, and then decline for a year or two before again growing. That’s usually all that it takes to restore the balance.
Figure 1. S&P 500 Earnings Per Share Growth: 1950–2011
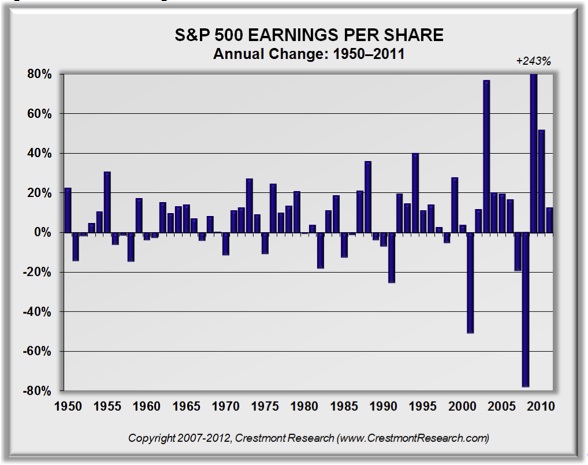
This choppy, irregular pattern has endured across periods of war, technological and business innovation, political issues, and other sorts of change. Yet the business cycle is not short; it does not run its course within a year. To more accurately see the trends, we can extend the period a few years to present the cycle as a multi-year average.
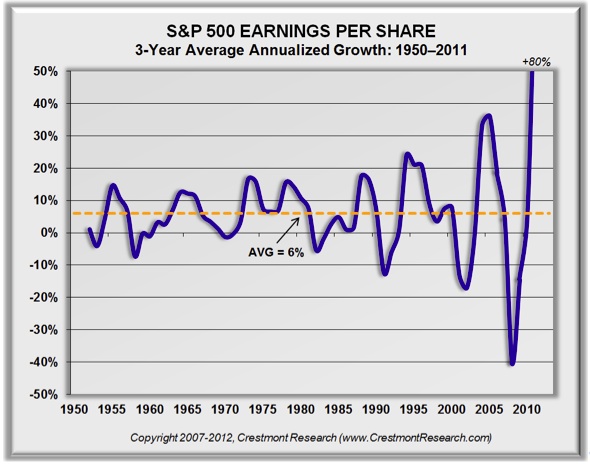
Figure 2 presents the three-year average growth rate for earnings. The cycle, while still somewhat erratic, begins to show its more cyclical nature – and the tendency for it to return to a baseline growth rate.
Figure 2. S&P 500 EPS 3-Yr. Average Growth: 1950–2011
Profits not only grow and decline in dollar terms; they also change in relation to the amount of sales that it takes to generate the profits. Described in more detail, profits are the portion of sales that companies keep after all costs and expenses. When profits are compared to sales, the resulting ratio is known as the profit margin. As economists will acknowledge, the business cycle tends to push profit margins around a base level. When the sales of all companies are consolidated together, the result is essentially gross domestic product (GDP). Therefore, the aggregate profits of all companies can be compared to GDP, as a measure of profit margins and relative profitability.
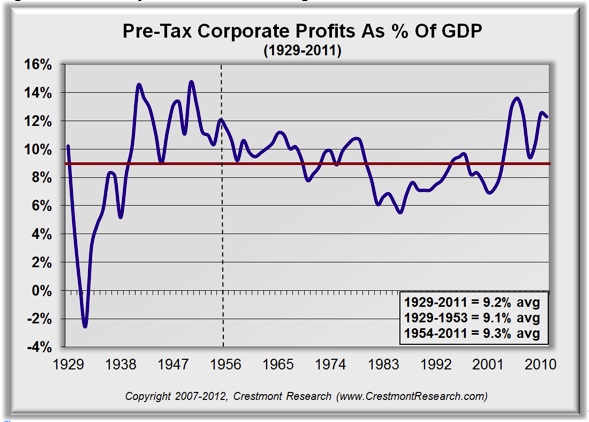
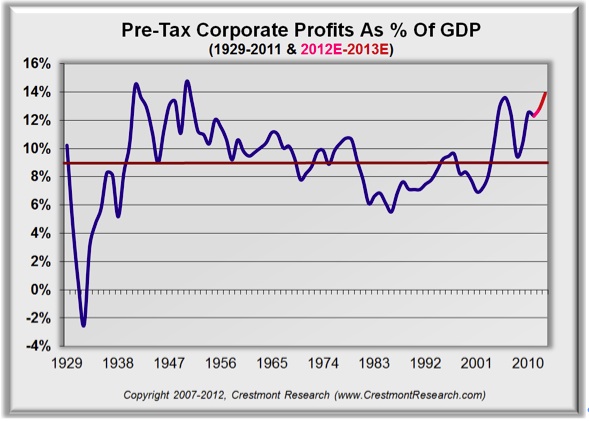
Figure 3 presents the profit margin relationship since 1929, when the data was first readily available. The relationship has not been smooth, yet it has been fairly consistent. During the Great Depression, profit margins were low and negative. That underperforming period was followed by an extended era of above-average profit margins. The average for the entire period of over eighty years from 1929 to 2011 is approximately 9%. Interestingly, the average for the first twenty-five years (1929-1953), with its extremes, also averages almost 9%.
The extremes in both directions during the early part of the last century counterbalanced each other, as would have been expected in order to achieve the “normal” average. Following 1953, the average has also been near 9%; yet with less-extreme cycles. (Note: 1953 was used as the cutoff year to reflect a twenty-five year period and to encompass all of the more extreme years during the first half of the past century.)
Figure 3. Pre-Tax Corporate Profits as a Percentage of GDP: 1929–2011
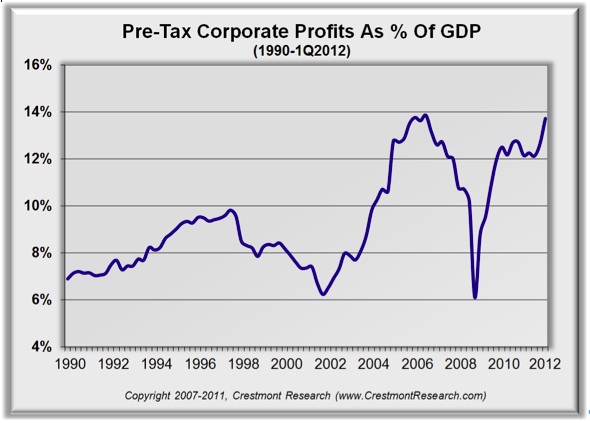
Today, as highlighted in Figure 4, using quarterly data, profit margins have moved well above the historical baseline near 9% and are vulnerable to being restored again toward the average. It does not necessarily have to happen immediately, as these cycles are slow-moving. It is likely, however, to be forthcoming.
Figure 4. Pre-Tax Corporate Profits as a Percentage of GDP: Quarterly 1990–1Q2012
nalyst forecasts remain optimistic despite recent indications of weakness. As of July 31, the forecast by Standard & Poor’s for this year and next year reflects continued earnings gains – to more than $103 per share. Figure 5 adds the percentage increases for the next two years to Figure 1. This puts into perspective the notion that we’re supposedly on track for one of the longest runs ever of earnings increases.
Figure 5. The Analysts’ Forecast: S&P Outlook – Percentages
How can we put the level of earnings into perspective? There are two methods to normalize earnings described in Ed’s most recent book, Probable Outcomes. The first is a method popularized by Robert Shiller at Yale and the other is a methodology used by Crestmont Research. The blue line in Figure 6 is actual reported EPS; the red line extension is S&P’s forecast. The orange and purple lines are baseline normalized EPS using Crestmont’s & Shiller’s methodologies.
As reflected in Figure 6, both methods reflect similar results over time. Most noteworthy in this chart is the high degree of variability for reported earnings in relation to the normalized measures. This chart is probably one of the the best ones by which to appreciate the high degree of fluctuation for reported earnings across business cycles.
Figure 6. The Analysts’ Forecast: S&P Outlook – Dollars
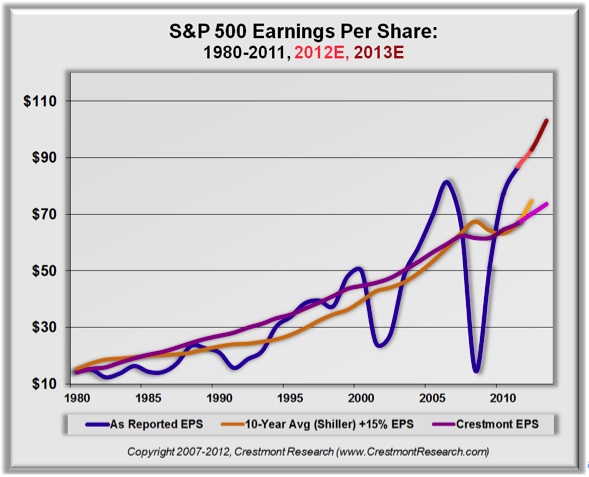
Note in Figure 6 that the current and forecast levels of earnings are becoming quite elevated above the normalized growth baseline. This is another indication that profit margins have become extreme. But how extreme?
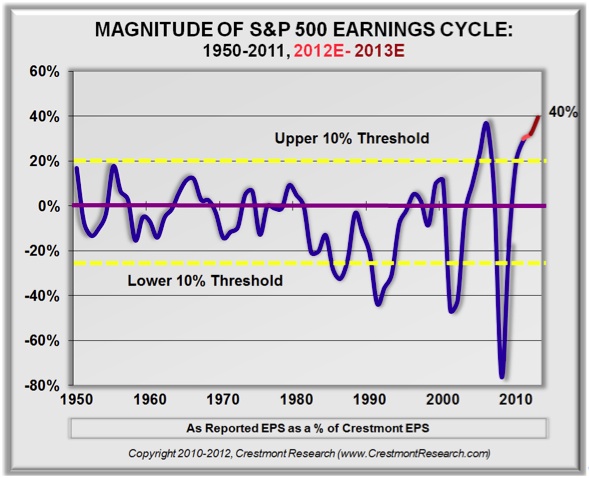
Figure 7 presents the percentage difference between actual and forecast reported earnings compared to Crestmont’s measure of normalized earnings. This enables us to see the relative difference as a percentage. That makes the chart comparable over longer periods of time when the actual dollar level of earnings is increasing.
Two yellow bands are included on the chart to mark the middle 80% and outlying 10% of the points on each side of the middle. Most of all, the chart highlights just how far beyond the normal range we have currently gone and are forecast to go. By the end of next year, we’re expected to be 40% above the normalized level of earnings. And since the trend tends to overshoot the baseline, the potential decline in reported earnings will certainly surprise a lot of analysts (but no longer will it surprise our readers!). Therefore, the current position in the earnings cycle is extended not only in terms of duration, but also in magnitude.
Figure 7. Magnitude of EPS Over/Under Baseline Trend
Although the two methods for presenting profit margins in the business cycle are not directly comparable, we can overlay the information for some level of additional perspective. There are few well-followed forecasts for national profit margins. Figure 8 depicts national corporate profits, with a pro forma extension using the S&P 500 forecast for reported earnings growth in 2012 and 2013.
The press is now filled with stories about record profit margins. It’s clear that the current record goes back a long way. This, of course, means that there’s quite a long ways to fall, too.
Figure 8. Comparable Profit Margin Analysis
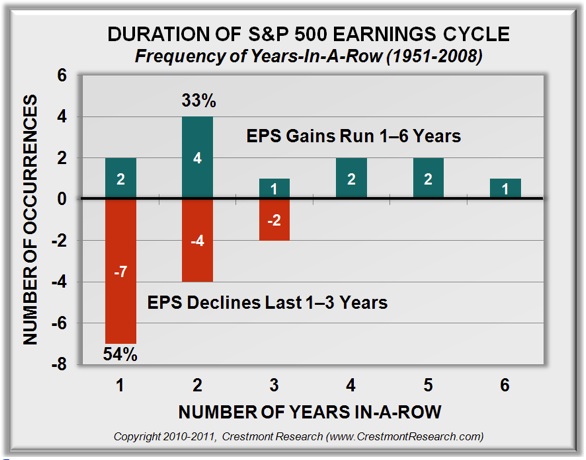
What about the duration of earnings cycles? Past EPS cycles have lasted one to six years. Over the past six decades, there have been twelve up-cycles. Six lasted one or two years (last year, 2011, was year three of the current cycle). We’re now in the second half of the game. As each upcoming year passes with an increase in EPS, the likelihood rises for the next decline in EPS … and potentially the stock market.
Conclusion #1: Reported earnings, based on history, should be expected to decline over the next two years (or they are increasingly likely to disappoint current expectations). That will put pressure on the stock market. If history is a guide, and if the blue line in Figure 8 only slightly retreats below the historical baseline, the implication is a decline in reported EPS of almost 40%! While growth could continue (as it has done in the past), it is clear that this cycle is getting a little weathered. And note that almost every downturn came as a surprise to the markets. Any analyst suggesting a downturn is labeled doom and gloom (as we can attest).
Conclusion #2: The measures of P/E that are based upon reported EPS are currently distorted by the business cycle. Whereas current reports have the market’s forward P/E near 13, a more rational measure for P/E based upon normalized baseline EPS is close to 20. P/E is not below average and is not ready to propel the market upward; it is well above average.
Figure 9 highlights the duration of EPS cycles. The chart will not include the current cycle until it is complete. Of the twelve up-cycles, half of them ended after one or two years of rising earnings. None of them exceeded six years, and only one went that long. Since 2011 was the third year of earnings gains for the current cycle, the likelihood of a decline is increasing. If a decline happens to not occur during the coming two years, then we’ll make history.
When declines have occurred in the past, they most often lasted only one year. But just under half of the time, the decline extended for two or three years. Given how far this cycle has extended in magnitude, it’s unclear whether the next decline will be a brisk annual event or a torturous few years.
Figure 9. Duration of EPS Cycles
A Few Implications
The stock market and earnings analysts do not expect a decline in EPS over the next few years. The forecasts too often anchor on the recent past and extrapolate (in a burst of hope) current trends well into the future.
A broader view of history tells a different story. It is a story of a frequently erratic earnings cycle. The current cycle is now extended not only in duration but also in magnitude. It’s hard to deny that EPS is vulnerable to decline over the next few years.
When the decline in earnings occurs, it will not be minimal. The decline to the historical average would be 30% to 40%. These cycles, however, rarely stop at average. More often, they move well above and below the long-term trend line.
We’ve all seen that the stock market reacts to surprises quite negatively. There is no reason why investors should walk blindly into this storm. “Who knew?” will not a reasonable excuse.
Active portfolio management can position portfolios to participate in further upside until the downturn occurs, then it can provide protection from the full brunt of the ensuing losses.
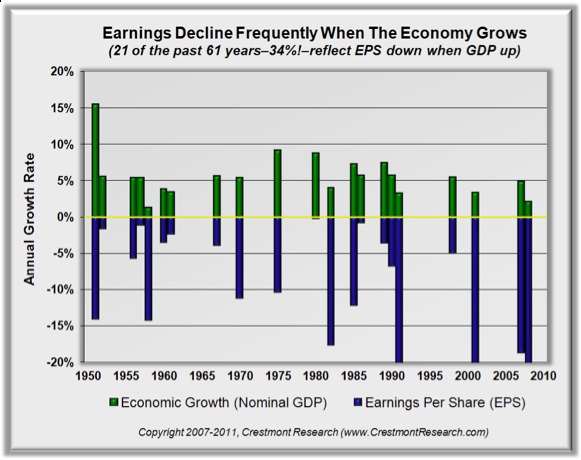
Some people will read the outlook for a decline in earnings to portend a recession, but earnings declines happen much more frequently than recessions. The business cycle is distinct from the economic cycle. As reflected in Figure 10, over one-third of the past 61 years have seen EPS declines despite growth in the economy. So, don’t be surprised that EPS might decline in spite of continued economic growth.
Figure 10. EPS Downturns Without Recessions
A weak economy, however, adds to the pressure on earnings. The typical vulnerability at this level in the cycle is accentuated by the external forces of the economy. That makes the risks particularly worrisome.
It’s Time to Think About Absolute Returns
As described in chapter 10 of Probable Outcomes and chapters 9 and 10 of Unexpected Returns, the goal is to use absolute return-oriented “rowing” investments rather than more passive relative return “sailing” strategies. Although the stock market will provide shorter-term periods of solid returns over the next decade, it will also have offsetting periods of declines. Unlike secular bull markets, where the upswings far outweigh the downdrafts, the current environment is set for a much more modest (and likely disappointing) result. Rather than acquiesce to the mediocre returns on the horizon, investors can take action and develop their portfolios to profit regardless of the overall market direction. Although market timing may be an option for some, it is generally not a good option for most investors.
Conclusions About the Earnings Cycle
The business cycle has endured for well more than a century. It generally delivers two to five years of above-average EPS growth before experiencing a year or two of pullback. We have had a dramatic run over the past two years, and the forecast for the next two years now positions profits well above their historical relationship to the economy.
Several factors now indicate that a period of EPS decline may be upon us. It does not necessarily portend a decline in the market, although that vulnerability clearly exists. Beware nonetheless! For investors, this means that portfolios should be positioned through diversification and active risk and return management.
As an analogy, winter is not a time for gardeners to hibernate; rather it’s a time for different crops and techniques. Today’s investors have many tools available that let them actively “row” and invest like institutions, thereby achieving relatively consistent returns with a lot less disappointment risk.
Ed Easterling is the author of the recently released Probable Outcomes: Secular Stock Market Insights and the award-winning Unexpected Returns: Understanding Secular Stock Market Cycles. Further, he is President of Crestmont Research, an investment management and research firm, and a Senior Fellow with the Alternative Investment Center at SMU’s Cox School of Business, where he previously served on the adjunct faculty and taught the course on alternative investments and hedge funds for MBA students. Mr. Easterling publishes provocative research and graphical analyses on the financial markets at www.CrestmontResearch.com.
By John F. Mauldin
Outside the Box is a free weekly economic e-letter by best-selling author and renowned financial expert, John Mauldin. You can learn more and get your free subscription by visiting www.JohnMauldin.com.
Please write to johnmauldin@2000wave.com” target=”_blank”>johnmauldin@2000wave.com to inform us of any reproductions, including when and where copy will be reproduced. You must keep the letter intact, from introduction to disclaimers. If you would like to quote brief portions only, please reference www.JohnMauldin.com.
johnmauldin@investorsinsight.com” target=”_blank”>John Mauldin, Best-Selling author and recognized financial expert, is also editor of the free Thoughts From the Frontline that goes to over 1 million readers each week. For more information on John or his FREE weekly economic letter go to: http://www.frontlinethoughts.com/
To subscribe to John Mauldin’s E-Letter please click here:http://www.frontlinethoughts.com/subscribe.asp

-
I know Mike is a very solid investor and respect his opinions very much. So if he says pay attention to this or that - I will.
~ Dale G.
-
I've started managing my own investments so view Michael's site as a one-stop shop from which to get information and perspectives.
~ Dave E.
-
Michael offers easy reading, honest, common sense information that anyone can use in a practical manner.
~ der_al.
-
A sane voice in a scrambled investment world.
~ Ed R.
Inside Edge Pro Contributors

Greg Weldon

Josef Schachter

Tyler Bollhorn

Ryan Irvine

Paul Beattie

Martin Straith

Patrick Ceresna

Mark Leibovit

James Thorne

Victor Adair