
Stocks & Equities
So I wasn’t unduly surprised to read recently that he believes Burma to be “the best investment opportunity in the world, with North Korea not far behind”.
He exaggerates to make a point, but his comments gave me pause for thought because I am as guilty as anyone of lazily describing the investment world as a three-legged stool, as if the US, Europe and China were the only markets that mattered. In particular, his interest in Burma and North Korea is a reminder that there is a lot more to Asia than the Middle Kingdom.
Some of the countries that make up the ASEAN region have been among the best places to ride out the financial crisis. Stock markets in Indonesia and Thailand, in particular, trade at a healthy premium to their pre-crisis levels, while the world average remains deeply in negative territory compared with five years ago.
South-east Asia as a safe haven is a novel concept for anyone who remembers the region’s own devastating financial crisis in the late 1990s. I have a cartoon on my wall from a newsletter I published at the time showing a row of sick-looking tigers in hospital beds with thermometers in their mouths. The region has never really shaken off its image as the riskiest of emerging market bets.
But confidence is growing in a region of 600m people, with a fast-expanding middle class driving consumption and economic growth. The International Monetary Fund recently downgraded growth for the ASEAN region, showing it cannot completely buck a slowing global recovery. But it has still pencilled in 6.1pc growth next year, compared with 0.7pc for the euro area and 2.3pc for the US.
The ASEAN should not be underestimated. With a combined stock market capitalisation of more than $2 trillion and trade with China expected to top $500bn by 2015, the region is grabbing the attention of increasing numbers of investors. In the first half of this year, almost as much money flowed into ASEAN funds as flowed out of China. Having been the first investments to be liquidated in an emergency, they are taking on the characteristics of a port in the storm.
Many of the region’s attractions are familiar to China bulls. Rapid urbanisation and infrastructure build tell a similar story, for example, as do the robust government finances that make a high level of public investment possible. But there are differences, too. China’s one-child policy is leading to a rapid ageing of its population, but in South-east Asia more than 40pc of the population is under 25, putting the region in a demographic sweet spot. The ASEAN region is extremely diverse, however, so it is not possible to generalise beyond the obvious themes of higher consumption and investment. Vietnam and Singapore share membership of the economic organisation, but little else. Some of the region’s countries are rich in natural resources that others lack. Inflation is a problem in some places and not in others. Local knowledge is key.
One of the most interesting markets in the region is Thailand, and not just because it might be the best way to tap into the opening up of Burma. Thailand’s stock market has risen by 16pc so far this year, beating all the other main indices in Asia.
In part that reflects a quicker than expected recovery from last year’s floods. But it is also a consequence of a raft of pro-stimulus policies from the country’s populist government, including a 40pc rise in the minimum wage and a sharp reduction in corporation tax from 30pc to 23pc, with 20pc in the pipeline for next year.
Foreign investment is pouring into Thailand, with Japanese car makers seeing the country as a safe destination for companies seeking to escape the high yen and energy shortages following the Tohoku earthquake.
The government is playing its part, too, spending heavily on dams and flood defences as well as rail and road projects to help promote the country as a distribution hub for the region, linking China with frontier markets such as Cambodia.
Thailand might seem a bit mainstream for someone weighing up an investment in North Korea, but less adventurous investors than Jim Rogers probably won’t mind that.
Tom Stevenson is an investment director at Fidelity Worldwide Investment. The views expressed are his own. He tweets at @tomstevenson63


STOCK MARKET – ACTION ALERT – BULL (WOBBLING LESS)
‘Turnaround Tuesday’ disappointed the bulls as an expected intra-day rally petered out and indexes were unable to post higher highs as compared to Monday. The stock market traded sideways most of the day after some mixed economic data but fell late in the session yesterday as German officials reportedly spoke out against moves by the ECB to expand its mandate in an effort to save the Euro. The Dow Industrials dropped 64.33 or 0.49% to 13,008.68, the S&P 500 dropped 5.98 or 0.43% to 1379.32, the NASDAQ lost 6.32 or 0.21% to 2939.52, and the Russell 2000 sank 4.64 or 0.59% to 786.94.

Consumer Discretionary led the decline (XLY -1.29%) after an unexpected decline in consumer spending. Energy was also weak (XLE -1.09%) as the price of oil fell. Materials were down too (XLB -0.68%) after Ecolab (ECL -3.96%) reported in line earnings but disappointing revenue. Technology was the sole gainer among the market sectors (XLK +0.41%) after strong results from Cirrus Logic (CRUS +23.22%) and a forecasted 70% increase in revenue. Apple held steady, thereby outperforming the broader market, because most of Cirrus’s sales go to Apple. Industrials also outperformed (XLI -0.28%) after Goodyear (GT +10.41%) easily topped forecasts. Healthcare traded in line with the market (XLV -0.62%) after Pfizer (PFE +1.39%) reported better than expected revenue and earnings as did Aetna (AET -2.91%) but traders worried about the earnings quality as its pretax, prior-period reserve development fell from $188 million to $38 million.
Yesterday morning I wrote: “We are creeping into overbought territory. So, from a trading perspective I would be looking to take profits over the next day or so, regardless of the FOMC meeting.” Well, I acted on my words and Platinum subscribers were instructed to ‘ring the register’ in our long SPY and VTI (Total Stock Market Index) positions yesterday morning. Breadth was negative and volume increased forming several Negative Leibovit Volume Reversals. Whether, these signals are distortions due to anxiety over today’s FOMC announcement and/or nervousness whether Mario Draghi is going put the European printing press into high gear, I cannot say. Certainly, investors (and traders) would love to see a QE3 announcement as trigger to get stock prices higher (again!), but does it mean a damn thing anyway? Some caution is warranted here from a trading perspective, but that makes sense anyway around FOMC periods. If we’ve topped out as we did back on June 19, and July 3, look for another 50 point correction in the S&P 500 which would translate into 1340 (close of 1379.32 yesterday).
From the VRtrader.com website here is a link to World Market Indices:
http://www.vrtrader.com/vr_free/worldmarkets/index.asp
How many of you out there would be interested in ‘Money-Management’? I am continuing to take a poll among current subscriber clients. This is an account where many of the trades and recommendations made herein are implemented in your account? I would not be interested in accepting small accounts (accounts under $100,000). Let me know. It is in the early stages, but I am working on a couple of potential opportunities where such a strategy could be employed. There would, of course, be a management fee. I will keep this notice posted for a few weeks.
Mark Leibovit’s Gold Letter, # 1 Gold Timer for 10 year period & #2 Gold Timer for 2011
IF YOU HAVE NOT SIGNED UP FOR THE LEIBOVIT VR GOLD LETTER, HERE IS YOUR CHANCE. THE SEPT. 17TH EDITION IS HOT OFF THE PRESS. HERE IS THE LINK: WWW.VRGOLDLETTER.COM. YOU GET A 50% DISCOUNT FOR THE FIRST MONTH.
VRTRADER.COM Trial Signup:
THE RENEWAL OF YOUR SUBSCRIPTION IS AUTOMATIC. YOUR CREDIT CARD WILL CONTINUE TO BE BILLED UNLESS YOU NOTIFY VRtrader.com SEVEN DAYS PRIOR TO SUBSCRIPTION EXPIRATION EITHER VIA EMAIL POSTING THE WORD ‘UNSUBSCRIBE’ IN THE SUBJECT BOX OR TELEPHONE US AT (928) 282-1275 OF CANCELLATION. NO REFUNDS ARE AVAILABLE ON SILVER, PLATINUM OR VR FORECASTER (ANNUAL FORECAST MODEL) SUBSCRIPTIONS.
Welcome and congratulations on choosing VRTrader.com as a source for your stock market commentary, information and analysis for the U.S. Stock Market. Needless to say we are very happy that you are joining us for AT LEAST the next 30 days days and look forward to providing you rewarding and inciteful information that will help you toward your goal of succeeding in the markets.
Here is the Special Trial Offer: Use this month to kick our tires. Pay 50% for the first 30 days (No refund) and sample our Silver or Platinum service and then decide what works best for you. If you aren’t 100% ready to move forward, simply email us to cancel one week before your 30 day 50% off trial subscription ends and it will be canceled and you will not be charged ANY FURTHER, no questions asked. Just send an email to mark.vrtrader@gmail.com” or call 928-282-1275 to cancel. You will receive an emailed confirmation of your cancellation at that time.
The 30 day trial is allowed one time only. By taking this 30 day 50% trial, you agree to be charged the full cost of the monthly Silver or Platinum service (choose one only) at the end of the 30 day trial subscription period, unless you cancel first. The regular Silver monthly rate is $49.40 and the Silver quarterly rate is $133.50. The regular Platinum monthly rate is $129.95 and the Platinum quarterly rate is $350.85. The special trial 50% off trial rates are listed below. Sign up today!
There are no refunds or pro-rata refunds offered at VRTrader.com for any subscription. You are being offered a 50% discount for trying our service for the first 30 days only!

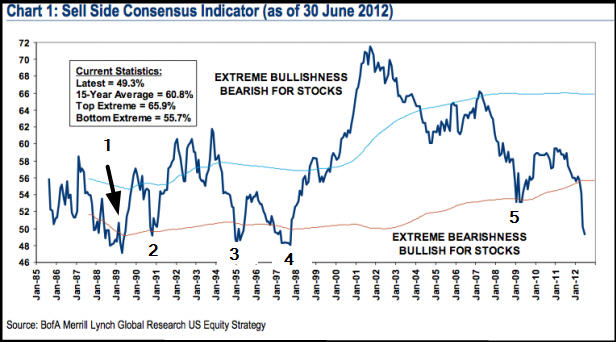
Right now we have a friendly, some say overly friendly, Federal Reserve and a lot of pessimism on the part of investors. Remember people get bearish at bottoms and bullish at tops.
In the nightly commentary of July 3rd, we relate that Merrill Lynch’s proprietary sell side indicator is at its most bearish in 15 years. Previous visits to this level has resulted in substantial rallies. You should re read that update (Ed Note: read the update “Merrill Lynch’s proprietary sell side indicator” at the bottom of this article)
Continuing on the sentiment theme, look at the chart below. The 5 week moving average of the percentage of bulls as measured by the American Association of Individual Investors is below 30%. In the past, that level has tended strongly to be a precursor of substantial multi week rallies, especially during bull markets.
If you look at the extreme left side of the chart, you can see that the indicator did move below 30% and yet, the market went down anyway. Don’t forget that this was toward the end of one of the most corrosive and persistent bear markets of the past 100 years. In those extreme times, the bears tend to be right, but this is an unusual condition. No indicator is flawless.
Another bullish indication is the weekly advance decline line. You can see this in chart form on page 5, but suffice to say that it is at an all time high even though the averages are not. When the internals are outperforming the averages, it is normally good sign.

Merrill Lynch’s proprietary sell side indicator from July 3rd:
SHORT TERM TREND Bullish
INTERMEDIATE TERM TREND Bullish
From:
TODD MARKET FORECAST – Stephen Todd P.O. Box 4131 Crestline, CA 92325-4131
For investors, this summer has been a doozy so far. It’s been full of uncertainty. What will happen to Europe? Will taxes go up here in the United States? Who will be the next president?
The concerns, however, don’t end there.
Is the economy OK, or is it starting to tank again? What will the investment environment look like four months from now … six months from now … next year?
And for traders, things haven’t been much better.
The above uncertainty and more has led to nothing but wildly swinging trading ranges in most markets. One day, gold looks like it’s tanking. The next, it’s soaring.
One day, the Dow Industrials are collapsing. The next, the Dow is exploding higher.
All of this has made for some very volatile markets for the summer, chopping up even the best investors and traders.
Given Europe, the fiscal cliff facing the United States at the end of the year, and the upcoming presidential elections leading up to it — the uncertainty is definitely understandable. The choppy trading markets are, too.
But all of this begs several questions …
When will the uncertainty subside? When will the choppy markets give way to trending moves? How best can an investor get positioned now? How best can a short-term trader get ready to make some decent, trending profits?
In this column, I’ll answer all the above based on what my cyclical and technical models are telling me.
And in my opinion, it’s all good news.
FIRST, and perhaps foremost: I don’t think we will have to wait much longer to see a resolution of the current choppy and uncertain markets.

Based on everything I am studying, virtually all markets are on the cusp of important moves. Moves that will clarify a lot of the uncertainty out there, and lead to solid, trending moves in many markets.Moves with very high profit potential.
That’s what my cycle work is telling me. Virtually all of it — short- and intermediate-term models — point to the first two weeks of August as major turning points for the markets.
A time period where we will see the wildly swinging moves in the Dow Industrials give way to a consistent trend. Where the extreme volatility in gold, silver and other commodities also gives way to trending markets.
And where we will also probably see the beginning of the end for the euro and the European Union.
Let me explain …
SECOND, dis-inflation still has the upper hand. Fundamentally speaking, there’s simply too much debt in the world for the central banks to corral right now.
And they know it. That’s why you’ve seen the Federal Reserve and the European Central Bank largely sit on the sidelines, refusing to take any big steps.
It’s why Moody’s has downgraded Germany. It’s why Greece will soon have no choice but to pull out of the euro. It’s why Spain is now on the verge of not another bailout for its banks ― but instead a full-blown sovereign bailout. And it’s why Italy is also starting to go over the cliff.
None of that will change until the world’s major central banks come out swinging. And they won’t come out swinging until the masses want them to — when systemically important financial institutions are about to go under, like they were in the midst of the real estate crisis here in 2008 and 2009.
In the meantime, dis-inflation continues to keep its upper hand. Despite the recent (and very weak) rallies in many markets, you can take your cues from U.S. Treasury rates.
They are at RECORD lows, which means the majority of capital in the world is still scared stiff and flocking to cash. That’s not inflationary. That’s dis-inflationary.
And my models are clear: It’s going to continue in August, and probably well into autumn ― as investors largely withdraw from the markets.
Moreover …
THIRD, all of my technical models are resolutely short- and intermediate-term bearish for almost all asset classes (except the U.S. dollar and bonds).
For instance …
Gold would have to close above $1,727.70 to turn the short- and intermediate-term trends back to bullish. And my models say that’s not in the cards yet.
Silver would now have to close above $30.71 to reverse the immediate bias to the downside. Again, my models say that’s not likely.
Oil would have to close above $98.48. Given the recent increase in the supply picture and falling demand around the globe, that’s not likely to happen either.
The Dow Industrials would now have to close above 13,995.30 on a weekly basis. That’s not going to happen in my opinion. Quite the contrary, I think we will soon find the Dow turning back to the downside and in an ugly way.
I repeat what I’ve said many times before: Ultimately, all of this will flip and nearly all markets will re-establish their bull markets. The only exceptions at that time will be the U.S. dollar and U.S. Treasury markets, which will turn back into bear markets.
But for now, the short-term dis-inflationary trends I’ve been warning you about are still intact, and about to accelerate to the downside, in the first two weeks of August.
Conclusions:
If you’re an investor with an eye to the long term, you should continue to preserve your ammo and hedge positions you can’t get out of, for whatever reason. The time will come to add to your long positions — but it’s not here yet.
If you’re a short-term trader, don’t be frustrated by the recent choppy markets, or any short-term losses you may have experienced.
And don’t let all the background noise in the markets, of which there is plenty, distract you. Instead, keep your eye on the true underlying short-term trends … and stay disciplined with your money management.
That’s because you’re about to see some terrific trending moves unfold, with awesome profit potential. So, keep your eyes open and stay tuned!
Best wishes,
Larry
Want to see what the Crowd thinks are the BEST companies for discovery potential?
Want to see those the Crowd thinks are the poorest potential for discovery?
This AM I am showing the top 15% of companies ranked by at least 5 independent scorers followed by the bottom 15%. These are as of yesterday’s close. Currently there are 1036 DiS registrants. Approximately 30% are active scorers of their portfolios. Portfolio average size amongst scorers is about 6 companies. As you can see rankings change. They tend to correlate quite well with forward share price performance. More analysis of performance correlation will follow in another Morning Note.
We will also be correlating changes in rank and changes in individual factor scores (there are ten Discovery factors) in addition to the rank statistic itself, with forward performance and trailing performance.
We are pleased with the recency of the data. You can see that the most of the companies, both top 15% and bottom 15%, have been scored quite recently. It does seem that Discovery investors are focused on the best discovery opportunities as well as those they feel have the least potential.
The final scoring statistic (the Crowd Score, also the company’s final rank) takes into account the low crowd score, high crowd score and the shape of the footprint of uncertainty (or more precisely the footprint of imprecision in our lexicon) much in the way that CAPM deals with distributional aspects of the Gaussian or normal probability model.
We are now gaining traction in terms of scoring companies. Our goal is to increase the breadth (coverage, now at 769 companies from U.S., Canadian, Aussie and HKG exchanges) and depth (number of scorings). We will only report on companies that have a minimum Crowd / scoring size of 5. We will be increasing the minimum as more users populate the system.
Some have suggested that even 5 analysts is not a sufficient Crowd size. However you must realize that these are, for the most part, micro-cap companies that have no coverage. The DiS provides a mechanism for independent Crowd coverage of these heretofore unappreciated and sometimes over-promoted companies. Finally we will provide unexpected factor change analysis as well as individual Crowd factor scores. Company executives can then ascertain how the Crowd views their companies across each factor – both positively and negatively.
Join us and score your portfolio on the DiscoveryScoreboard. It’s free, there are tutorials and we provide you with weekly statistics. You may create as many portfolios as you require. I have portfolios for total stocks, Incubator, mature, legacy and Gold.
You will be able to track the Crowd score for your portfolio of stocks.

www.DiscoveryBoard.com
Note: These ranking are not offered as a buy or sell recommendation. These are scorings by a group of independent Discovery analysts from all walks of life. You must perform your own due diligence before deciding on the accuracy of these rankings. To do this you may use the Discovery Scoreboard to rank these stocks. If so, you will be provided your score as compared to the Crowd score adjusted by your score.
If you are interested in individual factor scores login, score your stock(s) and contact Chris Berry or myself. We will provide individual company factor scores. We may own stocks referenced in these tables.
The material herein is for informational purposes only and is not intended to and does not constitute the rendering of investment advice or the solicitation of an offer to buy securities. The foregoing discussion contains forward-looking statements within the meaning of the Private Securities Litigation Reform Act of 1995 (The Act). In particular when used in the preceding discussion the words “plan,” confident that, believe, scheduled, expect, or intend to, and similar conditional expressions are intended to identify forward-looking statements subject to the safe harbor created by the ACT. Such statements are subject to certain risks and uncertainties and actual results could differ materially from those expressed in any of the forward looking statements. Such risks and uncertainties include, but are not limited to future events and financial performance of the company which are inherently uncertain and actual events and / or results may differ materially. We own shares in Goldcorp and Ucore. These companies are not necessarily recommended as investments. In addition we may review investments that are not registered in the U.S. We cannot attest to nor certify the correctness of any information in this note. Please consult your financial advisor and perform your own due diligence before considering any companies mentioned in this informational bulletin

-
I know Mike is a very solid investor and respect his opinions very much. So if he says pay attention to this or that - I will.
~ Dale G.
-
I've started managing my own investments so view Michael's site as a one-stop shop from which to get information and perspectives.
~ Dave E.
-
Michael offers easy reading, honest, common sense information that anyone can use in a practical manner.
~ der_al.
-
A sane voice in a scrambled investment world.
~ Ed R.
Inside Edge Pro Contributors

Greg Weldon

Josef Schachter

Tyler Bollhorn

Ryan Irvine

Paul Beattie

Martin Straith

Patrick Ceresna

Mark Leibovit

James Thorne

Victor Adair