
Stocks & Equities
|
Put Your Stock Market Shopping List Together Right Now Stocks have gone nowhere over the past year. The S&P 500 closed yesterday just about where it was on July 10, 2011. So buy-and-hold investors have little to show for their efforts. Traders, on the other hand, have had plenty of chances to profit. You just had to pick the right time to buy and have your shopping list ready ahead of time… Last year, for example, we pointed out several buying opportunities here, here, and here. Each of those buy points came on the heels of sharp market selloffs and resulted in immediate 7%-20% gains. But you had to act fast. And you had to be ready BEFORE the market sold off. Now, I’m telling you again – get ready. Stocks are poised for another quick selloff. And if history repeats, any sharp decline in July could lead to a late-summer rally. Take a look at this chart of the S&P 500…
 The blue circles show the similarity between the action over the past month and that of July 2011. The red line marks the key support level at 1,275. At the very least, stocks should come back down and retest the early June low at about 1,275. Right now, it looks like that level will hold, and traders should get ready to buy at 1,275. But it all depends on how a handful of technical indicators look when we get to that point. For example, the McClellan Oscillator – which was overbought last Thursday and hinted at a strong decline – has fallen into neutral territory. Another 50-point drop or so in the S&P 500 should be more than enough to push the Oscillator into “oversold” territory and signal the potential for a rebound. Other indicators show the same thing. But we won’t know for sure until we reach that point. The only thing we do know for sure is last year, the biggest gains from “rebound rallies” happened in the first few days of the rally. Traders who didn’t prepare ahead of time got left behind. Even though the market appears poised for a sharp decline over the next week or two, now is the time to get ready for an imminent rally phase. Don’t buy anything yet – just get your list together. I’ll let you know when I think the time is right to go shopping. Best regards and good trading, Jeff Clark |
|

The term Stock market predictions is a very controversial topic and does seem to give off a negative/non-credible overtone to most traders, investors and the general public. We all know you cannot predict the market with 100% certainty, but knowing that you can still predict the market more times than not if done correctly. Keep in mind that the term “market prediction” is also known as a market forecast or technical analysis outlook and is nothing more than a estimated guess of where the price for a specific investment is likely to move in the coming minutes, hours, days, weeks and even months.
Getting back on topic, this report clearly shows how the US dollar plays a dominant role in the price of other investments. Understanding how to read the Dollar Index will make you a better trader all around when trading stocks, ETF’s, options or futures.
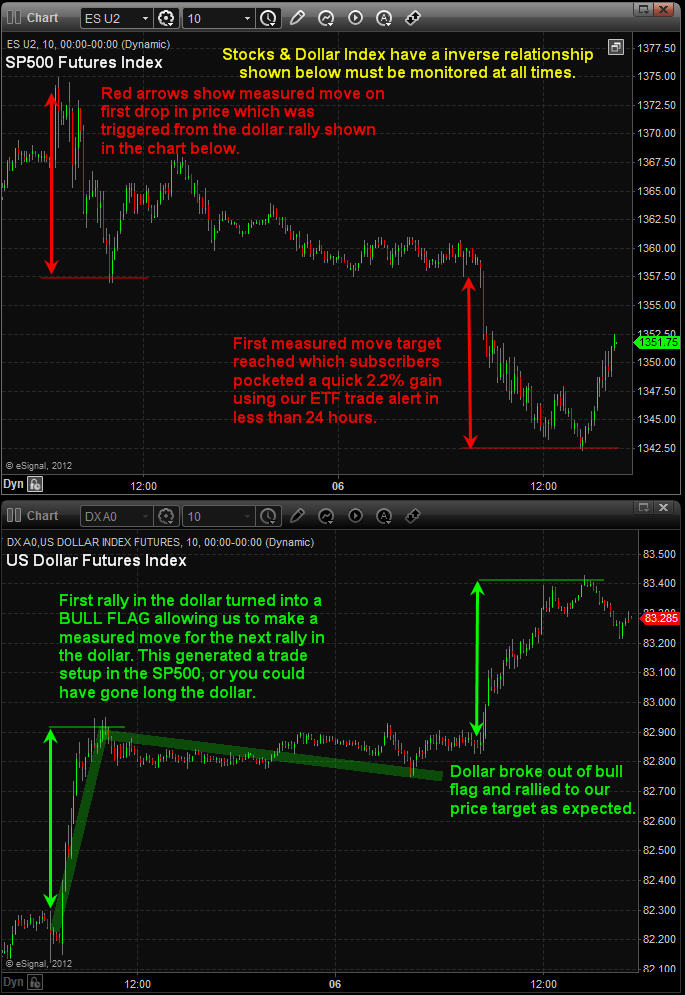
SP500 Stock Market predictions – 10 Minute Chart:
These charts clearly show the inverse relationship between the stock market and the dollar index. Knowing how to read charts (candle sticks, chart patterns, volume etc…) is not enough to give you a winning edge. You must also understand inter-market analysis as all markets are linked together in some way and the dollar plays a major role in where stock prices will move next. Review the charts and comments below on how I came up with my stock market prediction and trade idea.
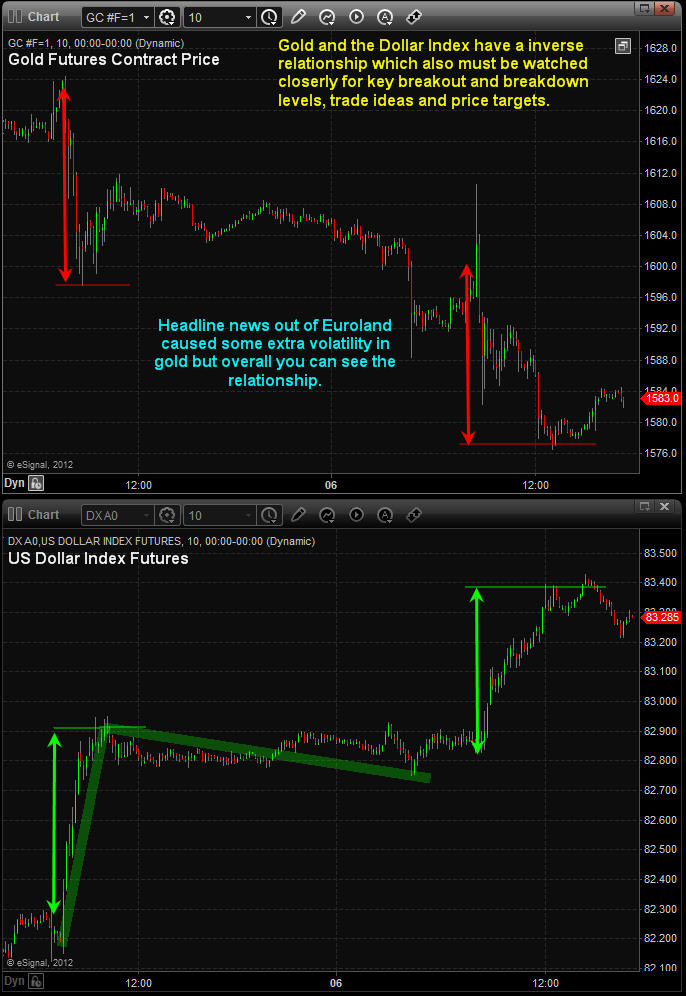
Gold Market Prediction – 10 Minute Charts
Gold is another investment which is directly affected by the price of the dollar. Review charts for more details.
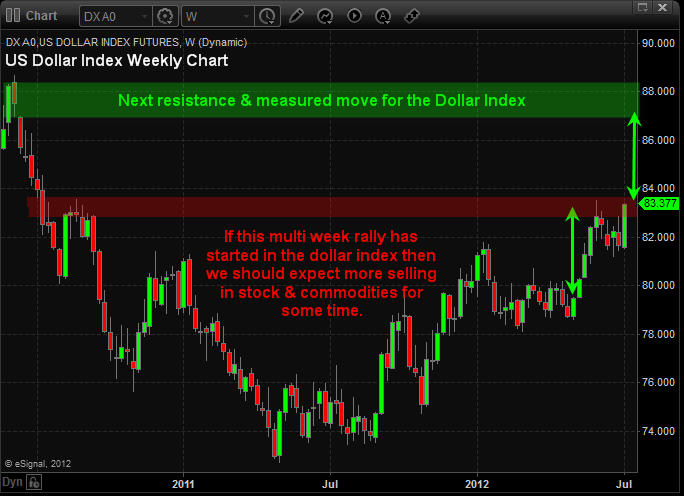
Long Term Stock Market Forecast:
The weekly dollar chart is VERY IMPORTANT to watch as a short term trader and long term investor because trend changes in the dollar means you open positions will also likely change direction.
So, if we apply technical analysis to the dollar chart as seen below. You will notice we are able to create a market forecast and predict roughly where price is likely to move and how long it should take to get there. If the dollar can break above the red resistance level then we can expect a rally for 4 – 8 weeks and a price target around the 87-88 level.
If this is the case then stocks and commodities would likely do the inverse price action and move lower, sharply lower…
Stock Market Predictions & Gold Market Forecast Conclusion:
In short, the next weekly candle stick on the dollar chart could be a game changer for those who are long the overall stock market.
I will admit that the current market conditions are not easy to trade because of all the headline news rolling out of Europe each week along with economic data. And I feel as though we have been tip toeing through a mine field for the past 12+ months waiting for extremely negative news are extremely positive news to trigging a wave of buying or selling that will make our jaw drop, but it has yet to happen. Remember always use stops and don’t get over committed in a headline driven market.
If you would like to receive my free weekly analysis like this, be sure to opt-in to my list:www.GoldAndOilGuy.com
Chris Vermeulen

U.S. software stocks are about to enter a period of seasonal strength. The North American Technology-Software Index has a period of seasonal strength from the first week in July to the last week in September. Average gain per period during the past eight periods was 9.0 per cent. The trade was profitable in six of the past eight periods. What are prospects this July?
The reason for seasonal strength in the sector is anticipation of revenue and earnings gains related to new consumer electronic products expected to launch prior to the Christmas shopping season. Companies are busy developing compatible software prior to launch of the next generation of new products. This year, the launch of next generation products prior to the Christmas shopping season is exceptional. Most notable are the expected launch of iPhone5 in October and the official launch of Microsoft’s Windows 8 operating system as early as this month.
Three North American software Exchange Traded Funds (ETFs) trade on U.S. exchanges. The most actively traded ETF is the Software iShares (IGV US$62.18). Management Expense Ratio is 0.48 per cent. The portfolio holds fifty four actively traded U.S. software stocks listed on U.S. exchanges. The second most actively traded ETF is PowerShares Dynamic Software Portfolio ETF (PSJ US$26.65). Management Expense Ratio is 0.60 per cent. The portfolio holds 31 software stocks. The third ETF is SPDR S&P Software & Services ETF (XSW US$61.49). Management Expense Ratio is 0.35 per cent. The portfolio holds 138 software stocks.
Investors can choose an ETF based on their risk/reward profile. The two most actively traded ETFs are fully diversified with well-known big cap software stocks. Top ten holdings in Software iShares are Microsoft, Oracle, SalesForce.com, Intuit, Adobe Systems, Citrix Systems, Red Hat, Symantec, CA and AutoDesk. The SPDR S&P Software & Services ETF focuses on small and mid-cap holdings with greater price volatility.
On the charts, Following is an eight year seasonality chart on the S&P North American Technology-Software Index.

Software iShares (IGV $62.18) has a positive and improving technical profile. Intermediate trend is up. Support is at $56.97 and resistance is at $66.69. Units moved above their 20, 50 and 200 day moving averages last week. Short term momentum indicators are trending higher. Strength relative to the S&P 500 Index turned positive last week.\
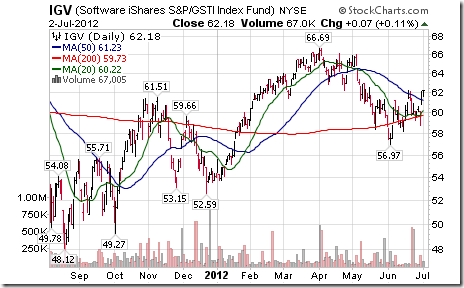
Preferred strategy is to accumulate software ETFs and related equities at current or lower prices for a seasonal trade expected to last until the end of September.
Don Vialoux is the author of free daily reports on equity markets, sectors, commodities and Exchange Traded Funds. He is also a research analyst at Horizons Investment Management, offering research on Horizons Seasonal Rotation ETF (HAC-T). All of the views expressed herein are his personal views although they may be reflected in positions or transactions in the various client portfolios managed by Horizons Investment. Horizons Investment is the investment manager for the Horizons family of ETFs. Daily reports are available athttp://www.timingthemarket.ca/
Dividing the Dow Jones index of stocks by the Gold Price 80 years after its low…
PLENTY OF PEOPLE pay close attention to the Dow/Gold Ratio. Eighty years after it sank to its Great Depression low, you might want to take a look this week, too.
This blunt measure of stocks versus stuff gets nearly 5 million results on Google, posting some 650 unique stories on the Dow/Gold Ratio. Search volumes for the term “Dow Gold” don’t quite match “Kim Kardashian” say, over the last 5 years (nor even “Reggie Bush”). But spiking in late 2008 and mid-2011, they very nearly matched search volumes for “Treasury bonds” – a market priced at twice the value of all the gold in the world. So why the interest?
The Dow/Gold Ratio maps, over time, how the Dow index of US stocks is performing in terms of gold, rather than just in nominal dollars. Dividing the number of points in the Dow Jones Industrial Average by the Dollars in the gold price per ounce is simple enough. The aim is more complex – to show how investing in corporate America – the “world’s most successful economy”, as Harvard professor Niall Ferguson reminds us – is doing versus a lump of non-yielding, relatively useless metal that does so little, it doesn’t even rust.
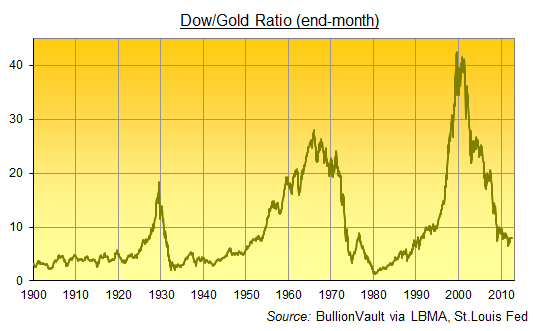
Investment in Corporate America was doing very badly 80 years ago today, for instance. As the Great Depression really got motoring, the Dow/Gold Ratio marked Independence Day by dipping to its lowest reading since 1900, just after the Dow Jones Industrial Average was first born.
That Friday, 8 July 1932, the Dow closed at just 41 points, while the gold price held firm at $20.67 per ounce, then its official price as mandated by the United States’ Gold Standard Dollar. Priced in gold (which was still money back then), the US stock market dipped below 2.0 – and showed a drop of over 90% from its peak of only three-and-a-half years before, hitting what then proved its lowest level of the 20th century.
Yet US Inc. came to do worse still compared to the gold price in January 1980, however, when the Dow/Gold Ratio fell to just 1.0 – down more than 96% from its new record high of New Year 1966. So today’s equity investors might take heart from the last 10 months’ turnaround. Because sliding from the Tech Stock Bubble’s new all-time peak above 40, the Dow/Gold Ratio has risen after hitting a two-decade low beneath 6.5 in September 2011.
Indeed, the Dow Jones index has outpaced the gold price by 25% since last summer. Just think what the outperformance would have been if, say, Apple had been added to the Average instead of, say, Cisco when the Dow was last updated in 2009.
But that’s the problem with taking the Dow as a serious guide to anything much. Or so say its detractors, and they have a point. Or five.
While it’s not immutable – as gold is – the Dow Jones index still changes little, despite the changing fortunes of America’s biggest stocks. The Dow also includes only 30 out of the thousands of listed stocks traded on US exchanges, and 30 hand-picked stocks at that, chosen by a committee with few hard rules. Nor does the index weight those 30 stocks by their size in the market. Instead, it adds up their share prices, and then divides by a “Dow divisor”, an arbitrary number (currently 0.132129493 according to the Wall Street Journal) which itself has to be changed any time there’s a stock split or switch in the membership. That means that highly-priced stocks have more impact than lower-priced stock in much bigger companies.
So as a guide to corporate America, the DJIA falls short. But are broader indices – weighted by market capitalization – any better?
Not much to choose between the DJIA and the more inclusive, more rigorous S&P 500 index then. Not when they’re used to judge equity investing against buying gold. Indeed, the Dow has performed less badly against gold since its all-time top than the broader index has. One ounce of gold now buys 5.1 times as much Dow index has it did in mid-2000, ignoring transaction costs (first into cash and then into stocks). But it buys 6.4 times as much of the S&P 500.
The Dow/Gold Ratio thus captures in a very broad way how badly money invested in productive, go-getting America has fared versus the ultimate lump of do-nothing, get-nothing-but-avoid-absolute-loss stuff. Gold has clearly been the perfect place to bury your savings as the returns to equity capital have been overwhelmed by the risks. That’s also made the Dow/Gold Ratio the perfect long-term indicator for über-bearish equity bears.
“I would expect this out-performance [by gold] to continue for the next few years,” said Swiss wealth manager and Asia-based author Marc Faber in 2005, five years after the Dow/Gold Ratio began its descent. In the end, he forecast, “Gold holders will be able to buy one Dow Jones with just one ounce of gold.” But by early 2009, Faber had revised his opinion – “One day the price of gold will be higher than the Dow Jones,” he told a Barron’s roundtable that January. That same 1:1 ratio – seen briefly in early 1980 as the Gold Price peaked and US stocks headed towards what proved table-banging chance to buy cheap – also appeals to fellow stock-market doomsayer Bob Janjuah of Nomura (see Nov. 2011, or March or April 2012).
“The US Dollar price of an ounce of gold and the Dow will, I believe, converge at or around 1, at some point over the next 2 years or so. I have extremely high conviction on this. What I am not sure on is whether we converge at 7000, or at 14000.”
Put another way, the Dow could hold where it is, or halve in value. The gold price will be many times higher either way on Janjuah’s analysis. (We can’t find him daring to imagine parity might be lower. In that event, with cash itself surging in value and driving the mother of all deflationary depressions, owning gold at a price of say $1000 would likely appeal to very many more people than trusting Dow 1,000.)
Now, you might think appealing to the Dow/Gold Ratio for an equity forecast pretty lame. Especially if you appeal to the ratio’s all-time record bottom as if some iron law of history says that the early 1980s’ low must be revisited before the bear market in stocks is done. It didn’t even get there during the Great Depression!
What’s more, mean reversion would suggest gold is already over-priced and stocks are cheap, with both the Dow/Gold and S&P/Gold Ratios now sitting at just 50% of their half-century averages. So less apocalyptic analysts might pick a less dramatic extreme turning point (as this one did in February 2009). Less aggressive investors might also want to avoid trying to nail the very lowest low, making do with the 6-fold rise in gold’s equity value already seen since 2000.
Thing is, there would be another 6-fold rise on the table if the Dow/Gold Ratio did fall to 1.0 – and even if, buying early ahead of the ultimate cataclysm in stocks, you missed the bullet of failed corporations (the New York Stock Exchange contracted by 1-in-14 listed equities during 1929-1933, and by 1-in-28 during 1978-1982), then the unlisted brokerages holding your stocks for you would still be sure to struggle as the equity market sank. Buying gold gets you off-risk for anyone else’s financial failure, giving you price-risk alone and free from the danger of absolute loss.
That’s what drove the Dollar gold price per ounce to parity with the Dow in 1932 and 1980. If the world’s relentless banking crisis pushes it there again, having the guts to make the switch from preservation to equity-risk will be a rare thing indeed.
Adrian Ash
BullionVault
Gold price chart, no delay | Buy gold online at live prices
Adrian Ash is head of research at BullionVault – the secure, low-cost gold and silver market for private investors online, where you can buy physical gold today vaulted in Zurich on $3 spreads and 0.8% dealing fees.
(c) BullionVault 2012
Please Note: This article is to inform your thinking, not lead it. Only you can decide the best place for your money, and any decision you make will put your money at risk. Information or data included here may have already been overtaken by events – and must be verified elsewhere – should you choose to act on it.

Faber on the eurozone crisis:
In my view the markets are rallying because they were grossly oversold. When markets are grossly oversold, especially markets of Portugal, Spain, Italy, France, then any news that is not disastrous news propels stocks higher.
‘I think that combined with seasonal strength in July, the rally has carried on somewhat. But it is another cosmetic fix, a quick fix that does not solve the long-term fundamental problem of over investment in the euro zone. And what it does, basically, it forces Germans to continue to finance people in Spain and Portugal and Greece that are living beyond their means.’
‘If I were the Germans, if I were running Germany, I would have abandoned the eurozone last week…It is a costly decision, but losses are there and somewhere, somehow, the losses have to be taken. The first loss is the banks. In the case of Greece, one should have kicked out Greece three years ago. It would have been much cheaper.’
On whether he’s picking up European equities:
‘Yes. In Portugal, Spain, Italy, and France, the markets are either at the lows of March 2009, or lower. Along with bad companies and the banks, there are also reasonably good companies. Stellar companies, but they have been dragged down. I see value in equities, regardless of whether the eurozone stays or is abandoned.
‘[I’m buying] anything that has a high yield, or what I perceive to have a relatively safe dividend. In other words, I do not expect the dividends to be slashed by 90%…I am not buying banks, but maybe they could rally. I am just not buying them because I think there will be a lot of equity dilution and recapitalization. I’m not that keen on banks.’
….read more about what currencies he is recommending go HERE or view the entire video below

-
I know Mike is a very solid investor and respect his opinions very much. So if he says pay attention to this or that - I will.
~ Dale G.
-
I've started managing my own investments so view Michael's site as a one-stop shop from which to get information and perspectives.
~ Dave E.
-
Michael offers easy reading, honest, common sense information that anyone can use in a practical manner.
~ der_al.
-
A sane voice in a scrambled investment world.
~ Ed R.
Inside Edge Pro Contributors

Greg Weldon

Josef Schachter

Tyler Bollhorn

Ryan Irvine

Paul Beattie

Martin Straith

Patrick Ceresna

Mark Leibovit

James Thorne

Victor Adair