Stocks & Equities

MORNING AFTER ROUT HITS MARKETS

image002

readers know I’ve been on the “down low” waiting for the Greek elections and FOMC statement. This, and staying liquid, proved the right move for now. After all, as someone famously said, “tomorrow’s another day.”

Markets started the trading day inundated by a litany of crummy economic data. Jobless Claims (387K vs 383K expected & prior revised higher as per normal to 389K) made for a mild headline beat but overall the trend is worsening. The “flash” (why do we need one?) PMI estimate came in cold (52.9 vs 53.8 expected & prior 53.9); Bloomberg Consumer Comfort Index fell again (-37.9 vs -36.8 previous); Existing Home Sales were poor dropping 1.4% (4.55M vs 4.62M prior) or housing market not “fixed”; if that weren’t enough, the important Philly Fed Survey imploded (-16.6 vs .5 expected & prior -5.8).

Put these together and Operation Twist seems pathetically inadequate requiring perhaps another Fed meeting adjustment which would be seen by many as more politically motivated. Let’s face it; Bernanke & Co have gotten things wrong. The administration and congress haven’t been helpful either.

Goldman Sachs (GS), and no doubt prepositioned, issued a short S&P 500 call. Late in the trading day rumors Moody’s would issue bank downgrades this evening and into Friday morning. Names mentioned for downgrade include Citigroup (C), Bank of America (BAC), JP Morgan (JPM), Goldman Sachs (GS) and Morgan Stanley (MS). For some banks this could mean margin calls especially for MS.

In the eurozone, the Bundesbank rejected Italy’s Monti call for ECB bond purchases—Europe not “fixed”.

On the earnings front, Micron (MU), Red Hat (RHT) and CarMax (KMX) all reported results that missed analysts’ expectations and those stocks fell sharply as did just about everything else

Commodity markets (DBC), (USO) & (JJC) for example continued their decline. The dollar (UUP) was higher on eurozone confusion and gold (GLD) fell sharply as investors scramble for cash to meet inevitable margin calls.

Volume was higher by recent averages on the large sell-off which is quite common for days like this. Breadth per the WSJ was quite negative and short-term overbought conditions (noted here yesterday) have been wiped-out.

image004-101

290 13403182053940_rId6

290 13403182053940_rId7

290 13403182053940_rId8

290 13403182053940_rId9

290 13403182053940_rId10290 13403182053940_rId11

290 13403182053940_rId12-1

290 13403182053940_rId13

290 13403182053940_rId14

290 13403182053940_rId15

290 13403182053940_rId16-1

290 13403182053940_rId17

290 13403182053940_rId18

290 13403182053940_rId19

290 13403182053940_rId20

290 13403182053940_rId21

290 13403182053940_rId22

290 13403182053940_rId23

290 13403182053940_rId24

 290 13403182053940_rId25

290 13403182053940_rId26

290 13403182053940_rId27

290 13403182053940_rId28

290 13403182053940_rId29

290 13403182053940_rId30

290 13403182053940_rId31

290 13403182053940_rId32

290 13403182053940_rId33

290 13403182053940_rId34

290 13403182053940_rId35

290 13403182053940_rId36

290 13403182053940_rId37

290 13403182053940_rId38

290 13403182053940_rId39

290 13403182053940_rId40

290 13403182053940_rId41

290 13403182053940_rId42

290 13403182053940_rId43

290 13403182053940_rId44

290 13403182053940_rId45

290 13403182053940_rId47

290 13403182053940_rId48

290 13403182053940_rId49

290 13403182053940_rId50

290 13403182053940_rId51290 13403182053940_rId52

290 13403182053940_rId53


290 13403182053940_rId54

290 13403182053940_rId55

290 13403182053940_rId56

The NYMO is a market breadth indicator that is based on the difference between the number of advancing and declining issues on the NYSE. When readings are +60/-60 markets are extended short-term.

290 13403182053940_rId57

290 13403182053940_rId54

The McClellan Summation Index is a long-term version of the McClellan Oscillator. It is a market breadth indicator, and interpretation is similar to that of the McClellan Oscillator, except that it is more suited to major trends. I believe readings of +1000/-1000 reveal markets as much extended.

290 13403182053940_rId58

The VIX is a widely used measure of market risk and is often referred to as the “investor fear gauge”. Our own interpretation is highlighted in the chart above. The VIX measures the level of put option activity over a 30-day period. Greater buying of put options (protection) causes the index to rise.

Moody’s made the announcement of lowering ratings on 15 banks. The funny news is Morgan Stanley was only cut 2 notches causing the stock to rally in late trading because it was better than expected. Really, you can’t make this stuff up.

Here is the full statement.

There is no economic news Friday unless some ring in from the eurozone.

Disclaimer: The ETF Digest maintains active ETF trading portfolio and a wide selection of ETFs away from portfolios in an independent listing. Current “trading” positions in active portfolios if any are embedded within charts: Lazy & Hedged Lazy Portfolios maintain the follow positions: VT, MGV, BND, BSV, VGT, VWO, VNO, IAU, DJCI, DJP, VMBS, VIG, ILF, EWA, IEV, EWC, EWJ, EWG, & EWU.

The charts and comments are only the author’s view of market activity and aren’t recommendations to buy or sell any security. Market sectors and related ETFs are selected based on his opinion as to their importance in providing the viewer a comprehensive summary of market conditions for the featured period. Chart annotations aren’t predictive of any future market action rather they only demonstrate the author’s opinion as to a range of possibilities going forward. More detailed information, including actionable alerts, are available to subscribers at www.etfdigest.com.

Disclosure: I have no positions in any stocks mentioned, and no plans to initiate any positions within the next 72 hours.

Please help improve Seeking Alpha:

Did you find this article useful?

Yes No

This article is tagged with: Macro ViewMarket OutlookUnited States


2010′S BEST PERFORMING HEDGE FUND MANAGER’S NEXT BIG INVESTMENT IDEA

Don Browstein is a former philosophy professor, the founder of Structured Portfolio Management (named the best performing hedge fund in 2010, after returning 49.5 percent and 134.6 percent in 2009), a guy who supposedly once told a trader “The only way you can leave this firm is in a body bag” while brandishing a baseball bat, and the person his new tenants will have to answer to if next month’s rent is one day late.

Don Brownstein’s Structured Portfolio Management LLC plans to start a fund to buy and rent out homes. The firm, based in Stamford, Connecticut, may introduce the fund to investors within weeks, Brownstein said in a letter to clients dated June 12, a copy of which was obtained by Bloomberg News. He didn’t say how much capital has been raised or targeted. “There will be a significant transformation in the way in which single family homes are owned and occupied in the United States,” Brownstein said in the letter. The strategy is to acquire homes through distressed sales and rent them out profitably, perhaps to the former owner, then “sometime in the not distant future, sell the houses and reap a profit from a recovery in prices.”

….read more HERE

donbrownstein


Trader Sentiment Wrong for a Top

DOW  + 96 on 2000 net advances 

NASDAQ COMP+ 34 on 1300 net advances

 SHORT TERM TREND    Bullish

 INTERMEDIATE TERM TREND      Bullish

  In this country, there is anticipation that on Wednesday the Fed will announce further easing either in the form of QE3 or an extension of operation twist. The latter is more likely and I believe that there could be some selling on the news.   A couple of elements were responsible for the uptrend on Tuesday. Firsts, there were some favorable developments out of Europe, chief among them a better than expected Spanish bond auction.

   If the Fed is inclined to move, they would most likely have to do so tomorrow. The election is looming and they don’t like to appear as if they are playing politics.

   If we do get a selloff, it would most likely be an opportunity to buy. Sentiment is wrong for a top. We are seeing a lot of pessimism on the part of traders. For instance, the CBOE put call ratio remains quite high.

277

TORONTO EXCHANGE:  Toronto was up a whopping 187. Good show.

GOLD: Gold finally had a down session, down $8 in spite of a weak dollar.

BONDS: Bonds were down again on Tuesday.

THE REST: The dollar was sharply lower, but this didn’t help gold and silver which were down. However, copper and crude oil were higher.

BOTTOM LINE:  

   Our intermediate term systems are on a buy signal.


It’s Turnaround Tuesday and Two Days Of FOMC Meetings – Expect A Market Retracement!

Less than one month ago, on May 25th Dan Dorfman and I had our final interview. I’ve known Dan since the early 1980s and those who saw him on Louis Rukeyser’s Wall Street Week or other national news channels including CNBC know he was a living legend, a trendsetter, an icon. I was shocked to learn of his passing this weekend. I will truly, truly miss him. He was a great man, a great journalist and a good friend. Please read Neal Cavuto’s tribute below which was broadcast on Fox News.

———————————————

STOCKS – ACTION ALERT – BULL – I BELIEVE CYCLICAL AND SEASONAL PATTERNS TO THE UPSIDE INTO THE FALL ARE NOW THE PREVAILING AND DRIVING FORCE TO THE EQUITY MARKETS HELPED BY THE EXCHANGE STABILIZATION FUND AND THE WORKING GROUP ON FINANCIAL MARKETS (THE PLUNGE PROTECTION TEAM) – WITH BERNANKE PROVIDING WALL STREET AND OBAMA A ‘PUT’ PROTECTING THEM TO THE DOWNSIDE.

Well, it’s ‘Turnaround Tuesday’ but also the first day the FOMC meets. With markets rallying yesterday, the greater probability is that we begin to pull back. Also, my current thinking is that with so much news behind the markets (the vote in Greece, the FOMC meeting, the G-20 meeting, etc.) this week, we may see the markets back off a bit anyway unless some newer ‘market moving’ positives unfold such as a dramatic announcement that QE3 is now being implemented. That I do not expect, even though secretly it is very likely being implemented which, unfortunately, is the modus operandi of the Fed for decades. There is too much at stake. For one – Bernanke’s job. We know if Obama is not re-elected Bernanke is likely heading back to Princeton University.

Adding to the short-term bearish case today is the fact volume slowed to the upside on Monday and the fact many indexes were up five or six days in a row. 

Picture 1


VRTRADER.COM Trial Signup:

THE RENEWAL OF YOUR SUBSCRIPTION IS AUTOMATIC. YOUR CREDIT CARD WILL CONTINUE TO BE BILLED UNLESS YOU NOTIFY VRtrader.com SEVEN DAYS PRIOR TO SUBSCRIPTION EXPIRATION EITHER VIA EMAIL POSTING THE WORD ‘UNSUBSCRIBE’ IN THE SUBJECT BOX OR TELEPHONE US AT (928) 282-1275 OF CANCELLATION. NO REFUNDS ARE AVAILABLE ON SILVER, PLATINUM OR VR FORECASTER (ANNUAL FORECAST MODEL) SUBSCRIPTIONS.

Welcome and congratulations on choosing VRTrader.com as a source for your stock market commentary, information and analysis for the U.S. Stock Market. Needless to say we are very happy that you are joining us for AT LEAST the next 30 days days and look forward to providing you rewarding and inciteful information that will help you toward your goal of succeeding in the markets.

Here is the Special Trial Offer: Use this month to kick our tires. Pay 50% for the first 30 days (No refund) and sample our Silver or Platinum service and then decide what works best for you. If you aren’t 100% ready to move forward, simply email us to cancel one week before your 30 day 50% off trial subscription ends and it will be canceled and you will not be charged ANY FURTHER, no questions asked. Just send an email to mark.vrtrader@gmail.com” or call 928-282-1275 to cancel. You will receive an emailed confirmation of your cancellation at that time.

The 30 day trial is allowed one time only. By taking this 30 day 50% trial, you agree to be charged the full cost of the monthly Silver or Platinum service (choose one only) at the end of the 30 day trial subscription period, unless you cancel first. The regular Silver monthly rate is $49.40 and the Silver quarterly rate is $133.50. The regular Platinum monthly rate is $129.95 and the Platinum quarterly rate is $350.85. The special trial 50% off trial rates are listed below. Sign up today!

There are no refunds or pro-rata refunds offered at VRTrader.com for any subscription. You are being offered a 50% discount for trying our service for the first 30 days only!

….

The New Reward for Risk Tool Plus 2 Hot Stocks

perspectives commentary

We added a simple but very important feature to the Stockscores charts this past week. In the charting tab you can control the settings of the Stockscores charts and you will now find the ability to draw reward for risk lines on the chart.

This is a simple tool but it is based on one of my core philosophies about the market. While most investors are focused on buying or shorting the right stock, what everyone should focus on is risk management. Understanding the relationship between reward and risk is essential to being successful in the market, whether you are a short term trader or a long term manager of a retirement portfolio.

When most people judge a stock trade, they do so by looking at how much money they made. A trade that makes $2000 is better than a trade that made $200.

What would you say if we expanded our judgment of these trades to include some reference to the risk taken? If you risked $5000 to make $2000, is that a good trade? What if you risked $100 to make $200?

With this in mind, the second trade now looks like the better one. You may be wondering, however, how we measure the risk of the trade.

Risk is not about how much of the stock you buy. You can buy $100,000 of a stock and only have $1000 of risk. Risk is controlled by limiting the downside with a predetermined stop loss point. If you buy a stock at $10 with a stop loss at $9, you are risking $1 a share. If you buy 1000 shares, your risk is $1000.

This assumes that you have the discipline to hit the sell button if the stock falls to $9 and that it does not gap down through your stop loss price to give you a bigger loss. As long as we keep our discussion simple, this is a good definition of risk.

Reward is the difference between your exit price and your entry price. Sell this stock at $13 and you have made $3 of reward for $1 of risk giving you a reward for risk of 3. Essentially, this means that this winner pays for 3 losers.

You might be thinking about this concept with the idea that using a tighter stop loss point can really improve the reward for risk metric. If so, you are right, a stop at $9.50 rather than $9 now gives $0.50 a share of risk and $3 of reward for a reward for risk ratio of 6. By tightening the stop you have doubled your reward for risk.

Of course there is cost to using a tighter stop. As you narrow the difference between your entry price and your stop loss point you also lower your chance for success. The trick is to find the best point for that stop where you can maximize your reward for risk without sacrificing your probability of making a profit.

To help you with understanding reward for risk, we have added a tool to visualize it on the Stockscores charts. If you go to Stockscores and call up any chart, you will see a Charting tab either beside the small format charts or below the large format. At the bottom of the Charting tab are places where you enter the Entry and Stop Loss price. Then click on Create Chart and you will see those lines drawn on the chart, showing the reward for risk multiples. I use these lines to measure my success on trades but also to help me pick exit points. That method is something I teach in my trading courses.

The most important takeaway from this new tool is the importance of planning your losses. You should always pick a stop loss point and stick to it to limit downside when you make a failed trade. Holding on to losing trades is the greatest failing of investors.

Stop your losses when you are wrong and let your profits when you are right. Hopefully this new tool will help to emphasize the importance of this simple but often overlooked concept.

perspectives strategy

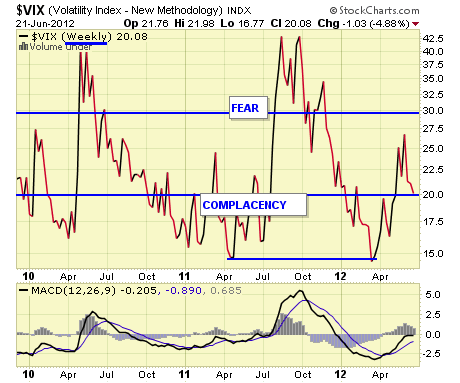
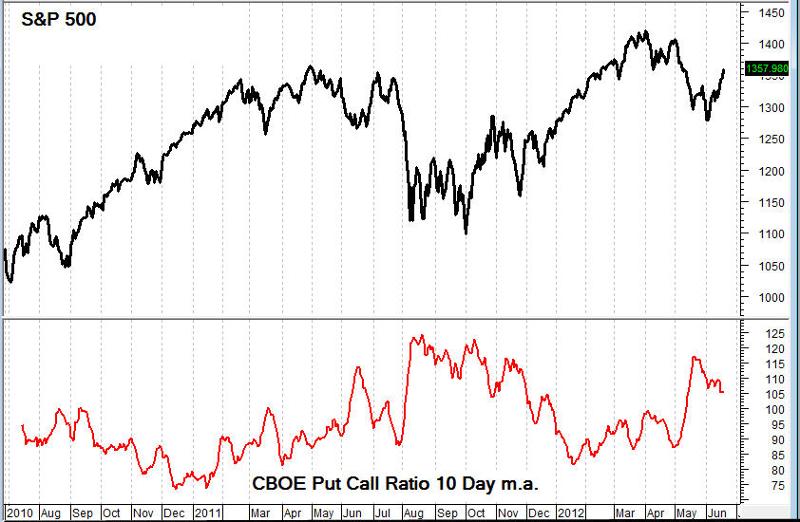
The markets made some positive steps toward an end of the weak and uncertain markets that we have endured for the past few months this week. Performance on Thursday and Friday were a good show of optimism in to next week. I am cautiously optimistic that we are in the early stages of a summer rally that can hopefully get started once the psychological overhang of the Greek election has passed Monday.

Trading on Monday will be critical to determining whether the buyers can take back control of these markets. Investors were speculating this week that they would but I think owning a lot of stocks in to Monday was too risky for most.

If the market is able to remain stable, I think we can start to accumulate stocks again after being mostly in cash for some time. Here are a few stocks that made decent showings on Friday and have some potential.

perspectives stocksthatmeet

1. T.ECA
Long a dog among the Canadian large cap companies, T.ECA is starting to turn around. The stock has a lot of work to do still and I consider a trade on this stock having about a 50/50 chance of working. However, if it works the upside is far greater than the downside, making it a stock worth considering. Has a nearly 4% yield. Support at $20.50.

Picture 2

2. PVA
PVA is another Energy stock, a sector that was a leader on Friday. This stock has a similar chart to T.ECA and I would not take a trade on both as they will be highly correlated to one another. An inspection of the chart shows that this stock has had a sub 60 Sentiment Stockscore for many months but has moved up and through that important threshold in the last couple of weeks. Today, the stock broke out through resistance with abnormal volume, a positive sign that it wants to go higher. Yield just above 4%. Support at $5.50.

Picture 1

References

  • Get the Stockscore on any of over 20,000 North American stocks.
  • Background on the theories used by Stockscores.
  • Strategies that can help you find new opportunities.
  • Scan the market using extensive filter criteria.
  • Build a portfolio of stocks and view a slide show of their charts.
  • See which sectors are leading the market, and their components.

    Disclaimer
    This is not an investment advisory, and should not be used to make investment decisions. Information in Stockscores Perspectives is often opinionated and should be considered for information purposes only. No stock exchange anywhere has approved or disapproved of the information contained herein. There is no express or implied solicitation to buy or sell securities. The writers and editors of Perspectives may have positions in the stocks discussed above and may trade in the stocks mentioned. Don’t consider buying or selling any stock without conducting your own due diligence.