
Stocks & Equities

Focussed Diversification – Building Your Simple Small-Cap Growth/Value Stock Portfolio & Two BUYs
Most financial advisors recommend that you diversify for your own protection. What they fail to tell you is that it is also for their protection. For someone starting out, or with a relatively small portfolio, a broad based ETF or combo of ETF’s may be a good idea. Indeed, a personal stock portfolio must be diversified to some degree. After all, none of us wishes to “put all our eggs in one basket” and expose ourselves to the inherent risk of holding only one stock.
But if you want to beat the market, you cannot be the market.
The problem we see often today is that many funds and other investment products on the market hold between 50 and 300 stocks. According to the modern portfolio theory, you come very close to achieving optimal diversity after adding about the 20th stock to your portfolio.

So why do fund and investment managers operate this way (practice over-diversification) and create below average returns for your portfolios overtime? Well, we think the following quote from the world’s greatest investor, Warren Buffett sums it up.
“Wide diversification is only required when investors do not understand what they are doing.” – Warren Buffett
To give you an idea of how little Buffet himself believes in over diversification, recently a study of his portfolio over the last 25 years was completed. Within his multi-billion dollar portfolio he averaged only 33 stocks per year. Perhaps more astonishingly, his top 5 holdings, on average, comprised 73% of his portfolio – so much for diversification.
While we do not advocate under-diversification, to beat the market long-term we recommend a strategy of “focussed diversification”, within the growth segment of your portfolio.
“Why not invest your assets in the companies you really like? As Mae West said, ‘Too much of a good thing can be wonderful. ” – Warren Buffett
Remember, when building your Small-cap Growth Stock Portfolio, we suggest you follow the following simple steps.
-
- Purchase between 10-12 Small-Cap Stocks and equally weight each selection initially. For example; $100,000 portfolio with 10 stocks would allocate $10,000 per stock.
- Construct your portfolio over at least a year period – ensuring you do not buy at a market peak within a year or cycle.
- Buy companies from a diverse set of industries within our recommendation list to achieve appropriate diversification.
- Review and pay careful attention to our updates and use our continuing research to guide your decisions to BUY, HOLD, or SELL given your time horizon and tolerance for risk.
If 1 stock performs very poorly , 3 average, 2 above average, 2 very well, and 2 excellent, it has been our experience that the overall return of a Small-Cap Growth Stock Portfolio constructed in this manner can significantly outperform the market overtime. We do our research and focus our buy recommendations on the companies that rank highest within our growth and value criteria. By investing with conviction and with a realistic time horizon, this strategy allows our winning recommendations to truly affect the value of your portfolio over time.
Mini Portfolio In-Action
For those that attended the 2012 World Outlook Conference this past February 10th and 11th, we gave your 10-12 stock portfolio a kick start with 4 recommendations. While the recommendations are designed to perform over a 1-5 year period, we thought it might be at least mildly instructive to see how the stocks have performed in the 4 months following the conference.
In theory, Small-Cap Growth Stocks are considered “riskier assets” than your average mid or large cap stock and in the risk-off, down market that we have been again exposed to for at least 3 months now, they are prone to under-performance.
Since the Outlook Conference, the S&P TSX Composite Index is down -8.25%, the S&P/TSX Venture Composite Index (smaller Canadian stocks) is down a whopping -25% and yet, 3 of the 4 companies KeyStone recommended at the conference are up in price. In fact, the top gainer of the 4 has added 24.53% in the past 4-months, followed by gains of 21.20%, and 17.42%, with the single losing stock of the group down only -3.66%. The average gain over the 4 months was 14.87%, besting the TSX by 23.12% and the TSX-Venture exchange by around 40%.
So how can this be? Should not these so called risk assets underperform in a down market? Conventional financial theory will answer in the affirmative, but in the current market conditions, we do not think you should apply this wisdom with such broad strokes. At present, we are in a zero to minimal growth environment making “stock selection” paramount in your search for above average returns.
For those not burying their collective heads in the sand, there is positive news out there in select pockets from good companies in solid niche markets. In fact, the very basic rationale behind why our selections from the World Outlook Conference (and in our Small-Cap & Income Stock Recommendations at www.keystocks.com) have significantly bested the market to date is because they continue to individually perform well financially. In the past 4 months, two of the companies have increased their dividends (one of them twice) and all have managed to report record quarterly earnings. Each company continues to deliver solid cash flow and hold limited debt positions. Long term, this is a recipe for success.
While the volatility is not pretty, the correction over the past 3 months is not a surprise to us as the gains of the preceding 4-5 months came in the face of the same challenges we are starring at now. In fact, we had commented on numerous occasions that the strong upturn seem to fly in the face of the zero to low growth environment that much of the globe was facing for the mid to long-term as austerity become a reality.
But in the near term, markets will do what they will do. Expect investors, particularly inexperienced ones, to continue to support the volatility over the next several years – piling in to push markets too high once a rally is going and jumping out without careful reflection when the markets chart a downward course. In a perfect world, we would like to see rational thought guide the day, with a view to the long term. This type of thinking is Pollyannaish as we are dealing with human beings at the switch for the most part in the investing world and if I can guarantee one thing, they will certainly be irrational in the near term – particularly in these uncertain times.
Of course, without this irrational behaviour, we would not find great bargains in a sell-off as the proverbial babies are thrown out with the bath water. Once again, we will take advantage of this over the course of the summer and likely make more BUYs over the next 6 months than we have made in the preceding 8 months. From panic comes opportunity – we will be greedy when others are fearful. While the fear may not have reached a tipping point, bargains are appearing and we are looking at a number of companies that have seen their share prices drop from 5-35%, despite posting strong to record earnings and giving solid outlooks.
Recent BUY Recommendations Updated
Finally today, I will update two companies from our 2012 World Outlook Small-Cap Portfolio that continue to rank highly in our coverage universe to illustrate why they have shown solid gains and why they could continue to outperform.
The first, Exco Technologies Limited (XTC:TSX), is a global supplier of innovative technologies servicing the die-cast, extrusion, and automotive industries. Headquartered in Markham, Ontario, and with roots that date back to 1952, Exco, through its ten strategic locations, employs 2,169 people and services a diverse and broad customer base. Exco’s Casting and Extrusion division accounted for 63.33% of sales in Q2 2012 and its Automotive Solutions division accounted for the remaining 36.67%.

After many years of underfunding and false starts, Exco’s customers (North American, European, and Asian OEMs ) are now committed and investing heavily in the launch of more fuel efficient powertrain architecture. North American auto manufacturers simply have to develop more fuel efficient vehicles to compete. From the new generation of engines to the latest nine speed transmissions, Exco plays a critical role in the tooling up of many of these projects for numerous OEMs worldwide. From early 2011, the market for its services has been robust, but Exco had difficulties handling the volume with efficiency which hurt profitability. Management now believes the company is well positioned to cope with these pressures in 2012 and going forward, producing further profitability gains – we saw this already in Q1 and Q2 2012.
On April 25, 2012, Exco announced its Q2 2012 revenue rose 16.5% to $63.2 million from $54.23 million in the same period of last year. Year-to-date sales increased 22.3% to $121.6 million. Net income for the second quarter was $6.5 million, or $0.16 per share, compared to consolidated net income of $4.9 million, or $0.12 per share, in the same quarter last year. Year-to-date, consolidated net income was $11.8 million, or $0.29 per share, compared to consolidated net income of $6.9 million, or $0.17 per share, last year.
Cash provided by operating activities increased to $8.1 million in the second quarter from $1.3 million last year and $14.8 million year-to-date compared to $823 thousand last year. These increases are primarily the result of improved earnings. Exco’s cash position at the close of the second quarter ended March 31, 2012, increased to $22.4 million, or $0.55 per share, from $15.4 million at the beginning of the year, reflecting continuing improvement of earnings in the current year. This appears to demonstrate that the build-up in working capital caused by climbing sales over the last numerous quarters has begun to level off. Management has stated that Exco will continue managing its business conservatively with a low overall cost structure, strong margin, and a very strong balance sheet with no bank debt. The company’s strong balance sheet positions it well to expand internationally and weather a downturn (although a downturn does not appear imminent as business in its segment remains robust).
The company’s solid outlook, strong balance sheet, and strong cash generation allowed management to increase Exco’s quarterly dividend 25% from $0.03 per common share to $0.0375 per common share. The dividend will be paid on June 29, 2012, to shareholders of record on June 13, 2012.
Despite the strong rise we have participated in since late January of this year (shares jumping over 50%), fundamentally, Exco remains relatively attractive in its current range. We have now upped our earnings estimate from $0.54 to $0.56 for 2012. This leaves the company with a forward looking PE of 8.30 based on fiscal 2012 earnings. Our increase in the estimate is based on strong Q1 and Q2 2012 numbers, which beat estimates and management’s “conservative” outlook for 20% revenue and 50% profit growth in 2012. Book value also continues to increase and currently stands in the range of $3.34 per share. Add in the company’s 25% dividend increase, which signals strong cash flow and a positive outlook, and currently this gives the stock a yield 3.2% and the story continues to be reasonably compelling.
With the stock in the $3.20 range, we found it to be an excellent value. In our latest update, with the stock in the $3.98 range, we found it to be a very good value. At present, despite the 17% rise, we continue to see the stock as good value given that it is heading into a historically strong Q3 and the fact that the company continues to have room for operational improvement. Exco has been a solid winner and valuations remain reasonable.
The second company we will look at is a true micro-cap. Athabasca Minerals Inc. (ABM:TSX-V) is a management and exploration company developing and exploring industrial minerals in Alberta, providing aggregate management for the construction, oil sands, and infrastructure industries of the province. The company is the operator of one of the largest aggregate operations in Canada and holds a significant land position in the Athabasca region of Alberta. On November 20, 2008, the company completed the non arm’s length acquisition of Aggregates Management Inc. (AMI). The acquisition resulted in Athabasca holding management contracts with the Alberta government for the management of the Susan Lake aggregate operation and Poplar Creek aggregate operation. The Susan Lake management contract is in the fourth year of a second ten-year contract.

Historically, all of the company’s revenue has been derived from management contracts – but this is changing in 2012. The company is advancing its wholly-owned aggregate projects in this region including its Kearl, Logan, Pelican Hill, and House River operations. We expect the three to be operational and generating higher margin income in 2012.
Sand and gravel aggregates are the most common construction materials used in the world. Since the invention of cement, aggregates in the form of concrete have become the building blocks of civilization. Yes, they are not as sexy as gold or silver, platinum or lithium, but they are basic, boring materials that are in high demand in Alberta’s vast and ever expanding oil sands. Perhaps most importantly, they provide strong cash flow for Athabasca, which is well positioned to service this market for the next several decades.
Athabasca derives the majority of its revenues from producing various types of aggregates in Northern Alberta. The ability to remove gravel from its gravel pits is hampered by cold and wet weather conditions. As a result, winter and spring are traditionally the slowest time for the company. However during Q1 2012, Athabasca reported its record high sales volume, with unusually increased demand for aggregates. As various oil sands companies have announced plans to increase their production, strong continuing demand for aggregate is anticipated by management. In Q1 2012, Athabasca announced total tonnage sales of aggregate increased by 123.6%, with 1,966,979 tonnes sold compared with 879,613 sold in the three months ended February 28, 2011. Aggregate sales on which management fee revenue is earned (Susan Lake) rose 101.0% on sales of 1,768,326 tonnes for the quarter compared to 879,613 tonnes during the three months ended February 28, 2011. The remaining 198,653 tonnes were sold from the House River pit, for which there were no sales made during the comparative period.
Q1 2012 revenues jumped to $4.45 million, comprised of $2.85 million aggregate management fee revenue and private pit gravel sales of $1.61 million. This compared to Q1 2011 total revenue of $1.35 million, comprised entirely of aggregate management fee revenue, as sales from private pit gravel operations had not yet commenced. During the quarter, total revenue had increased by 230.2% and aggregate management fee revenue increased by 111.0%.
Q2 2012 net income jumped to $784,408, or $0.029 basic income per common share, from a net loss of $1,890, or $0.000 per basic income per share, during Q1 2011. Due to a solid outlook and the fact that fiscal 2012 sales have begun at a strong rate, management now anticipates that aggregates sales for this fiscal year will surpass the 7,758,612 tonnes sold in fiscal 2011.
Despite its rise of 65% since our recommendation earlier in the year at $0.40, on a valuation basis, at $0.66, the stock continues to appear cheap long term. On a trailing basis (over the past 12 months), the company has now posted earnings-per-share of $0.131 giving it a PE of around 5. With an improving balance sheet, better liquidity, strong cash flow, the potential for further wholly-owned pit sales in Q3 and Q4, and strong near to long-term demand forecasted for its managed operations, the stock remains attractive.
Remember, these are just two ideas to look over, see if they fit with your strategy and potentially begin the construction of your Profitable Small-Cap Growth Stock Portfolio. While we continue to like each company, they are part of an overall “Focused Diversification” portfolio strategy (detailed above). As such, if you are planning to utilize this strategy, we urge you to follow the complete process and not just take the proverbial “flyer” on two individual stocks – this creates too much company specific risk.
Remember, in the current environment, we anticipate patiently adding to our Focus Buy List over the next 6 months, so there is no rush to purchase your entire Small-Cap Portfolio at one time in the market cycle. We expect two new BUYs for upcoming release.
Thank-you ladies and gentlemen – profitable investing.
Disclosures: KeyStone Ownership: XTC, ABM. Employee Ownership: XTC, ABM.
Ryan Irvine,
President & CEO
KeyStone Financial
Growth Stocks: www.keystocks.com
Email: rirvine@keystocks.com“>rirvine@keystocks.com
Phone: 6 0 4 – 2 7 3 – 1 1 1 8


You do not need to be terribly good at reading the tea leaves to spot the alarm calls for next Monday morning. Greece will have its general election result and Egypt may well have elected a member of the Islamic Brotherhood as president.
Call it a double whammy if you like, and it is so obvious that markets are going to anticipate it, then again being confronted with a new reality is never quite the same as expecting it to happen.
New hope or hopeless case?
….read more HERE

Unfortunately, optimistic views on our economy and/or our markets are generally met with resistance and even criticism. One of the most common arguments to counter my optimism is the statement by my antagonists that they are realists. Thereby they are implying that my optimism is unrealistic, and moreover, that a pessimistic outlook is more realistic than an optimistic one. Yet, there is a preponderance of supporting evidence for optimism that many ignore or refuse to even consider.
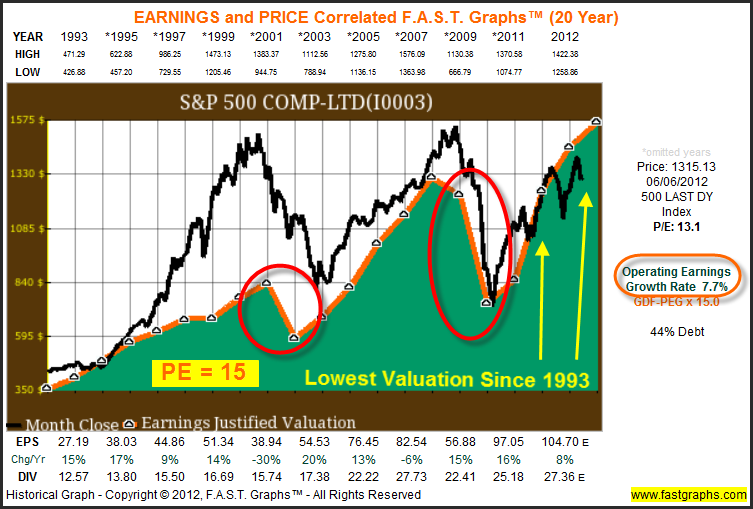
In an attempt to clarify my point, I presented the following F.A.S.T. Graphs™ (actually one very close to this one, but with slightly different dates) in my most recent article illustrating that the S&P 500 is modestly undervalued at this time. The orange line on the graph represents a P/E ratio of 15 applied to an earnings growth rate (slope of the line) of 7.7% since the beginning of calendar year 1993. All of the data is historically actual, with the exception of an estimate for 2012 earnings currently at $104.70 per share.
Now, what this graph clearly shows is that the actual blended P/E ratio of the S&P 500 of 13.1 based on actual earnings since 1993, is one of the lowest it has been (remember the orange line is a P/E of 15). This is not a statistical reference, but a picture of what has actually occurred and how the market has actually valued the S&P 500 since 1993. Clearly, the market has overvalued the S&P 500 (the black price line above the orange line) for most of this almost 20-year period, until and since March of 2011.
….read more HERE
Marc Faber: “I’m convinced that Europe is actually in recession today … There is a meaningful and more substantial slowdown in China than the official statistics would suggest. At the present time there probably is hardly any growth at all, so that slows down the demand for industrial commodities. That then slows down the production in countries that produce industrial commodities. So you have essentially a chain, a vicious spiral going through the global economy, which means that corporate profits in the U.S. … will disappoint” – in Fox Business News
Richard Russell: That bear market signal in early May — did it work or was something else going on? From its April low, the Dow has rallied back strongly, and I’ve been wondering, “Is something else going on, something more ominous than simply a bear signal for the economy and stocks in the United States?
Then I read a paragraph in the latest issue of The Week, and that paragraph got me thinking. Here, I’ll reproduce that paragraph below, just as it appeared in the magazine, The Week.
Richard Russell: I read the above paragraph three or four times, and I wondered, “Could the May bear signal have even more significance than I imagined at the time? Was it a signal for a global contraction or depression?
INTERESTED IN SUBSCRIBING? GO HERE
|
Russell began publishing Dow Theory Letters in 1958, and he has been writing the Letters ever since (never once having skipped a Letter). Dow Theory Letters is the oldest service continuously written by one person in the business. Russell gained wide recognition via a series of over 30 Dow Theory and technical articles that he wrote for Barron’s during the late-’50s through the ’90s. Through Barron’s and via word of mouth, he gained a wide following. Russell was the first (in 1960) to recommend gold stocks. He called the top of the 1949-’66 bull market. And almost to the day he called the bottom of the great 1972-’74 bear market, and the beginning of the great bull market which started in December 1974. The Letters, published every three weeks, cover the US stock market, foreign markets, bonds, precious metals, commodities, economics –plus Russell’s widely-followed comments and observations and stock market philosophy. In 1989 Russell took over Julian Snyder’s well-known advisory service, “International Moneyline”, a service which Mr. Synder ran from Switzerland. Then, in 1998 Russell took over the Zweig Forecast from famed market analyst, Martin Zweig. Russell has written articles and been quoted in such publications as Bloomberg magazine, Barron’s, Time, Newsweek, Money Magazine, the Wall Street Journal, the New York Times, Reuters, and others. Subscribers to Dow Theory Letters number over 12,000, hailing from all 50 states and dozens of overseas counties. A native New Yorker (born in 1924) Russell has lived through depressions and booms, through good times and bad, through war and peace. He was educated at Rutgers and received his BA at NYU. Russell flew as a combat bombardier on B-25 Mitchell Bombers with the 12th Air Force during World War II. One of the favorite features of the Letter is Russell’s daily Primary Trend Index (PTI), which is a proprietary index which has been included in the Letters since 1971. The PTI has been an amazingly accurate and useful guide to the trend of the market, and it often actually differs with Russell’s opinions. But Russell always defers to his PTI. Says Russell, “The PTI is a lot smarter than I am. It’s a great ego-deflator, as far as I’m concerned, and I’ve learned never to fight it.” Letters are published and mailed every three weeks. We offer a TRIAL (two consecutive up-to-date issues) for $1.00 (same price that was originally charged in 1958). Trials, please one time only. Mail your $1.00 check to: Dow Theory Letters, PO Box 1759, La Jolla, CA 92038 (annual cost of a subscription is $300, tax deductible if ordered through your business). IMPORTANT: As an added plus for subscribers, the latest Primary Trend Index (PTI) figure for the day will be posted on our web site — posting will take place a few hours after the close of the market. Also included will be Russell’s comments and observations on the day’s action along with critical market data. Each subscriber will be issued a private user name and password for entrance to the members area of the website. Investors Intelligence is the organization that monitors almost ALL market letters and then releases their widely-followed “percentage of bullish or bearish advisory services.” This is what Investors Intelligence says about Richard Russell’s Dow Theory Letters: “Richard Russell is by far the most interesting writer of all the services we get.” Feb. 19, 1999. Below are two of the most widely read articles published by Dow Theory Letters over the past 40 years. Request for these pieces have been received from dozens of organizations. Click on the titles to read the articles. |


-
I know Mike is a very solid investor and respect his opinions very much. So if he says pay attention to this or that - I will.
~ Dale G.
-
I've started managing my own investments so view Michael's site as a one-stop shop from which to get information and perspectives.
~ Dave E.
-
Michael offers easy reading, honest, common sense information that anyone can use in a practical manner.
~ der_al.
-
A sane voice in a scrambled investment world.
~ Ed R.
Inside Edge Pro Contributors

Greg Weldon

Josef Schachter

Tyler Bollhorn

Ryan Irvine

Paul Beattie

Martin Straith

Patrick Ceresna

Mark Leibovit

James Thorne

Victor Adair