
Stocks & Equities
Europe’s dominating the news. But the question is: Will it solve its problems? Based on what the markets are telling me, I don’t think so.
Be sure to check out my latest market update by clicking here now.
Best wishes,
Larry
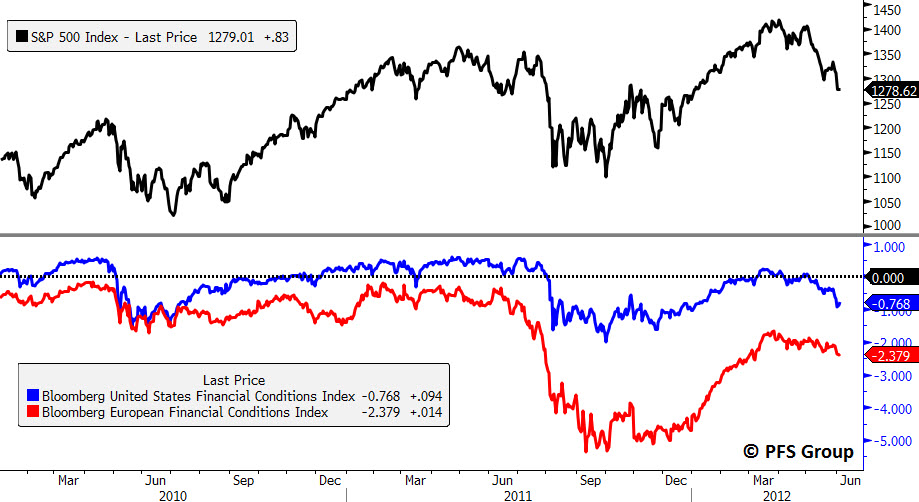
P.S. Right now, the U.S. is looking relatively good compared to Europe. However, the markets are still in a disinflationary mode, which I’ve been forecasting for you.
Gold: Here’s a new weekly chart of gold. As you can see, gold has broken its major uptrend from the low in 2008 and it’s so far been unable to penetrate back above this uptrend line. We could see a brief rally up to about the $1,700 level, but even that would not turn around gold’s immediate downtrend. It’s far more likely that we’ll continue to see lower lows in gold until there is a coordinated central bank intervention in the sovereign debt crisis. And I don’t see that occurring immediately. Therefore, the bias remains to the downside in gold.
….read more &view all charts at http://www.uncommonwisdomdaily.com/will-europe-solve-its-problems-14408?FIELD9=2
Silver: Here’s my latest updated weekly chart of silver. Here you can see that silver is making lower highs and lower lows. Basically it’s tested the $26 level no less than five times counting the last couple of weeks. That’s usually a sign that it’s breaking down that support floor here and the next test will likely penetrate right through that floorboard and see silver drop substantially lower to at least $23 where I have some system support and probably even lower to $20, perhaps even just below $20, depending on how long it takes for silver’s next leg down to unfold?

The Bottom Line
Look for lots of volatility during a base building period for equity markets lasting until mid-July when difficult second quarter earnings reports are released. Thereafter, intermediate prospects are expected to improve.
Equity Trends
The S&P 500 Index gained 47.52 points (3.73%) last week on lower than recent volume. Intermediate trend is down. Support is forming at 1,266.74 and resistance is forming at 1,334.93. The Index recovered above its 20 and 200 day moving averages, but remains below its 50 day moving average. Short term momentum indicators are trending higher. Stochastics already are overbought, but have yet to show signs of peaking.

Percent of S&P 500 stocks trading above their 50 day moving average increased last week from 12.80% to 30.20%. Percent is trying to recover from a deeply oversold level.

Percent of S&P 500 stocks trading above their 200 day moving average increased last week from 45.60% to 56.80%. Percent has returned to a slightly overbought level.

The ratio of S&P 500 stocks in an uptrend to a downtrend (i.e. the Up/Down ratio) improved last week from 0.40 to (123/292=) 0.42. Thirty S&P 500 stocks broke resistance (notably utility stocks) and 19 stocks broke support.
Bullish Percent Index for S&P 500 stocks increased last week from 47.60% to 48.20% and remained below its 15 day moving average. The Index remains in an intermediate trend down despite strength in the S&P 500 Index last week.

The Up/Down ratio for TSX Composite stocks slipped last week from 0.43 to (66/156=) 0.42. Eleven stocks broke resistance and 12 stocks broke support.
Bullish Percent Index for TSX Composite stocks slipped last week from 46.03% to 45.82%, but managed to move above its 15 day moving average. The Index remains in an intermediate downtrend.

The TSX Composite Index gained 139.43 points (1.23%) last week on lower than recent volume. Intermediate trend is down. Support is forming at 11,209.55 and resistance is forming at 11,727.58. The Index moved above its 20 day moving average, but remains below its 50 and 200 day moving averages. Short term momentum indicators are trending higher. Stochastics already are approaching overbought levels. Strength relative to the S&P 500 Index recently changed from negative.

Percent of TSX stocks trading above their 50 day moving average increased last week from 24.21% to 29.48%. Percent is intermediate oversold and showing early signs of recovery.

Percent of TSX stocks trading above their 200 day moving average increased last week from 28.97% to 33.47%. Percent is intermediate oversold and showing early signs of recovery.

The Dow Jones Industrial Average gained 435.63 points (3.59%) last week. Intermediate trend is down. Support is forming at 12,035.09 and resistance is forming at 12,555.26. The Average recovered to above its 20 and 200 day moving averages, but remains below its 50 day moving average. Short term momentum indicators are trending higher. Stochastics already are overbought, but has yet to show signs of peaking. Strength relative to the S&P 500 Index remains positive.

Bullish Percent Index for Dow Jones Industrial Average stocks increased last week from 63.33% to 66.67% and moved above its 15 day moving average. The Index remains intermediate overbought.

Bullish Percent Index for NASDAQ Composite stocks increased last week from 46.42% to 46.77% and remained below its 15 day moving average. The Index continues to trend down.

The NASDAQ Composite Index gained 110.82 points (4.04%) last week on lower than recent volume. Intermediate trend is down. Support is forming at 2,726.68 and resistance is forming at 2,873.59. The Index recovered above its 20 and 200 day moving average, but remained below its 50 day moving average. Short term momentum indicators are trending up. Stochastics already are approaching overbought levels, but have yet to show signs of peaking. Strength relative to the S&P 500 Index remains negative.

The Russell 2000 Index gained 31.77 points (4.31%) last week. Support is forming at 729.75 and resistance is at 775.65. The Index moved above its 20 and 200 day moving averages, but remained below its 50 day moving average. Short term momentum indicators are trending higher. Strength relative to the S&P 500 Index is neutral/negative.

The Dow Jones Transportation Average gained 150.81 points (3.06%) last week on lower than recent volume. Intermediate trend is down. Support is forming at 4,795.28 and resistance is forming at 5,159.84. The Average recovered to above its 20 and 200 day moving averages, but remains below its 50 day moving average. Short term momentum indicators are trending up. Strength relative to the S&P 500 Index remains positive.

The Australia All Ordinaries Composite Index slipped 4.75 points (0.11%) last week. Intermediate trend is down. The Index remains below its 20, 50 and 200 day moving averages. Short term momentum indicators are trending up. Strength relative to the S&P 500 Index remains neutral.

The Nikkei Average added 19.01 points (0.23%) last week. Intermediate trend is down. Short term momentum indicators are trending higher. The Average remains below its 20, 50 and 200 day moving averages. Strength relative to the S&P 500 Index remains negative.

The Shanghai Composite Index fell 91.99 points (3.88%) last week despite news that the Bank of China reduced its lending rate by 0.25% to 3.25%. Intermediate trend is down. Support is at 2,242.34 and resistance is at 2,478.38. The Index remains below its 20, 50 and 200 day moving averages. Short term momentum indicators are oversold, but have yet to show signs of bottoming. Strength relative to the S&P 500 Index has been positive, but is showing signs of change.

The London FT Index gained 114.22 points (2.15%), the Frankfurt DAX Index fell 133.56 points (2.13%) and the Paris CAC Index added 34.68 points (1.15%) last week.


The Athens Index fell another 9.21 points (1.84%) last week. Intermediate trend is down. The Index remains below its 20, 50 and 200 day moving averages. Short term momentum indicators are oversold, but have yet to show signs of bottoming. Strength relative to the S&P 500 Index remains negative.

…. More on Currencies,Gold, Commodities http://www.timingthemarket.ca/techtalk/2012/06/11/tech-talk-for-monday-june-11th-2012/
![]()
Here is a video link to an interview that I did at the World Resource Investment Conference last week, click here to watch on YouTube.
Trading is simple, but not easy. Despite its simplicity, most people who try to trade have a hard time finding consistent profitability. Trading well is as much about doing certain things right as it is about avoiding the common mistakes. Here is a list of the common causes of trader failure.
1. Lack of Knowledge
Trading does not have to be complex or involve a sophisticated understanding of capital markets. In one day, I can teach a person the skills that I use as a trader. However, like riding a bicycle, being good at applying those skills takes practice and usually involves some painful mistakes through the learning process. You probably were pretty wobbly the first time you pedaled a bicycle but, with time, you found your balance and got good at it. Trading is no different.
However, unlike riding a bike, there are thousands of ways to trade. You have a choice in what you trade, the hold period for your trades and the strategies you apply.
There are many options for people looking to learn trading. You can take classes, study online, read books or try to figure it out on your own. Each approach to learning has a cost; don’t underestimate the price for how you intend to learn.
With so many approaches to acquiring the knowledge you need to trade, there is not necessarily just right and wrong ways to learn. It becomes a question of what is right for you, what best fits your learning style. What is most important is that you get educated before you risk a penny of your money in the market. Most people can’t beat the market because they don’t know what they are doing. Don’t let a lack of knowledge ensure your failure.
2. Poor Risk Management
The focuses for most aspiring traders are the decisions to enter and exit the trade. They spend a lot of time trying to find the right stock to buy and then try to make a good decision on when to enter. They miss out on the most important component of the trading process.
Risk management is that often forgotten piece of the trading puzzle. Without capital to trade with, you have nothing to do. Protect your capital first and never try to get rich overnight. Some might get lucky in the short term but those who fail to manage risk over the longer term will go broke. That is guaranteed.
For every trade, you need to know your downside. Being wrong is part of trading so you must have a plan for what to do when you are wrong.
3. Insufficient Capital
Since being wrong is part of a profitable trading strategy, you need to allow for drawdowns of your capital base. There will be times when market conditions will not be great for the strategies you are applying.
When planning your trading business, you must allow for this potential deterioration of capital. You may make five steps backward before you start to go forward, make sure you have the capital to ride out these losing periods.
4. Trading Without Proven Strategies
I have seen a lot of people trade without a strategy that they have tested. They think that they can beat the market by doing things that make sense. This is often the biggest problem with people who are successful in other areas of life.
It is a bad idea to think that you can beat the market by being smart. The markets rarely do what makes sense, at least in the context of the information that we have. This is because the market often moves on information that most of us just don’t have.
For that reason, it is smart to have a set of trading rules that you first test exhaustively before you trade. Your testing must determine whether the rules yield a positive expected value. Over a large number of trades, your rules should make a profit. What happens on any individual trade really does not matter.
5. Failure to Follow Rules
The rules you define and test are only effective if you follow them. While this is easy for all of us to understand, it is a very hard thing to actually do. We break rules because we are afraid of losing money. Emotion is a hard thing to overcome.
To minimize the impact of emotion requires a comfort with the risk you are taking. Most traders find that paper trading, simulated trading without using real money, is not too hard. It is only when they have their capital at risk that they start to make mistakes.
The solution to this problem is to not take more risk than you are comfortable with. The best traders are those who don’t care about the money. The more you can do to take out emotion, the better your chances will be to follow the trading rules.
6. Lack of Determination
Doing anything well requires the determination to learn and gain expertise. This is very much the case for trading because it is such an emotional pursuit. There will be times when the novice trader will feel overwhelmed with emotion and ready to give up.
I don’t think trading is something that can be done well by someone who does not like it. Having a passion for trading is what will get you through the hard times and ensure that you stick with it when your heart may tell you otherwise.
7. Poor Focus
The shorter the time frame you trade, the more focused you need to be. Position trading (hold period measured in weeks or months) is not that demanding mentally because you have a lot of time to make your trading decisions. Swing trading (hold period measured in days) requires you make quicker decisions but is not as demanding as day trading. The day trader (hold periods measured in hours or minutes) has to make decisions in only seconds and work hard to not miss out on good trading opportunities.
It is hard to trade if you have a lot of distractions while you are trading. You have to do what is necessary to avoid letting outside factors have an effect on your trading decisions.
8. Inability to Adapt
The market is constantly changing and you need to be able to adapt with it. That means applying trading strategies that are appropriate for the present conditions; you may not want to apply a buying strategy in a market with strong downward momentum.
Avoiding chasing the market with your rules is a challenge that many traders have trouble with. You should have a set of trading principles that do not change over time, these based on source of opportunity that you are pursuing. Do not constantly change the rules of your tested and proven strategies.
However, how and when you apply your strategies will change as the market evolves. I keep a stable of trading strategies that I apply as conditions warrant.
![]()
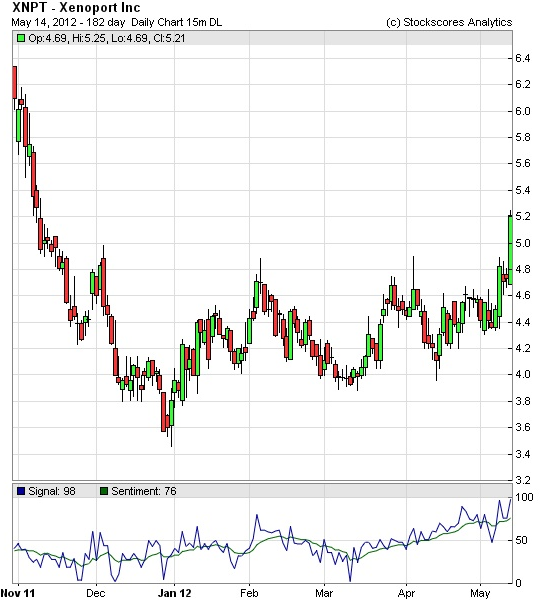
Markets took a step in the right direction this week with the bounce back that I was expecting. The indexes have not overcome the pessimism yet but could do so soon, watch for a break of the downward trend line on the major stock market indexes. In the mean time, there are a few stocks able to do well despite the market weakness. This week, I ran the Stockscores Simple strategy Market Scan and found a few stocks with decent charts. Here they are with my comments:
![]()
1. DRAD
DRAD made an abnormal up break with abnormal volume on Friday, taking it through resistance from a rising bottom. Good potential provided it does not pull back to close below support at $2.16.

2. UNIS
A good ascending triangle break on UNIS Friday with abnormal volume supporting the break. The reward for risk will improve with a pull back. The stock is breaking its long term downward trend, a good sign for a turnaround. Support at $3.95.

3. TCAP
A nice weekly chart breakout from a cup and handle pattern on TCAP as the stock moves to five year highs after sitting under $20 resistance for over a year. Support at $19.75.
References
- Get the Stockscore on any of over 20,000 North American stocks.
- Background on the theories used by Stockscores.
- Strategies that can help you find new opportunities.
- Scan the market using extensive filter criteria.
- Build a portfolio of stocks and view a slide show of their charts.
- See which sectors are leading the market, and their components.
Disclaimer
This is not an investment advisory, and should not be used to make investment decisions. Information in Stockscores Perspectives is often opinionated and should be considered for information purposes only. No stock exchange anywhere has approved or disapproved of the information contained herein. There is no express or implied solicitation to buy or sell securities. The writers and editors of Perspectives may have positions in the stocks discussed above and may trade in the stocks mentioned. Don’t consider buying or selling any stock without conducting your own due diligence.

The first investor is Anne Scheiber, who turned a $5,000 investment in 1944 into $22 million by the time of her death at the age of 101 in 1995. The second investor is Grace Groner, who turned a small $180 investment in 1935 into $7 million by the time of her death in 2010. The third dividend investor is Warren Buffett, the Oracle of Omaha himself.
Dividend investing is as sexy as watching paint dry on the wall. Defining an entry criteria that selects quality dividend stocks with rising dividends over time and then patiently reinvesting these dividends while sitting on your hands is not exciting. While active traders have a plethora of hedge fund managers on the covers of Forbes magazine there are not many well-publicized successful dividend investors. Even value investing has its own superstars – Ben Graham and Warren Buffett.
….read how these investors did it HERE
Mark Leibovit: My reaction to Bernanke’s testimony in Congress yesterday is simply that the sooner this corrupt house of cards collapses, the better off we’ll all be!
Bernanke only knows one thing: How to print more money! If you think that is going to change whether you call it QE3 or secret actions masked under the protected cloak of the Federal Reserve, guess again.
A sixty point rally in the S&P 500, a 500 point rally in the Dow Industrials and a 420 point rally in the TSX is apparently ‘all she wrote’ for this upleg. Whether we’ve seen THE low for my predicted May to July cyclical trough, only time will tell. (Ed Note: Mark recently went Bullish on Stocks based on Cyclical and seasonal patterns)
VRTRADER.COM Trial Signup:
Here is the Special Trial Offer: Use this month to kick our tires. Pay 50% for the first 30 days (No refund) and sample our Silver or Platinum service and then decide what works best for you. If you aren’t 100% ready to move forward, simply email us to cancel one week before your 30 day 50% off trial subscription ends and it will be canceled and you will not be charged ANY FURTHER, no questions asked. Just send an email to mark.vrtrader@gmail.com” data-mce-href=”mailto:mark.vrtrader@gmail.com” data-mce-href=”mailto:mark.vrtrader@gmail.com“>mark.vrtrader@gmail.com“>mark.vrtrader@gmail.com” data-mce-href=”mailto:mark.vrtrader@gmail.com“>mark.vrtrader@gmail.com or call 928-282-1275 to cancel. You will receive an emailed confirmation of your cancellation at that time.
The 30 day trial is allowed one time only. By taking this 30 day 50% trial, you agree to be charged the full cost of the monthly Silver or Platinum service (choose one only) at the end of the 30 day trial subscription period, unless you cancel first. The regular Silver monthly rate is $49.40 and the Silver quarterly rate is $133.50. The regular Platinum monthly rate is $129.95 and the Platinum quarterly rate is $350.85. The special trial 50% off trial rates are listed below. Sign up today!
There are no refunds or pro-rata refunds offered at VRTrader.com for any subscription. You are being offered a 50% discount for trying our service for the first 30 days only!

Investors are now faced with a dilemma. Where do they place money in an era of financial repression? Do they chase Treasury yields which are now in bubble territory? Or are there safe havens still available in the stock market? I thought I would never see the day where the yield on the Dow Industrials would exceed the yield on a thirty year Treasury bond. The current stock market correction has brought the PE multiple down to 12 on the Dow Industrials and raised the dividend yield up to 2.8%. Treasuries may be seen as a safe haven but they are also fraught with risk. What happens to the price on bond funds when yields eventually rise?
The worries that plagued the market over the last two years still remain: Europe’s debt difficulties, a hard landing in China, turmoil in the Middle East, and the U.S. fiscal cliff. All of those problems still hang over the market, Europe is in a recession, China’s economy is slowing down, and many of the BRIC countries are seeing economic growth soften as we are now seeing in the U.S. To make matters worse…
….read more HERE

-
I know Mike is a very solid investor and respect his opinions very much. So if he says pay attention to this or that - I will.
~ Dale G.
-
I've started managing my own investments so view Michael's site as a one-stop shop from which to get information and perspectives.
~ Dave E.
-
Michael offers easy reading, honest, common sense information that anyone can use in a practical manner.
~ der_al.
-
A sane voice in a scrambled investment world.
~ Ed R.
Inside Edge Pro Contributors

Greg Weldon

Josef Schachter

Tyler Bollhorn

Ryan Irvine

Paul Beattie

Martin Straith

Patrick Ceresna

Mark Leibovit

James Thorne

Victor Adair