
Stocks & Equities
Now that the major stock market indexes are near or at the official “correction” level, that is about 10% below a recent market high – it may be time to get serious about some portfolio hedging. May was a brutal month for the market as the Dow 30 gave up all of its year to date 6%-plus gains. June (so far) doesn’t look too healthy either. Also, the 200 day moving average is in danger of being breached. If the S&P 500 closes below that 200 DMA level for several days, that could trigger even more selling. That 200 DMA is a “line in the sand” to many institutional money managers. Typically the market will try and rally back when that level is reached. The market does not just go straight down or straight up. Expect counter trend rallies. If things deteriorate further here are four Exchange Traded products that could help ease the pain.
….read about the 4 Products HERE


An intensifying financial crisis in Spain or elsewhere in Europe has the potential to drive American stocks into a bear market, Goldman Sachs Group Inc. (GS)’s chief U.S. equity strategist said.
Kostin said investors face three upcoming macro events that may add uncertainty: the second round of Greek elections on June 17, the Federal Open Market Committee’s June meeting and the U.S. Supreme Court’s ruling on health-care reform.
….read more HERE
Bob Hoye in this Money Talks article, was again very clear that we are now at another critical point in the markets and that its now time to either save your capital and get out of the way, or make some money (by shorting -ED)


Short term risk in North American equity markets remains following the technical meltdown on Friday. However, equity markets already are deeply oversold. Downside risk is not substantial. Unfortunately, upside potential also is not significant. Look for lots of volatility during a base building period lasting until mid-July when “difficult” second quarter earnings reports are released. Thereafter, intermediate prospects are expected to improve. Be patient!
Other Issues
The VIX Index popped 4.90 (22.52%) last week. The Index recovered from the top of a reverse head and shoulders pattern. On Friday, it broke above its 200 day moving average. Short term momentum indicators are overbought, but have yet to show signs of peaking.
Economic news this week is expected to be mixed and is not expected to have a significant impact on equity markets.
Earnings news this week is not significant.
Macro events will continue to impact equity markets. Once again, the focus is on Europe. Comments by Federal Reserve Chairman Ben Bernanke later this week also will be watched closely. Is Quantitative Easing III on the radar screen? Traditionally, the Fed has not made significant policy changes during four months prior to a Presidential election date. That means Fed action, if occurring, is likely to be announced before the end of July.
Headline risk is exceptionally high. The media extensively warned about a slowing U.S. economy over the weekend. The politicians on both sides of the political spectrum also were notable for their comments in the media over the weekend.
Intermediate technical indicators, most notably the break by U.S. equity indices below their 200 day moving averages, suggest that the intermediate uptrend remains downward.
Short term technical indicators for most equity markets and sectors are oversold, but have yet to show signs of bottoming.
Seasonal influences for most equity markets, sectors and commodities in the month of June are negative.
Currency trends will continue to impact equity markets. The U.S. Dollar Index is short term overbought and the Euro is short term oversold. Both recorded interesting reversals on Friday. Gold quickly responded. Will there be follow through this week?
Cash on the sidelines remains substantial. Cash hordes held by Corporate America remains high. Major commitments of cash are unlikely until the market determines the next U.S. president.
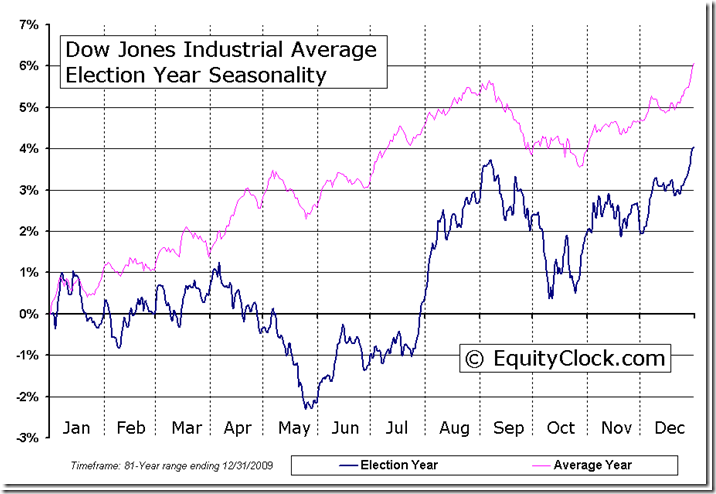
The historic pattern for U.S. equity markets during a Presidential election year were altered slightly last week when broadly based U.S. equity indices broke to new lows.
….read more of Don’s Brilliant Monday compilation of 45 Charts and commentary HERE
Bob Hoye”Just looking at the Gold Shares now, we have an index in Gold Shares going back to 1900 and there has been only one other time were it has been this oversold and that was in 1924. So one could say that this is about the most oversold you can get, and our advice on Gold Shares a few weeks ago is that people should be accumulating good quality Gold Shares into weakness. It might take another week to set the low in here, but then the performance out of this oversold should be rather good. I am content buying either good exploration stocks where you know the story, or some of the senior Golds or Gold share ETF’s”.
How to Time a Blue Chip Buy
When you’re ready to buy a stock for purely fundamental reasons, you need to pay the best possible price for your investment.
Technical analysis is a tool that can help you do just that. Today, we’ll put it to work to analyze one of the most popular names on the market…
….read the whole article HERE

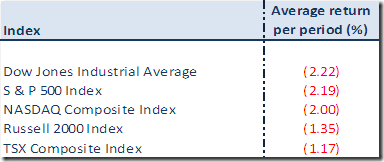
The month of June is not a great month for performance for North American equity indices. According to Thackray’s 2012 Investor’s Guide, the month of June from 1950 to 2010 was the third worst month of the year producing an average return per period of -0.1% and was positive only 51% of the time. Returns for broadly based equity indices during the past ten periods were as follows:
Best performing sectors during the past 20 periods were Health Care and Telecom. Worst performing sectors were Materials, Financials and Consumer Discretionary. Best performing sub-sectors during the past 20 years were Software & Services and Pharmaceuticals. Worst performing sectors were Banks, Transportation and Auto & Components.
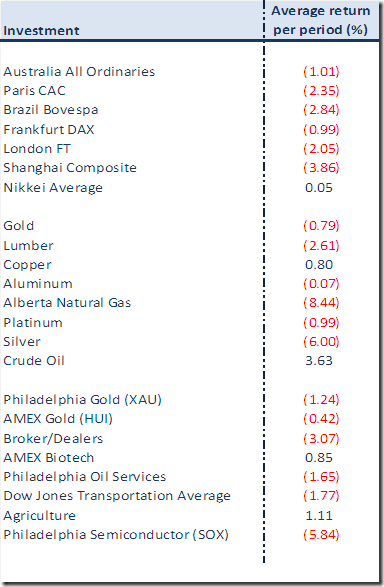
Other indices, sector and commodities recorded the following average performance during the past 10 periods:
….read more at Equityclock.com & Don Vialoux’s Interesting Charts HERE
Disclaimer: Comments and opinions offered in this report at www.timingthemarket.ca are for information only. They should not be considered as advice to purchase or to sell mentioned securities. Data offered in this report is believed to be accurate, but is not guaranteed.
Don and Jon Vialoux are research analysts for Horizons Investment Management Inc. All of the views expressed herein are the personal views of the authors and are not necessarily the views of Horizons Investment Management Inc., although any of the recommendations found herein may be reflected in positions or transactions in the various client portfolios managed by Horizons Investment Management Inc

-
I know Mike is a very solid investor and respect his opinions very much. So if he says pay attention to this or that - I will.
~ Dale G.
-
I've started managing my own investments so view Michael's site as a one-stop shop from which to get information and perspectives.
~ Dave E.
-
Michael offers easy reading, honest, common sense information that anyone can use in a practical manner.
~ der_al.
-
A sane voice in a scrambled investment world.
~ Ed R.
Inside Edge Pro Contributors

Greg Weldon

Josef Schachter

Tyler Bollhorn

Ryan Irvine

Paul Beattie

Martin Straith

Patrick Ceresna

Mark Leibovit

James Thorne

Victor Adair