
Stocks & Equities

Investors assuming that Netflix, Inc’s more than 100 percent gain in 2018 makes it the top performing streaming video outlet are wrong as shares of World Wrestling Entertainment, Inc. are up more than 150 percent…. CLICK for the complete article

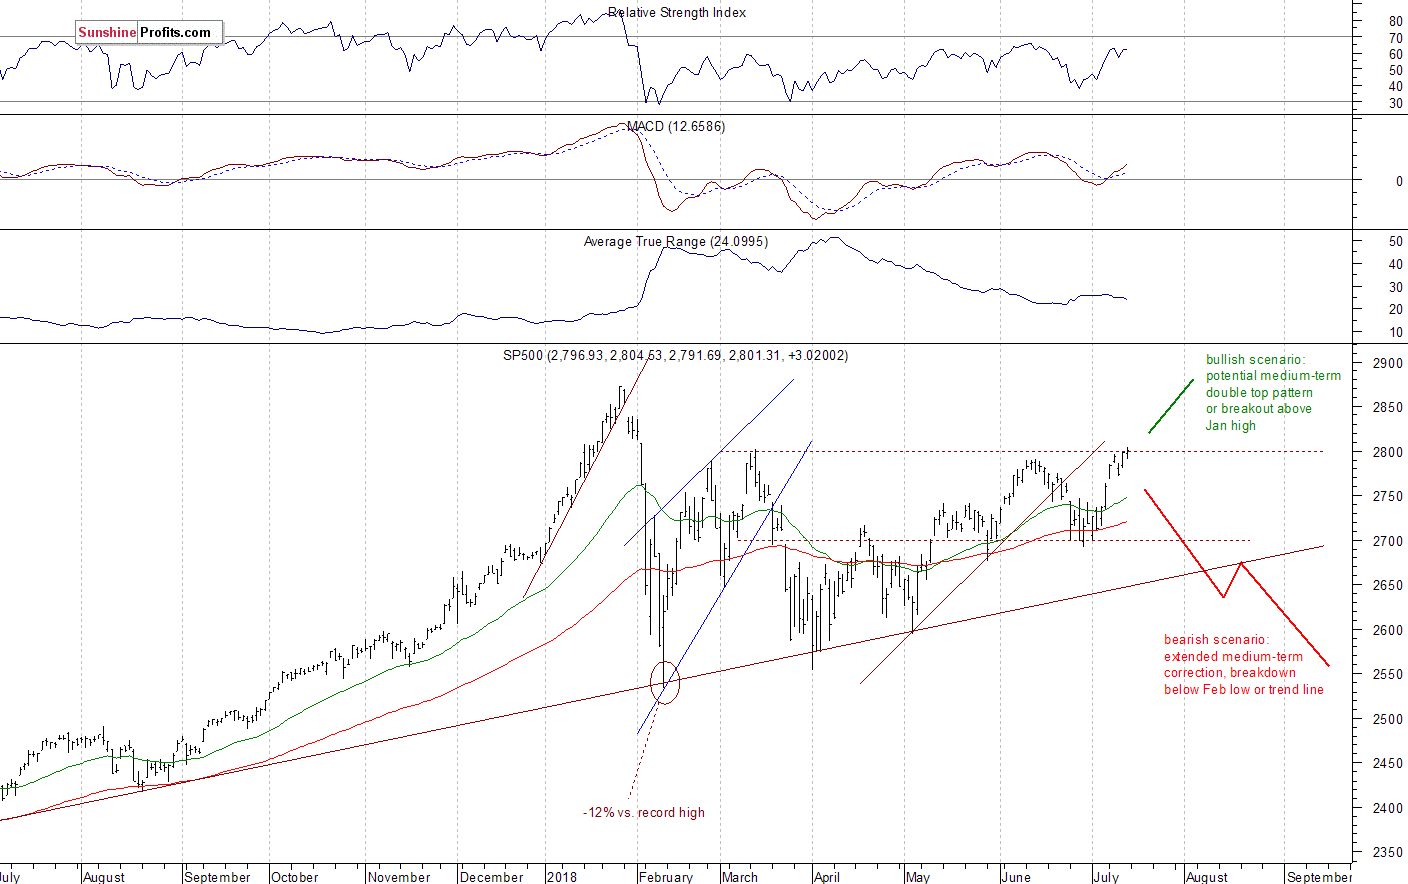
The U.S. stock market indexes were mixed between 0.0% and +0.4% on Friday, as investors took some short-term profits off the table following the recent advance. The S&P 500 index traded along the level of 2,800. It reached the highest since the early February. It currently trades 2.5% below the January’s 26th record high of 2,872.87. The Dow Jones Industrial Average gained 0.4% and the technology Nasdaq Composite was unchanged on Friday.
The nearest important level of support of the S&P 500 index remains at around 2,780-2,785, marked by the recent local lows. The next support level is at 2,765-2,770, marked by last Wednesday’s local low along with last Monday’s daily gap up of 2,764.41-2,768.51. On the other hand, the resistance level remains at around 2,800, marked by the previous local highs from February, March and June. The level of resistance is also at 2,840, marked by January the 30th daily gap down.
The broad stock market broke above its recent trading range a week ago. Is this a new uptrend or just more medium-term fluctuations following January-February sell-off? If the S&P 500 index breaks above 2,800 mark, we could see more buying pressure. Perhaps we could see a move to new record high. However, there are still two possible medium-term scenarios – bearish that will lead us below the February low following trend line breakdown, and the bullish one in a form of medium-term double top pattern or a breakout towards 3,000 mark. The S&P 500 index is closer to breaking higher now:
Still Bullish?
Expectations before the opening of today’s trading session are virtually flat, because the index futures contracts trade 0.1% higher vs. their Friday’s closing prices. The main European stock market indexes have been mixed so far. Investors will now wait for some economic data announcements today: Retail Sales, Empire State Manufacturing at 8:30 a.m., Business Inventories at 10:00 a.m. Investors will also wait for the quarterly corporate earnings releases. The broad stock market will likely extend its short-term uptrend this morning. However, we may see a profit-taking action at some point.
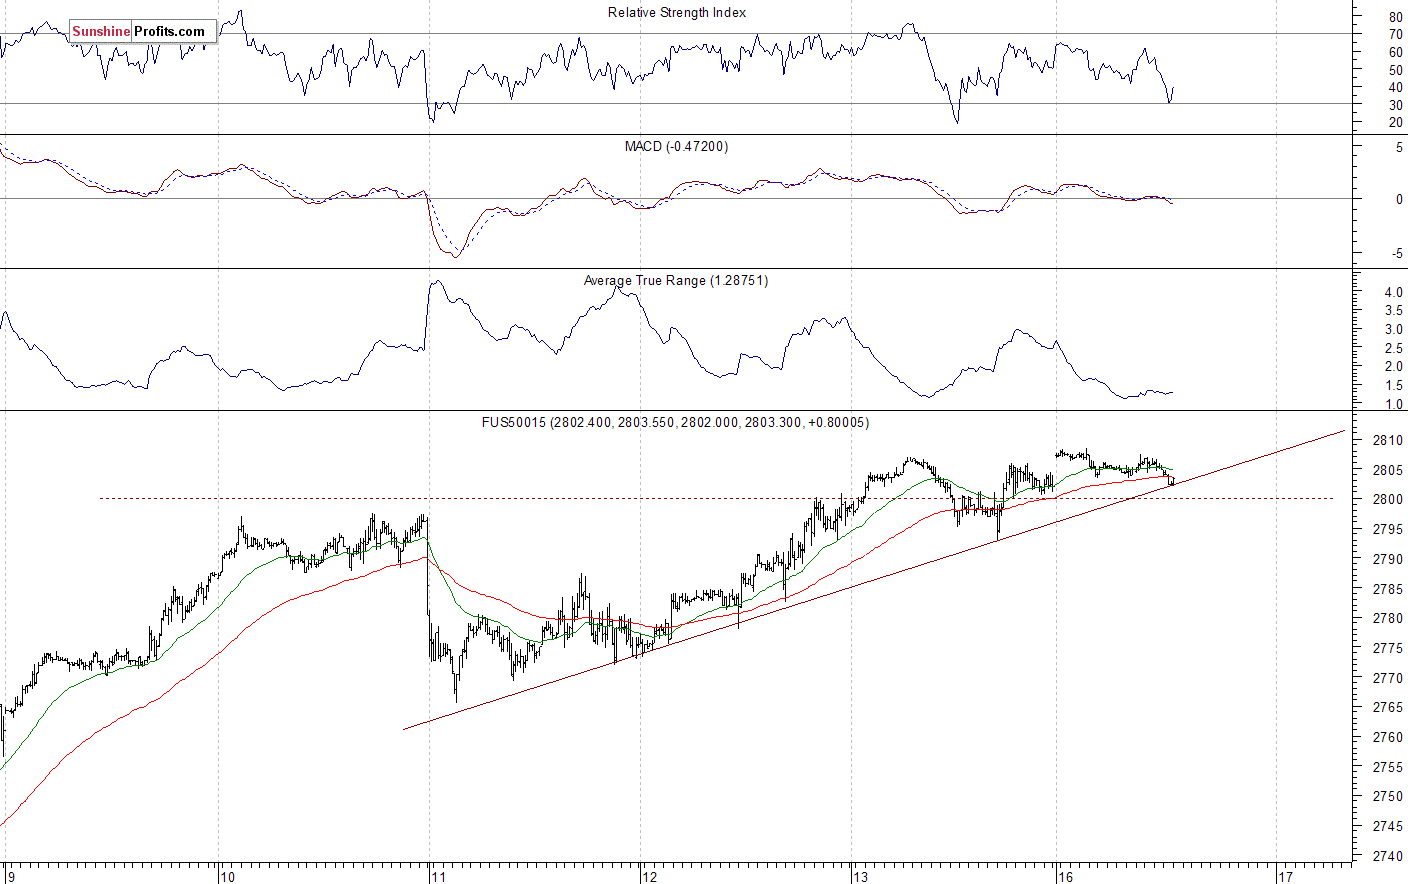
The S&P 500 futures contract trades within an intraday consolidation following an overnight advance. The nearest important level of resistance is at around 2,805-2,810, marked by the local highs. On the other hand, the level of support is now at 2,790-2,795, among others. The futures contract remains close to its short-term upward trend line, as the 15-minute chart shows:
Nasdaq Trades Along New Record High
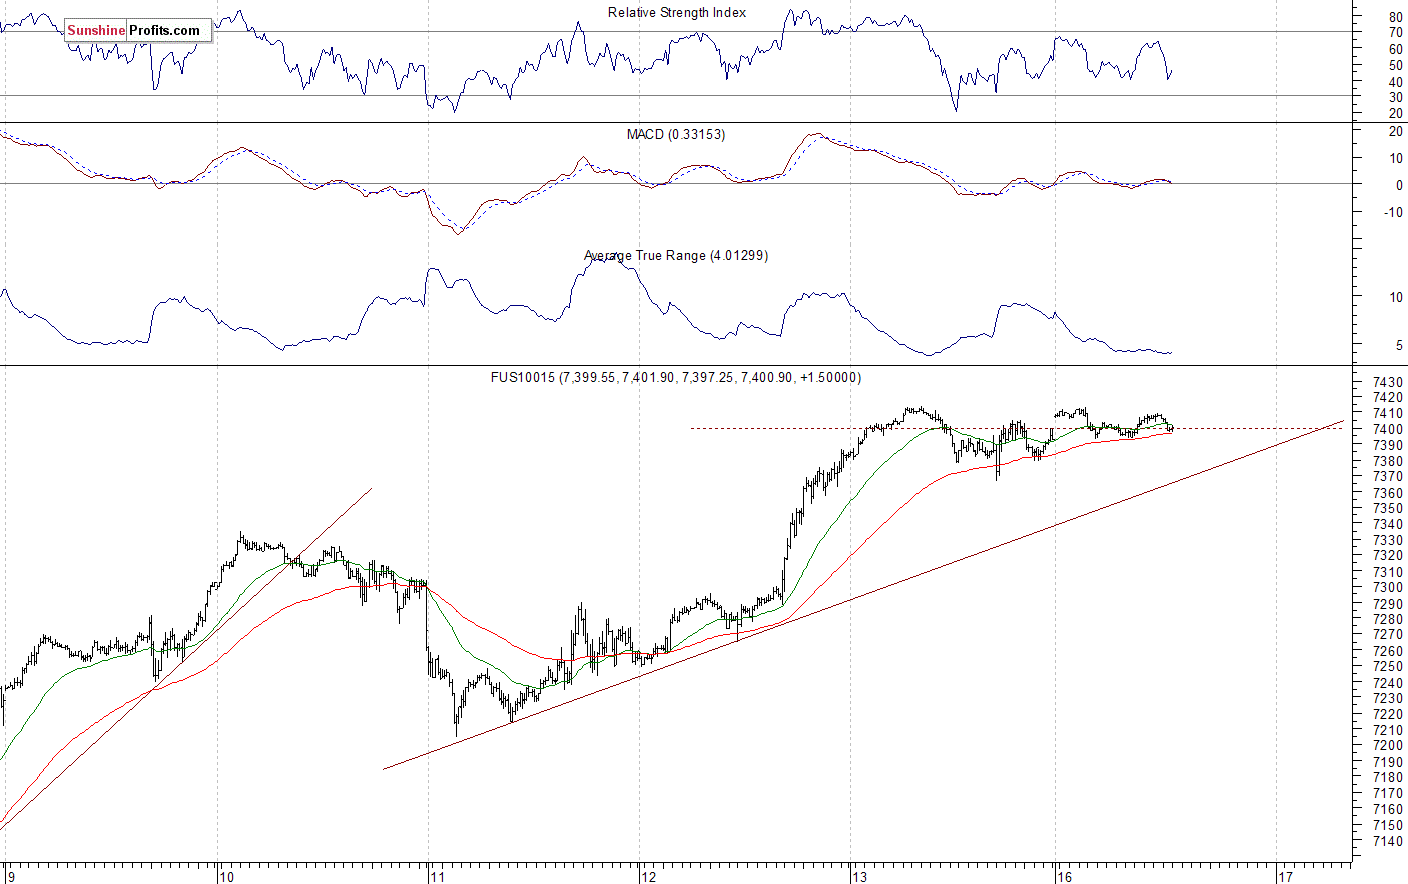
The technology Nasdaq 100 futures contract follows a similar path, as it trades along its short-term local highs. The market reached the new record high on Friday, as it broke above the level of 7,400. Will it continue upwards? There have been no confirmed negative signals so far. The nearest important level of support is at around 6,370, and the resistance level is at 7,410-7,420. The Nasdaq futures contract trades along the level of 7,400, as we can see on the 15-minute chart:
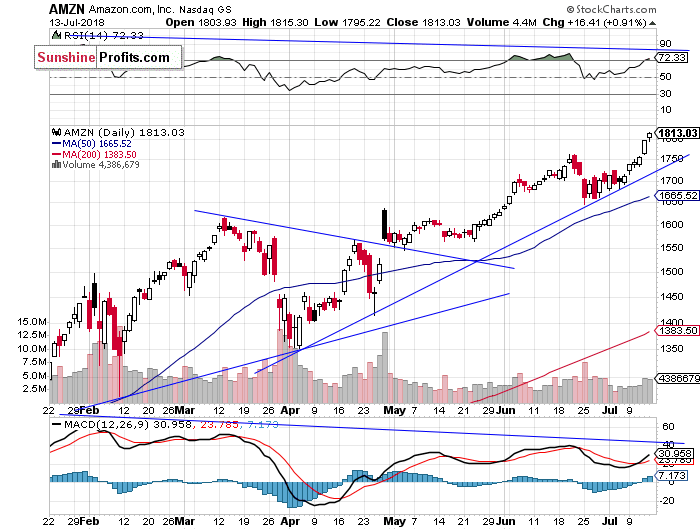
Apple Still Weaker, Amazon at Another New Record High
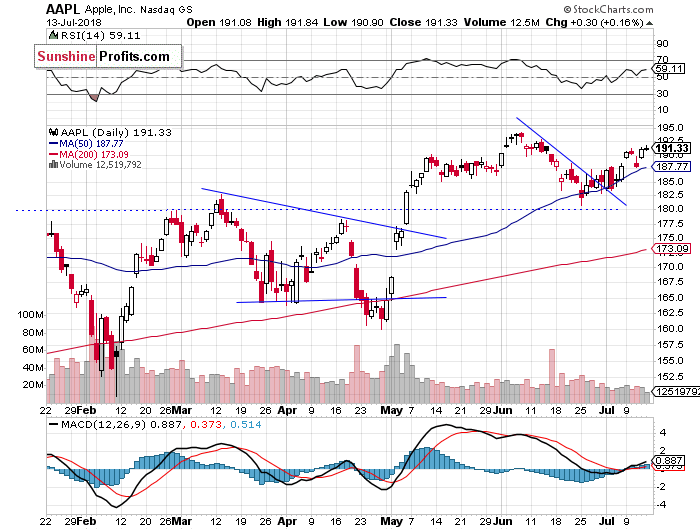
Let’s take a look at Apple, Inc. stock (AAPL) daily chart (chart courtesy of http://stockcharts.com). The stock slightly extended its advance last week, but it still trades at the resistance level of around $190-195. On the other hand, support level remains at around $185, marked by the previous level of resistance:
Now let’s take a look at Amazon.com, Inc. stock (AMZN) daily chart. It reached the new record high on Friday at the level of $1,815.30. The nearest important level of support is now at around $1,800, marked by the previous resistance level. We still can see negative medium-term technical divergences. But there have been no confirmed negative signals so far:
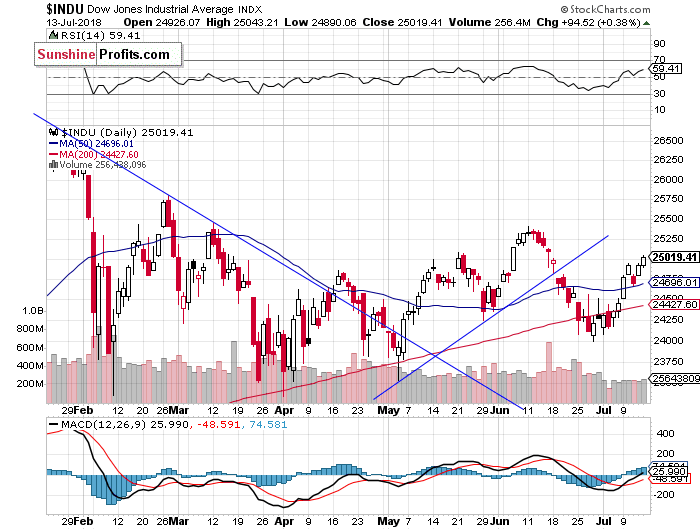
Dow Jones Slightly Above 25,000 Mark
The Dow Jones Industrial Average closed slightly above the level of 25,000 on Friday. The market extended its short-term uptrend, but will it continue higher despite some short-term overbought conditions? There have been no confirmed negative signals so far. The 200-day moving average acted as a support level recently, as we can see on the daily chart:
The S&P 500 index broke slightly above the level of 2,800 on Friday, as it got the highest since the early February. But will the broad stock market continue towards its late January record high? It is just 2.5% below that level. Investors will now wait for the quarterly corporate earnings releases.
Concluding, the broad stock market will likely open virtually flat today. We may see more short-term uncertainty, as the S&P 500 index trades along its recent months’ highs.
If you enjoyed the above analysis and would like to receive free follow-ups, we encourage you to sign up for our daily newsletter – it’s free and if you don’t like it, you can unsubscribe with just 2 clicks. If you sign up today, you’ll also get 7 days of free access to our premium daily Gold & Silver Trading Alerts. Sign me up!
Thank you.
Paul Rejczak
Stock Trading Strategist

CNBC had a piece this week that looked at how top heavy returns in the stock market have been this year. They showed 3 stocks — Amazon, Netflix and Microsoft — alone make up more than 70% of the gains in the S&P 500 and Nasdaq 100 indexes:

When you include Apple, Google (I refuse to call this company Alphabet), and Facebook those numbers jump to an absurdly high 98% and 105%, respectively.
The obvious takeaway here would seem to be that 2018 market returns (around 5% for the S&P and 14% for the Nasdaq 100) are all being driven by a handful of names. And if that handful of stocks ever come back down to earth, which they’ve been wont to do on occasion, watch out below.
The simplest explanation for these staggering numbers is the fact that this is how market capitalization weighted indexes work. By definition, the largest stocks will have a bigger impact on the returns than the smaller stocks.
For instance, Amazon has added nearly $285 billion in market cap this year alone. This number is insane when you consider Amazon’s entire market cap was $285 billion in April of 2016. That $285 billion gain this year is the same size as the total combined market cap of the 40 smallest stocks in the S&P 500.
Many of the names in that list of the 40 smallest stocks by market cap have had good returns this year:
- TripAdvisor +70%
- Robert Half International +21%
- Envision Healthcare +29%
- AES Corp +23%
- Nordstrom +14%
But those stocks aren’t going to move the needle as much as Amazon or Microsoft or Apple because they don’t carry the same weights as the large tech stocks.
It would also be more concerning that the gains were so concentrated at the top if the S&P 500 was the only thing going up this year. Spoiler alert — it’s not.
Small cap stocks are up around 10% in 2018. Mid caps have risen almost 6%. Micro caps, the smallest stocks in the market, making up a measly 2% of the total, are up more than 13% this year.
Another way of looking at this is the advance-decline line, which is a way to track market breadth by comparing the number of stocks rising with the number of stocks falling. Here’s the latest reading set against the S&P 500:

If there were only a few stocks rising you would see a large divergence between these lines. Instead, we see the advance-decline fairly inline with the stock market. This tells us that there are far more stocks rising than just a few of the biggest names.
It may feel odd to see performance being driven by so few stocks but this is how the stock market generally works over time. The majority of returns come from a handful of names. It’s like this over both short and long time frames.
Data from Hendrik Bessembinder showed that from 1926 to 2015:
- Less than half of all monthly stock returns in the U.S. are larger than the one-month Treasury bill rates (meaning most stocks don’t outperform cash).
- Just 42.1% of stocks have a lifetime return greater than T-bill returns while half deliver negative lifetime returns.
- Over half the wealth created in the stock market came from the 86 top-performing stocks, around 0.33% of the total.
This doesn’t mean other stocks didn’t do well over this period, just that the most wealth was created in the stocks that grew to be the biggest (which seems sort of obvious when you think about it).
It can also be instructive to look at how some of the other biggest names are performing this year:

Yes, tech stocks are the big winners. No, this won’t last forever. But it’s also true that financial or energy stocks at the top of the market won’t be laggards forever either. It’s quite possible that they can offset some of the relative losses when we do finally see a mean reversion in technology.
Here are a few takeaways to wrap things up on this topic:
- If you’re invested solely in a total market or S&P 500 index fund, then yes, your returns will likely be driven by a handful of stocks. This is simply the way market cap weighting works, for better or worse.
- If you’re diversified outside of the market cap weighted indexes, that means your returns are going to look different at times. Going lower on the cap-weighted spectrum has been a net positive this year. Last year large caps outperformed micro, small and mid caps. So it goes when diversifying.
- The concentration of returns in the stock market is one of the most underrated reasons for diversifying your investments. No one knows where the huge gainers will come from each year or over the long run. Diversifying gives you a chance to allow the outlier winners to overshadow the outlier losers.
- None of this data I’ve presented here means the stock market can’t fall from here. We certainly could see what many would call an overdue correction in tech stocks that brings down the rest of the market with it. Or investors could get spooked by something else which could send micro caps, small caps, mid caps and mega caps all reeling.
- But the stock market is not currently being driven by just a handful of stocks. In fact, the fact that smaller companies are outperforming this year is a tell-tale sign that this isn’t the case. Whether it lasts or not, this is a full-fledged market rally where every capitalization size is taking part in the gains.
Further Reading:
The Biggest Stocks

Last week’s rally in US stocks may just be the effect of a light volume/holiday week melt up, but the numbers were impressive and set the posts for last week’s action:
- S&P 500 +1.52% last 5 days
- Tech sector in S&P: +2.29%
- Russell 2000: +3.10%
- S&P Small Cap: +3.31%
- All of which roundly beat “Rest of world” equities, up only 0.70% (MSCI All Country Ex-US)
Although Friday’s Goldilocks-style Jobs Report played a role, this strong performance stands in notable contradiction to market concerns over global trade disputes. Given these have been brewing for months, they should now be bitter enough to make for a less appetizing US stock market. The tape respectfully disagrees…. CLICK for the complete article

We are at the mid-point of the year, and a good time for investors to take stock of their portfolios and review market performance in general. The current year has not been very kind to stocks, with the broad-market benchmark having climbed a modest 4 percent in the year-to-date compared to twice as much at a comparable point the previous year. The industrial benchmark, the Dow Jones, has fared even worse after managing a paltry 0.3 percent gain.
There are several reasons why the nine-year-old bull market is showing obvious signs of fatigue, but top among them include rising interest rates, mounting geopolitical uncertainty and monetary tightening.
Without further ado, the brass tucks.
Here are top 5 worst performers in the S&P 500 in diverse sectors…. CLICK for the complete article

-
I know Mike is a very solid investor and respect his opinions very much. So if he says pay attention to this or that - I will.
~ Dale G.
-
I've started managing my own investments so view Michael's site as a one-stop shop from which to get information and perspectives.
~ Dave E.
-
Michael offers easy reading, honest, common sense information that anyone can use in a practical manner.
~ der_al.
-
A sane voice in a scrambled investment world.
~ Ed R.
Inside Edge Pro Contributors

Greg Weldon

Josef Schachter

Tyler Bollhorn

Ryan Irvine

Paul Beattie

Martin Straith

Patrick Ceresna

Mark Leibovit

James Thorne

Victor Adair