Timing & trends

Gold: Bullish Candlesticks Are Boss

Marc Faber and Jim Rogers Agree

Screen Shot 2017-08-17 at 6.48.14 AM1. Marc Faber and Jim Rogers Agree

Despite US Federal Reserve Chair Janet Yellen saying last month that another financial crisis on the scale of the crash that enveloped the world in 2007/8 was unlikely “in our lifetimes”, several respected stock market commentators believe a new disaster could happen within months rather than years  

…read more HERE

2. Hot Properties: Chinese Money Changes Direction

Ozzie Jurock on the massive change in investment money coming from China. Also Ozzie on the most interesting real estate story you will ever hear! The latest on the big story – what is happening with shopping malls in North America.

….continue HERE

3. Is Kim Jung-un Blinking?

by Martin Armstrong

Kim Jung-un in North Korea is refusing to blink yet he maybe. He has turned domestically first in the ongoing crisis and has now announced a massive army recruitment program. An article in a Pyongyang-based propaganda newspaper today declared already more than 3.5 million people had signed up to fight. The newspaper is claiming that millions were “volunteers” including students and former soldiers.

The truth is that the North Korean army is subjected to absolute obedience to the Kim dynasty. If civilians are scrambling to volunteer, it is also likely that they are malnourished and desperate civilians.

….read it all HERE

Why The Bear Will Be Held At Bay

Summary

Despite similarities to 2015, energy sector weakness won’t bring a bear market this time around.

While retail and energy are weak, other key areas are still strong.

Copper strength points to continuing long-term bull market.

Financial markets have been relieved that the past few days have passed without more inflammatory rhetoric from either President Trump or Kim Jong-un. The U.S. stock market recovered from sharp losses last Thursday, Aug. 10, when tensions were high between the two countries. The Dow Jones Industrial Average was up for the last four trading sessions (as of Aug. 16) in response to the easing of tensions, retracing most of its losses from last week.

Although there has been a decent bounce in most major indices after last week’s dip, the internal health of the NYSE broad market remains a concern in the immediate term (1-3 weeks). In the past few months, whenever the S&P 500 (SPX) has sold off and fallen to the 60-day moving average, there has been a technical bounce followed by either a sharp rally or some more consolidation and then another rally. See the chart below.

973376-1502940487833549-1

…read more HERE

Learn Your Market History Now Or Be Forced To Learn It The Hard Way Later

George Santayana was noted as saying:

“Those who cannot remember the past are condemned to repeat it”

As human beings, we all have a limited life span. And, as one generation fades away, we often see the next generation growing in its shadow, but forgetting the lessons learned by those who came before them. Sadly, it is a fact of life. 

Today, we see the stock market and certain assets like Bitcoin rising to heights never imagined by market participants even 5 years ago. Yet, we believe the reasons for the rise in price are different today than they were in generations past.

Many analysts and market participants are certain that it is purely due to central bank’s actions that we are creating a new bubble. In fact, someone forwarded me what some deem as “analysis,” which stated that “bubbles are a symptom of central bank monetary policy.” And, sadly, many market participants believe this to be true. 

Unfortunately, too many are willing to adopt what they read as truth, without testing it through the prism of intellectual honesty. So, let me present you a question to test the ultimate “truth” presented about central c22cb6033f069963e4a07f627e3e9627banks and bubbles: What central bank caused what is considered to be the first speculative bubble in modern history – “Tulipmania?” 

For those who are unfamiliar with history, in the 17th century, which is regarded as the Dutch Golden Age, contract prices for tulip bulbs reached extraordinarily high levels and then dramatically collapsed in February 1637. At the peak of “tulipmania,” a single tulip bulbs sold for more than 10 times the annual income of a skilled craftsworker. 

Yet, there was no central bank that was involved in this event. And, amazingly, this has been the case study for what we deem to be a “bubble” within markets. Moreover, it has been determined that this bubble was caused by the “madness of the crowd,” as coined by Charles Mackay. So, again, no where do I see any central bank involvement in this case study of a market bubble.

You see, Mackay concluded that crowds often behave irrationally, especially when dealing with financial markets. This irrationality of the market is what causes bubbles to occur. While we may want to view a central bank as the “rational reason” for such bubbles, the ultimate point is that there is nothing rational about bubbles. Therefore, rational reasons are immaterial, if you really think through the issue carefully. 

Unfortunately, most are too willing to adopt the commonly held fallacies about financial markets rather than engage in any independent thought. So, they simply propagate the commonly held fallacies, which causes them to be even more widely adopted by the masses, as the great majority of the public will never test these perspectives through a prism of intellectual honesty and truth.


So, while so many erroneously believe that it is the central bank that “causes” these bubbles, the truth is that these bubbles are caused by the irrationality of the market, and this is the one truth that has withstood the test of time throughout all known bubbles. 

Moreover, it is the same irrationality of the market which causes the central banks to act. So, rather than being an actual cause to the bubbles, central banks are mere actors within the causation chain, all being directed by the same force – the irrationality of markets, or, as we define it, the sentiment of the market.

The reason I bring this up is because of the logically inconsistent position it will require you to hold if you believe the central bank is so powerful as to cause a bubble. It would mean that you would have to believe that the central bank can control the market. But, if that were the case, how would a market ever crash? You may then say that the central bank pushed the market up, whereas market irrationality or sentiment caused it to crash. But, if the central bank is unable to control both sides of the market, then it clearly is not in control at all. Rather, it’s the market irrationality, or sentiment, which is in control at all times, as that is what pushes markets to the extremes from which it also triggers the crash.

I have performed analysis in the past to prove this to be the case in our own financial markets. Yet, too many are still beholden to the fallacy that the central banks are the driving force behind market movements. Sadly, when market sentiment pushes the prices in the market to the ultimate extreme, and then turns those prices to the downside, anyone believing in the omnipotence of the central banks will be caught on the wrong side of price when those central banks will fail to stop the market decline driven by market sentiment, despite their repeated attempts. We learned this in the Great Depression. 

“The Federal Reserve System, from February to December 1931, increased the issue of Federal Reserve notes by 80%. These issues were due to bank failures which made necessary a larger use of cash. Yet, after a wave of bank failures . . . both banks and their depositors began raiding each other in a cut-throat competition which more than defeated the new issues of Federal Reserve notes.”

Irving Fisher, Booms and Depressions, 1932

Since we are several generations beyond that period of time, the masses have clearly forgotten those lessons, and are falling into the same traps of those from generations past.


Avi Gilburt is a widely followed Elliott Wave technical analyst and author of ElliottWaveTrader.net (www.elliottwavetrader.net), a live Trading Room featuring his intraday market analysis (including emini S&P 500, metals, oil, USD & VXX), interactive member-analyst forum, and detailed library of Elliott Wave education.

The Guns of August, The Trade Set-Up & Removing your Rose Colored Glasses


Today I am going to lay out the case of a major market top and how it fits into the geopolitical backdrop of today. We then profile the trade set-up to look for and finally I will forcefully remove your Rose Colored Glasses you have been wearing since January 2017.

In Barbara Tuchman’s “The Guns of August” she argues that August 1914 was when the Gilded Age died and the modern era actually began. The book opens with the famous depiction of Edward VII’s funeral in 1910 attended peacefully by all the kings of Europe. Never again would the body of world leaders be unified and cut from a similar cloth. The war ushered in a new world, not recognizable from the past. Not since that time have we witnessed such diplomatic folly as in the month of August 1914. Today we wonder are we witnessing a similar conflict between a super power and the client state of China which is an emerging super power?  Could it unfold in a similar fashion?

Since May I have chronicled the topping process associated with a post bubble contraction. We have witnessed the following sequence:

1 The Gold-Silver ratio initially warning of an upcoming credit contraction in the future.

2. European stocks putting in a top in the traditional time window of May-June

3. USA stocks embarking on a final run for the roses, one last hurrah over the summer.

4. The Gold-Silver ratio signaling a confirmation of its original signal.

5. Yield curve flattening and credit spreads widening

6. Investor psychology embracing market top behaviors.

7. An initial crack in the US indexes in the time window of August or September.

The Topping Process

Over the summer we have watched the indexes relentlessly rise despite narrower breath. The FAANGs drove the NASDAQ and Boeing drove the Dow over the past 6 weeks. The DOW being a price weighted index, was inordinately influenced by Boeing, now a $240 stock. Boeing’s rise accounted for 75% of the DOW’s gain since the beginning of July. Strip Boeing out of the DOW and the index barely even rose… Same with the FAANG’s effect on the NASDAQ.

This of course is classic topping action. It masks the underlying exhaustion which has been occurring in individual issues. The exhaustion expressed itself in a lack of volatility. On August 8th the S&P 500 had gone 13 days in a row with less than a 0.3% fluctuation. This has never occurred since records have been kept since 1927.  This compression then expressed itself with the VIX exploding over 80% in a raucous 3 day move.

Bearish market signals have been evident to the few who cared to interpret the charts. Let’s take a look at some of the flashing red flags available to all who care to see:

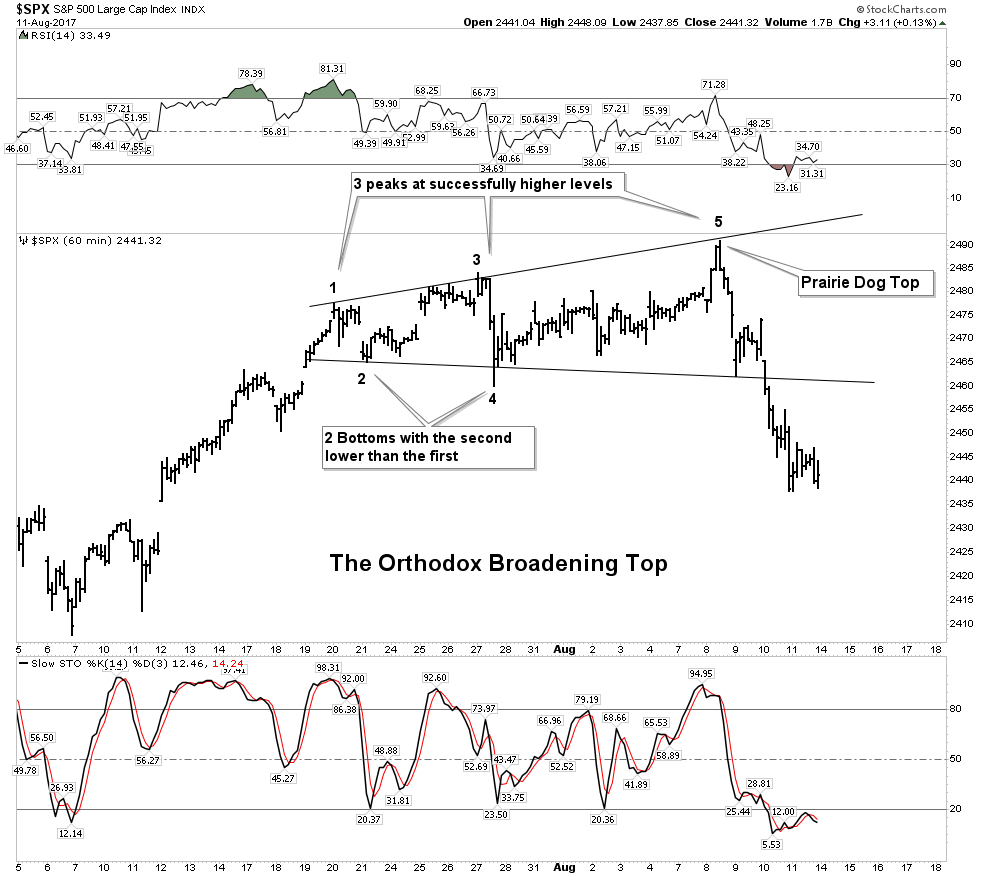
S&P 500 Orthodox Broadening Top

Pull out your copy of the bible of technical analysis: Edwards and Magee. Look under the index for “The Orthodox Broadening Top”. The example they use is Air Reduction Co. from 1929. I will scan and post below:

EM-Broadening-top-Air-Reduction-759x1024


E&M remind us this type of top comes from low volume markets (check) and it is precisely defined on the chart (check). It’s definition is:

“It has three peaks at successfully higher levels and, between them, two bottoms with the second bottom lower than the first. The assumption has been that it has been completed and an in effect as an important reversal indication just as soon as the reaction from its third peak carries below the level of its second bottom”


Knights, I believe in making charts as simple and uncluttered as possible. Clean charts deliver the most powerful messages. This chart above should make you sit up and take notice. It is classic, right out of the pages of the Edwards and Magee reference book.

My analysis of this chart actually shows weak exhausted action. E&M state that 4 out of 5 examples of this pattern have a re-test of high #3 (point #5). This re-test often exceeds the high by up to 3%. We see this re-test in the above example in Air Reduction Co labeled as 5b.  In our present day case we see the S&P spike high in a prairie dog top with no ability to rally for a re-test. This is a case of exhaustion and in my analysis is quite foreboding.

I emphasize that E&M characterize this pattern as “extremely bearish” and it depicts the last stages of a Primary Uptrend. That’s right,- PRIMARY. This was the principle pattern that exhibited itself in numerous individual issues in the 2 months leading into the crash of 1929.

Within this current broadening top formation we can also see two loosely formed H&S tops as well.  Bottom line: This is a treacherous reversal pattern.

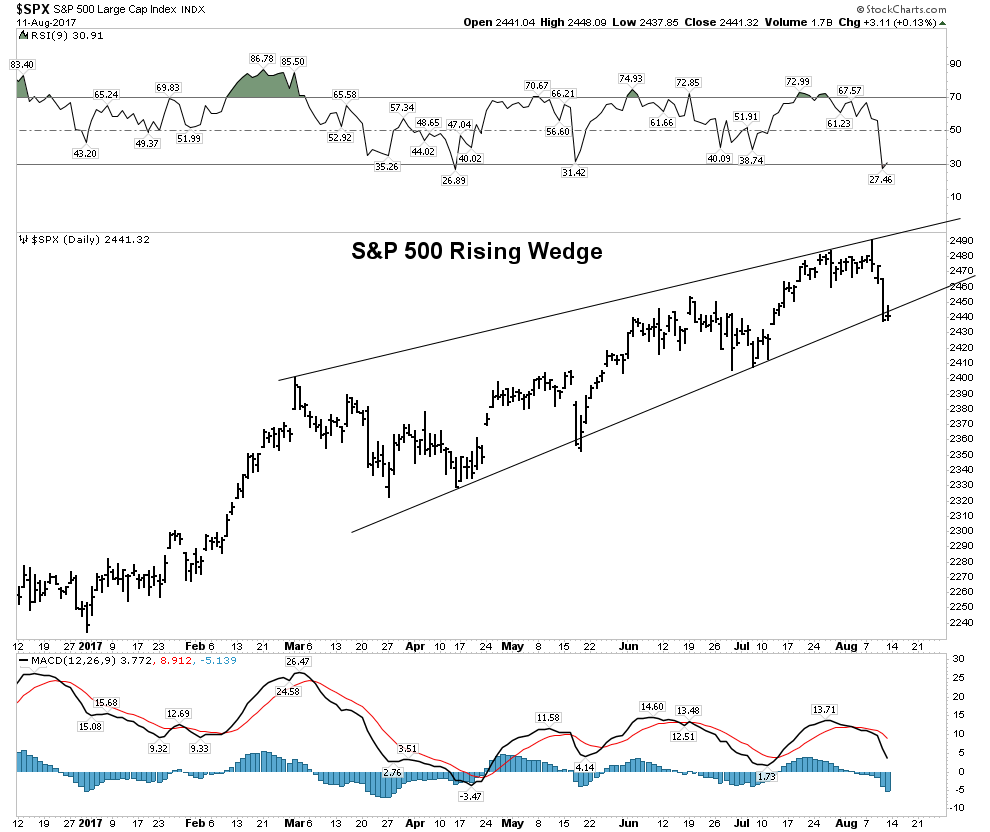
S&P 500 Bearish Rising Wedge

If we step further away and look at a daily chart over the past 8 months we see the S&P 500 forming a presumedly bearish rising wedge.  I will cover the investment set-up later on at the end of this section.


Red Flags Everywhere

The FAANG stocks have risen relentlessly all year long, however recently have been broadcasting major trouble ahead. Let’s take a look at some of the red flags:

…..continue reading HERE