
Timing & trends
It’s going to be a long and busy week. From Fedlines to Durable Goods to GDP…there’s a lot going on. And Lord knows what lies ahead politically and geo-politically! Here’s just a brief summary:

The metals have begun the week just slightly to the upside and this is nice. More on this later today and as we go through the week, of course.
However, for today I’d like to simply concentrate on the two charts below. Again, the only real value in analyzing the CoT reports is in being able to reference the current positioning versus historical data and price. For me, the best way to do this is to simply lay some data onto a weekly price chart.
Let’s start with Comex Digital Gold. If you listened to last Friday’s podcast, then you know that:
- At 157,094 contracts, the Large Spec GROSS short position is the largest seen since the survey taken July 28, 2015
- At 153,064 contracts, the Gold Commercial GROSS long position is the largest since December 1, 2015
- At 73,635 contracts, the Gold Commercial NET short position is the smallest since January 26, 2016
But how does this all appear on the chart? Are these levels historically significant? Please take the time to expand (and perhaps print) this chart. Take a good, long look and decide for yourself.

Now that’s all very interesting. However, where the historical perspective really jumps out at you is when you consider the chart/data combo for Comex Digital Silver. Again, as of the report released last Friday and surveyed last Tuesday:
- At 81,400 contracts, the Large Spec GROSS short position is the largest ever reported. In fact, the size of this position is now 27% greater than the previous all-time high of 63,993 seen on July 7, 2015
- At 66,398 contracts, the Silver Commercial GROSS long position is the largest since August 25, 2015
- At 88,312 contracts, the Silver Commercial GROSS short position is the smallest seen since January 19, 2016
- At 21,914 contracts, the Silver Commercial NET short position is the smallest since September 15, 2015
As in CDG, if we plot some data and price together, the result looks like this. Again, please take some time to give this chart your full consideration.

So what does this mean? Well it certainly appears that chances are high we see some significant rallies from here. As important technical indicators such as moving averages get bullishly crossed, these massive Large Spec short positions are ripe for a squeeze. Shorts get covered (that’s one buy) and then a long may be established, too (that’s a second buy). All of this buying pressure will drive prices higher in the weeks ahead and this coincidentally falls right into line with our forecast of a failing 2017 narrative (GAN2017) and 2017 metal price highs in Q4.
Have a great day!
TF

Chart: Retail Apocalypse 2017
The steady rise of online retail sales should have surprised no one.
Back in 2000, less than 1% of retail sales came from e-commerce. However, online sales have climbed each and every year since then, even through the Great Recession. By 2009, e-commerce made up about 4.0% of total retail sales, and today the latest number we have is 8.3%.

Here’s another knowledge bomb: it’s going to keep growing for the foreseeable future. Huge surprise, right?
SIGNS OF A RECKONING
Retailers eye their competition relentlessly, and the sector also has notoriously thin margins.
The big retailers must have seen the “retail apocalypse” coming. The question is: what did they do about it?
Well, companies like Sears failed the shift to digital altogether – in fact, it is even widely speculated that the former behemoth might file for bankruptcy later this year.
The majority of other companies, on the other hand, are trying to combine “clicks and bricks” into a cohesive strategy. This sounds good in theory, but for established and sprawling brick and mortar retailers with excessive overhead costs, such tactics may not be enough to ward off this powerful secular trend. Target, for example, has had impressive growth in online sales, but they still only make up just 5% of total sales. As a result, the company’s robustness is also in doubt.
Wal-Mart took another route, which could potentially be the smartest one. The company hedged their bets by buying Jet.com, which was one of the fastest growing online retailers at the time. Later, they followed up by buying an online shoe retailerto help fill a perceived gap in footwear. Recent reports have surfaced, saying that these acquisitions are leading to staff shakeups, as the company re-orients its focus.
After all, going online is not just a tactic to boost sales in the new era of retailing. It has to be a mindset, and one that is central to the company’s strategy. Hopefully Wal-mart gets that, otherwise they will also be in trouble as well.
APOCALYPSE NOW
In the midst of all of this is what is described as the “retail apocalypse”.
There are two main metrics that are pretty black and white:
Number of Bankruptcies: We’re not even one-third through 2017, and we already have about as many retail bankruptcies as the previous year’s total. If they continue at the current pace, we could see over 50 retailers bankrupt by the end of the year.
Number of Store Closings: So far we’ve seen roughly 3,000 store closings announced in 2017, and Credit Suisse estimates that could hit 8,600 by the end of the year. That would easily surpass 2008’s total, which was 6,200 closings, to be the worst year in recent memory.
Here’s some of the companies that have already filed for bankruptcy:
- Gordmans Stores
- Gander Mountain
- Radioshack (again)
- HHGregg
- BCBG Max Azria
- Eastern Outfitters
- Wet Seal
- The Limited
- Vanity Shop of Grand Forks
- Payless Inc.
- MC Sports
And here are the store closings occurring as a result of the retail apocalypse:


 1. Is Canada in “Serious Trouble”?
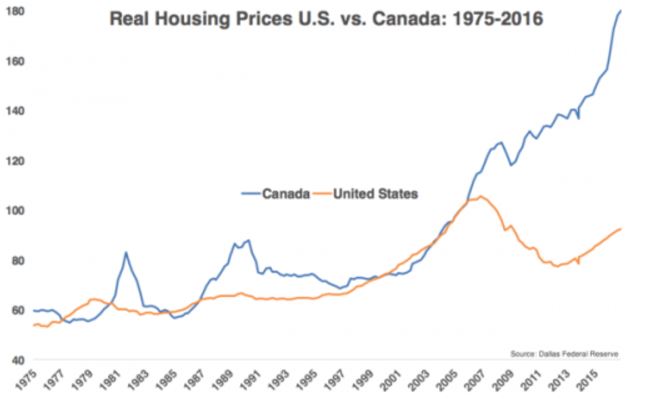
One week after we channeled Deutsche Bank’s Torsten Slok, who two years ago warned that “Canada is in serious trouble“, a warning which was especially resonant after last week’s rate hike by the Bank of Canada – the first since 2010 – which we argued threatens to burst Canada’s gargantuan housing bubble…
2, Mortgage Advice in a Rising Rate Environment
Following the first rate hike in Canada in 7 years, Kyle Green joins Michael to share some ideas on how to protect yourself – and some of the unforseen pitfalls of the mortgage world.
3. Gold’s Summer Rally Intensifies
By Morris Hubbartt
Today’s videos and charts (double click links to enlarge):
SFS Key Charts & Video Analysi
SF60 Key Charts & Video Analysis
SF Juniors Key Charts & Video Analysis

Just a quick, happy update on the gold/silver COT reports. See last week’s post for a little more background.
Speculators are running scared in the paper precious metals markets. And that’s a good thing.
The past few months’ correction has finally led hedge funds and other technical/momentum traders to shed their long positions and load up on short bets. Meanwhile the Commercials, which tend to be right at big turning points, are becoming much more bullish.
Historically, the kind of internal structure now evolving in the futures market has signaled the start of a new upswing in prices. That may or may not hold this time around. But if it’s not a screaming buy, it is an indication that that day is getting closer.


via:


A 5,800 square km section of the Larsen C ice shelf split off the continent sometime between Monday and Wednesday, according to a release from Project Midas, which has been keeping an eye on it. The iceberg’s split has been expected for quite some time, and although it’s certainly a big chunk, it doesn’t set the record for biggest ‘berg to break free from Antarctica… CLICK HERE for the complete article

-
I know Mike is a very solid investor and respect his opinions very much. So if he says pay attention to this or that - I will.
~ Dale G.
-
I've started managing my own investments so view Michael's site as a one-stop shop from which to get information and perspectives.
~ Dave E.
-
Michael offers easy reading, honest, common sense information that anyone can use in a practical manner.
~ der_al.
-
A sane voice in a scrambled investment world.
~ Ed R.
Inside Edge Pro Contributors

Greg Weldon

Josef Schachter

Tyler Bollhorn

Ryan Irvine

Paul Beattie

Martin Straith

Patrick Ceresna

Mark Leibovit

James Thorne

Victor Adair