
Timing & trends
Todd Market Forecast for Tuesday June 27, 2017 6:00 P.M. Eastern, 3:00 Pacific.
DOW – 99 on 850 net declines
NASDAQ COMP – 101 on 900 net declines
SHORT TERM TREND Bullish
INTERMEDIATE TERM Bullish
STOCKS: Our short term gauges have a very good record, but they’re not perfect. This is especially true if an unexpected event hits the markets.
Today, news that the Senate would not vote on the Republican health care bill until after the 4th of July called into question the Trump agenda which had supported the markets. It obviously means that Senate leaders are having trouble lining up votes.
In addition, Mario Draghi of the ECB made some comments about inflation that sent European and U.S. bonds sharply lower and European stocks were also hit.
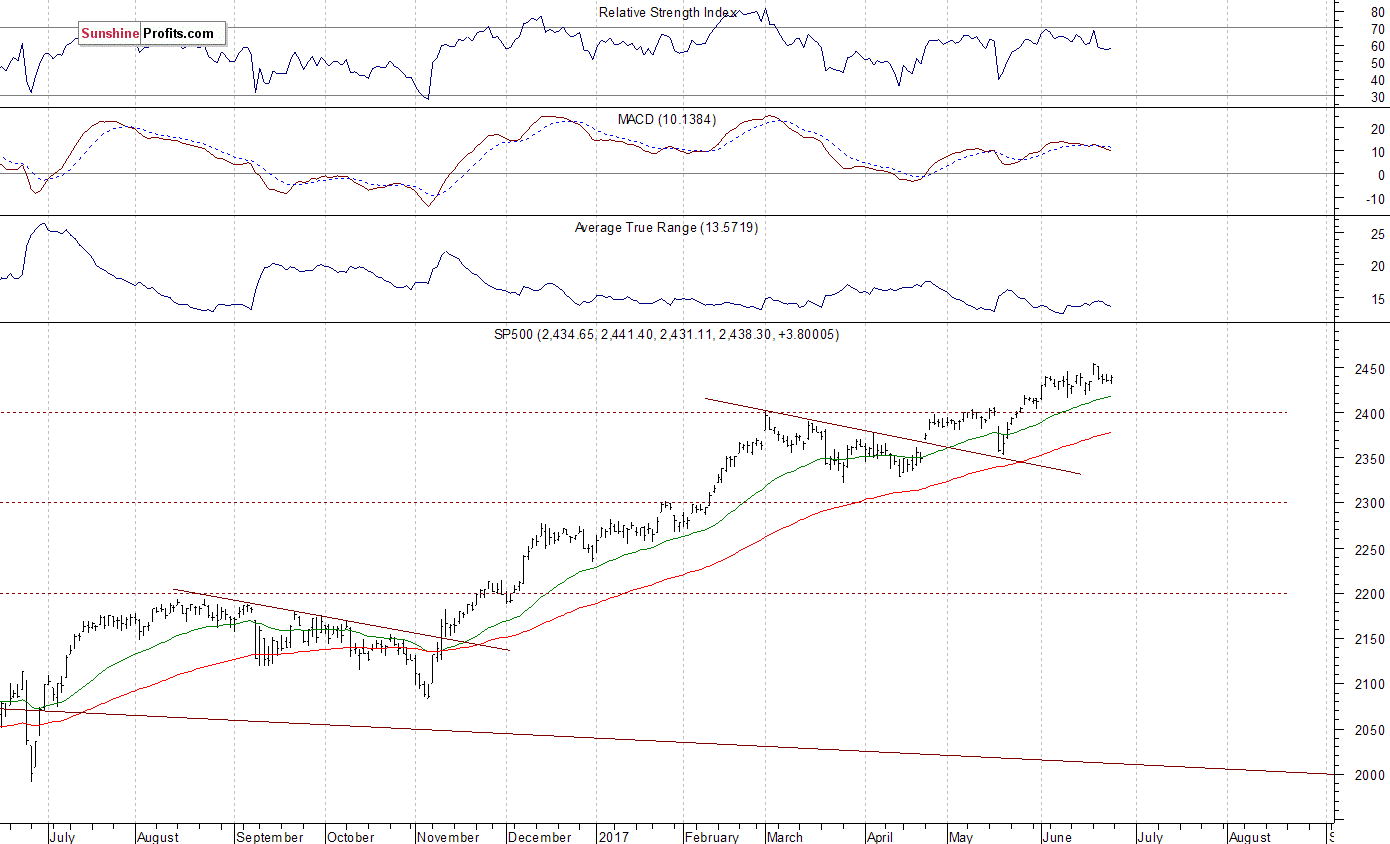
But help may be on the way. Check the chart.
GOLD: Gold could only manage a gain of $4, in spite of the dollar’s collapse. This should get interesting.
CHART Five day RSI is back to oversold levels. This is normally a positive for the next couple of weeks.

BOTTOM LINE: (Trading)
Our intermediate term system is on a buy.
System 7 We are in cash. Stay there.
System 8 We are long the SSO from 91.04. If the S&P 500 is lower at 12:45 EST on Wednesday, sell at the close. More in “interesting stuff” section below.
System 9 We are in cash. Stay there.
NEWS AND FUNDAMENTALS: The Case-Shiller Home Price Index rose 0.3%, less than the expected rise of 0.6%. Consumer confidence came in at 118.9, better than last month’s 117.6. On Wednesday we get the trade deficit and oil inventories.
INTERESTING STUFF: I have been using the breadth statistics, in other words, the advancing issues vs declining issues for exiting our trading positions. —–However, these stats aren’t readily available to everyone so we will move more toward looking at the S&P 500 change.
Advance – decline stats used to be on CNBC and other financial stations, but have become less available in recent years. This is good. Breadth indicators are very effective, but especially so if fewer people are using them. —–And we will continue to utilize them in our analysis.
NEWS AND FUNDAMENTALS: The Case-Shiller Home Price Index rose 0.3%, less than the expected rise of 0.6%. Consumer confidence came in at 118.9, better than last month’s 117.6. On Wednesday we get the trade deficit and oil inventories.
TORONTO EXCHAN GE: Toronto was down 35
BONDS: Bonds were down sharply.
THE REST: The dollar collapsed on Tuesday. Crude oil surged.
Bonds –Change to bearish as of June 27.
U.S. dollar -Change to bearish as of June 27.
Euro — Change to bullish as of June 27.
Gold —-Bullish as of June 23.
Silver—- Bullish as of June 23.
Crude oil —- Change to bullish as of June 27.
Toronto Stock Exchange—- Bearish as of June 14, 2017.
We are on a long term buy signal for the markets of the U.S., Canada, Britain, Germany and France.

Monetary conditions (+2 means the Fed is actively dropping rates; +1 means a bias toward easing. 0 means neutral, -1 means a bias toward tightening, -2 means actively raising rates). RSI (30 or below is oversold, 80 or above is overbought). McClellan Oscillator ( minus 100 is oversold. Plus 100 is overbought). Composite Gauge (5 or below is negative, 13 or above is positive). Composite Gauge five day m.a. (8.0 or below is overbought. 13.0 or above is oversold). CBOE Put Call Ratio ( .80 or below is a negative. 1.00 or above is a positive). Volatility Index, VIX (low teens bearish, high twenties bullish), VIX % single day change. + 5 or greater bullish. -5 or less, bearish. VIX % change 5 day m.a. +3.0 or above bullish, -3.0 or below, bearish. Advances minus declines three day m.a.( +500 is bearish. – 500 is bullish). Supply Demand 5 day m.a. (.45 or below is a positive. .80 or above is a negative). Trading Index (TRIN) 1.40 or above bullish. No level for bearish.
No guarantees are made. Traders can and do lose money. The publisher may take positions in recommended securities.

 In this week’s issue:

In This Week’s Issue:
– Stockscores’ Market Minutes Video – The Profit is in the Patience
– Stockscores Trader Training – Fussy Traders Do Better
– Stock Features of the Week – Stockscores Simple Weekly, under $10
Stockscores Market Minutes – Prioritize Your Trades
Your winners have to pay for your inevitable losers. This week, I discuss the importance of having patience with your winners and how to know when it is time to exit them. Then, my weekly market analysis which highlights why June has been a poor month for short term trading. Finally, my trade of the week on CPRX. Click Here to Watch
To get instant updates when I upload a new video, subscribe to the Stockscores YouTube Channel
Trader Training – Fussy Traders Do Better
Traders, particularly those who need to make money rather than those who would like to make money, tend to have a fear of missing out. They hear about a trading idea or find an opportunity with their own effort and make the trade with less thought than they might put into buying a microwave. They can invest thousands of dollars on an impulse, much like the drunken gambler who throws down $1000 on Five Red.
One reason for this sort of reckless approach to trading is the belief that trading ideas are like gifts. They only come along from time to time and you should feel grateful for the opportunity. If you spend 10 hours researching a company or receive the occasional bit of insight from someone who should know more than the rest of us, it’s easy to understand why you wouldn’t want to let a seemingly promising trade slip through your fingers. The problem is that this gratitude for trading ideas leads you to lower your standards and place trades that are not much more than a gamble.
Have you ever made a trade and then, just a few minutes or days later, asked yourself what the heck you were thinking? If you are normal, then it’s likely that you have because it is easy to focus on the dream of making a profit. You should focus your attention on the trading situation as it has been presented to you by the market rather than the words of an expert. Some trading opportunities are so well marketed that it’s hard to see the truth because you fixate on the profit potential that has been dangled before you as the prize.
It is critical to only take trades that meet the criteria of a strategy that you have found to have a positive expected value. Rather than look for a reason to take the trade, which is easy, look for a reason not to. Ask yourself, “If I buy this stock, who will be selling to me, and what does she know that I don’t know?” Looking at the other side of the argument will often highlight considerations that you have missed.
Being fussy is a lot easier when you recognize that the market-even a slow market-will give you opportunities. The markets have been pretty quiet this year but there are still stocks outperforming the market every day.
And if you can’t find a trade today, tomorrow or in the next week, eventually you will. There is always another bus coming down the road. If you miss one, just wait for the next.
I have found that you will actually make more money by trading less. If you maintain a very high standard for what trades you make, you will always pass on some trades that end up doing very well. By being selective, however, you will also avoid many marginal trades that would tie up your capital and then incur a loss. By being fussy and trading less, you end up taking only the very best trades and your results will be better overall.
It is easy to be fussy when the market is strong and there are lots of opportunities. It’s like fishing when every time you cast your line you get a bite. With that kind of success, you will quickly throw back any fish that is too small because you know there’s going to be something better coming along soon. You only take the best of the best.
When the fish stop biting and you spend hours with no bounty, you take the first fish that grabs your hook. It could be a tiny fish that you would never keep on even an average day, but with your desire to catch something, you keep it anyway. It would be better to have just not gone fishing at all.
You’ll do the same thing when trading a slow market. Eager to make a profit, you will take trades that show some potential even if they don’t meet all of your requirements. You will work hard to uncover a trade rather than wait for the obvious no-brainer trades that you take when the market is in a giving mood.
I like to say that in trading, when the going gets tough, the tough get lazy. You can’t control the market, so if the market is not giving you opportunities, it’s better to do nothing. Your hard work will not change what the market does.
This is hard for many people who have been programmed to relate hard work to success. If you try harder than the next person in a sport, you should get a better result. If you study harder for an exam, you should get a better mark. If you work longer hours at your job, you should make more money. In the stock market, if you work harder to find good trades, you will probably lose money.
The best trades are easy to find. Working hard to uncover something leads you to find questionable trades that you have to talk yourself into. It’s better to walk away when you have doubts.
This is not to say that hard work is not rewarded in trading. Traders who work hard at practicing their analytical skills or developing new strategies will be rewarded. People who devote their time and effort to improving their emotional control will be better traders. These are things that you can control and affect with hard work, but hard work won’t change what the stock market does.

The trading action in the lower priced stocks is improving so I ran the Simple Weekly scans on Stockscores for stocks under $10, focused on the 3 year weekly charts in search of the right patterns. Below are two stocks that I think have good potential:

1. BDSI
BDSI has endured a long and ugly slide from $18 down to under $2 but is starting to move up again with a pick up in volume last week and some abnormal price action. Support at $2.20.

2. KIN
KIN is making a nice up and handle break on the weekly, support at $6.80.

References
- Get the Stockscore on any of over 20,000 North American stocks.
- Background on the theories used by Stockscores.
- Strategies that can help you find new opportunities.
- Scan the market using extensive filter criteria.
- Build a portfolio of stocks and view a slide show of their charts.
- See which sectors are leading the market, and their components.
Disclaimer
This is not an investment advisory, and should not be used to make investment decisions. Information in Stockscores Perspectives is often opinionated and should be considered for information purposes only. No stock exchange anywhere has approved or disapproved of the information contained herein. There is no express or implied solicitation to buy or sell securities. The writers and editors of Perspectives may have positions in the stocks discussed above and may trade in the stocks mentioned. Don’t consider buying or selling any stock without conducting your own due diligence.
Our intraday outlook is bearish, and our short-term outlook is bearish. Our medium-term outlook remains neutral, following S&P 500 index breakout above last year’s all-time high:
Intraday outlook (next 24 hours): bearish
Short-term outlook (next 1-2 weeks): bearish
Medium-term outlook (next 1-3 months): neutral
Long-term outlook (next year): neutral
The U.S. stock market indexes were mixed between 0.0% and +0.5% on Friday, as investors continued to hesitate following economic data, quarterly earnings releases. The S&P 500 index remains relatively close to its last Monday’s new all-time high of 2,453.82. It has reached new record high after a breakout above short-term consolidation along the level of 2,420-2,440. Stocks have rebounded strongly following their mid-May quick two-session sell-off and continued over eight-year-long bull market off 2009 lows. The Dow Jones Industrial Average remains close to its last Tuesday’s new all-time high at the level of 21,535.03. The technology Nasdaq Composite was relatively stronger than the broad stock market on Friday, as it continued to retrace its recent move down. The nearest important support level of the S&P 500 index is at around 2,430-2,435, marked by last Monday’s daily gap up of 2,433.15-2,441.79. The next level of support is at 2,415-2,420, marked by some recent local lows. The support level is also at 2,400-2,410, marked by the May 25 daily gap up of 2,405.58-2,408.01, among others. On the other hand, level of resistance is at 2,450-2,455, marked by new all-time high. There have been no confirmed negative signals so far. However, we can see overbought conditions and negative technical divergences. The S&P 500 index is trading within its three-week-long consolidation, as we can see on the daily chart:
Will Uptrend Continue?
Expectations before the opening of today’s trading session are positive, with index futures currently up 0.3% vs. their Friday’s closing prices. The European stock market indexes have gained 0.7-1.0% so far. Investors will now wait for the Durable Orders number release at 8:30 a.m. The market expects that it fell 0.6% in May. The S&P 500 futures contract trades within an intraday uptrend, as it breaks above its last week’s consolidation along the level of 2,430. The nearest important level of support is at 2,425-2,430, marked by last Monday’s gap-up opening, among others. The next support level is at around 2,415-2,420, marked by recent local lows. The nearest important level of resistance is at around 2,445-2,450, marked by record high, among others. The market extends its short-term consolidation, as it continues to trade along all-time high. Is this a topping pattern before downward reversal or just flat correction within an uptrend? There have been no confirmed negative signals so far.
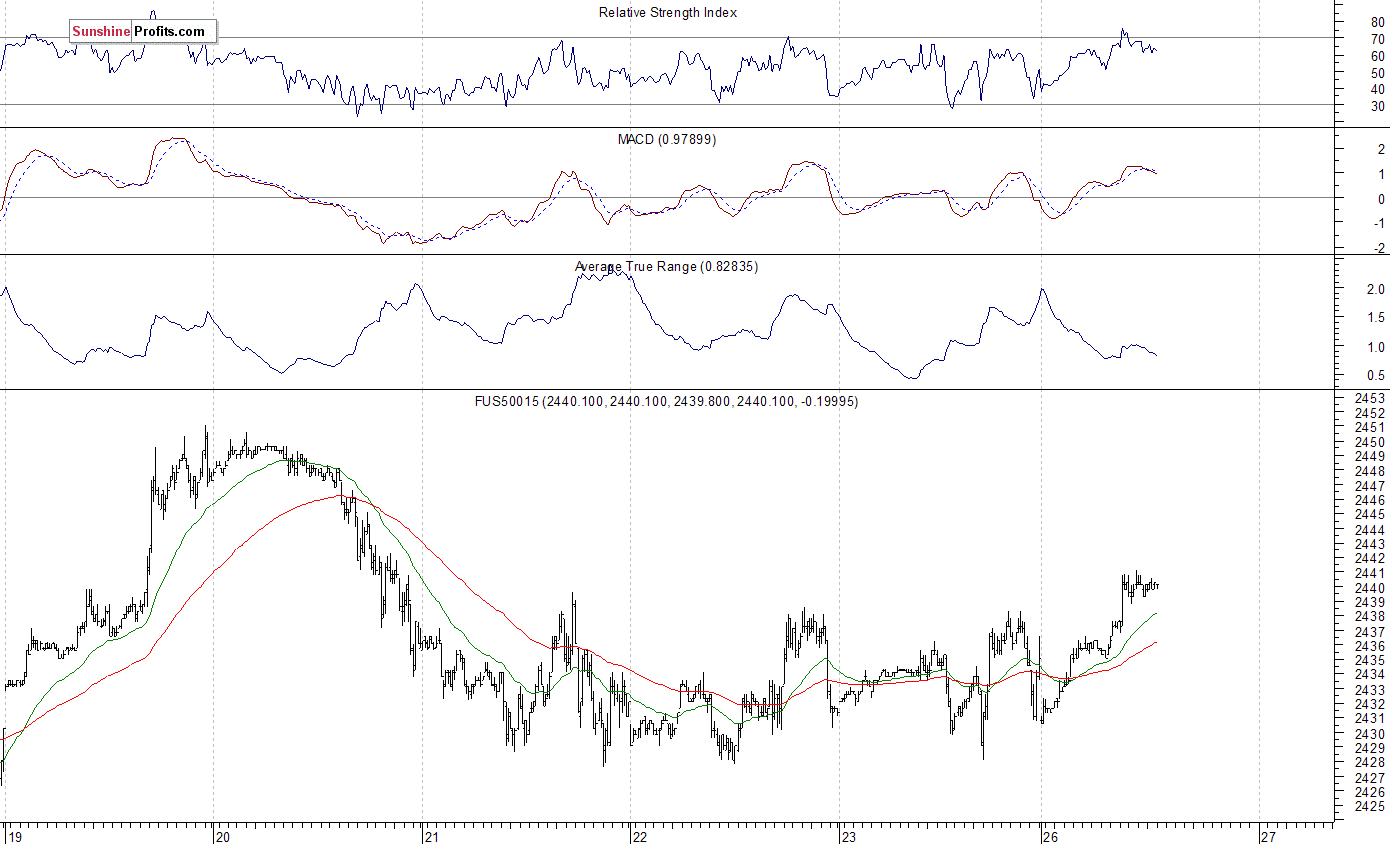
Positive Expectations
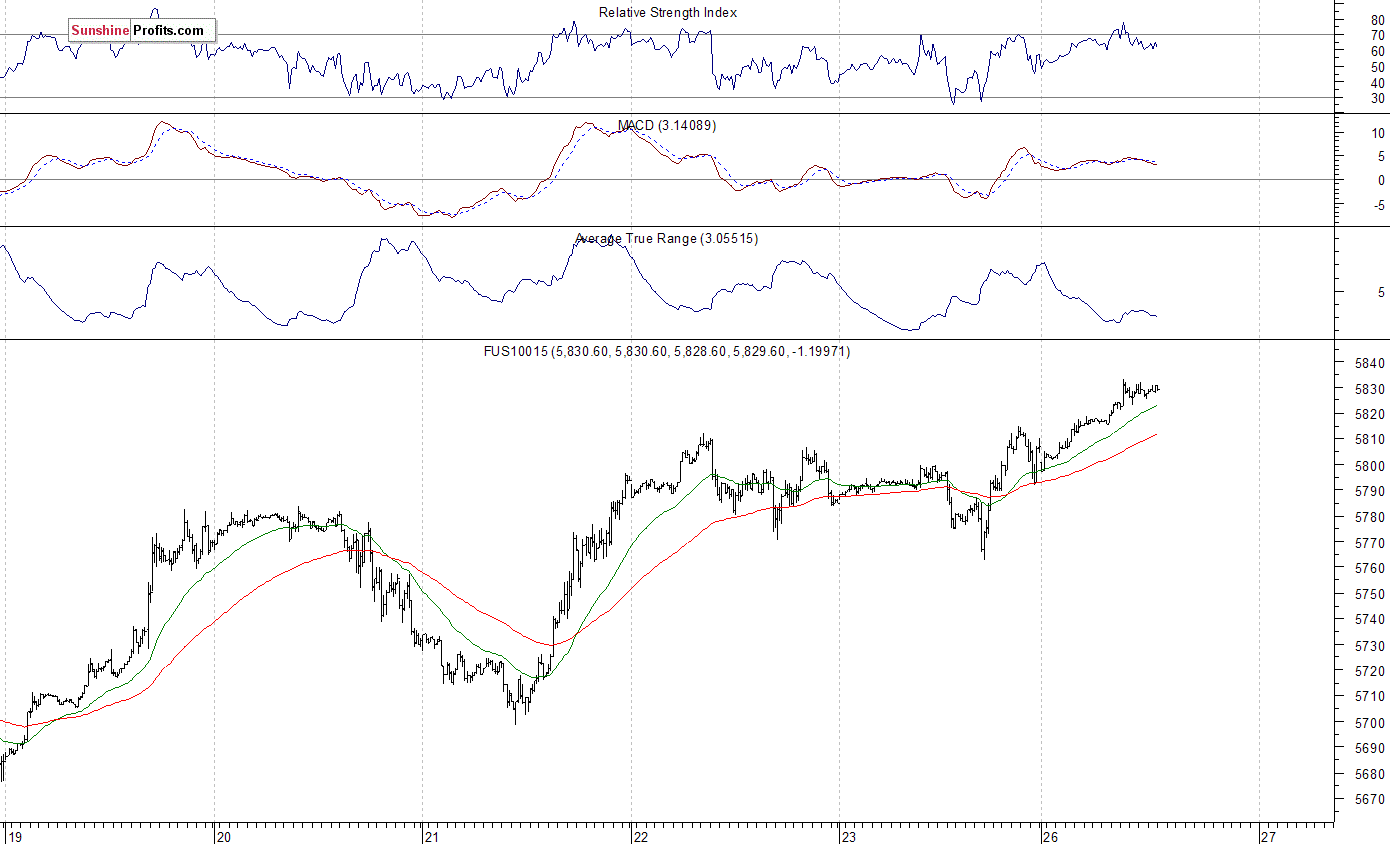
The technology Nasdaq 100 futures contract follows a similar path, as it currently trades within an intraday uptrend. It retraces some more of June 9 sell-off. The nearest important level of resistance is at 5,840-5,850, marked by previous short-term local lows. The next resistance level is at around 5,900, marked by record high. On the other hand, support level is at around 5,800-5,810, marked by previous level of resistance. The next support level is at 5,770, among others, as the 15-minute chart shows:
Concluding, the S&P 500 index continued to trade relatively close to record high on Friday. Will over eight-year-long bull market continue? Or is this some medium-term topping pattern accompanied by very bullish investors’ sentiment? There have been no confirmed negative signals so far. However, we still can see negative technical divergences, along with medium-term overbought conditions.
If you enjoyed the above analysis and would like to receive free follow-ups, we encourage you to sign up for our daily newsletter – it’s free and if you don’t like it, you can unsubscribe with just 2 clicks. If you sign up today, you’ll also get 7 days of free access to our premium daily Gold & Silver Trading Alerts. Sign up now.
Thank you.
Paul Rejczak
Stock Trading Strategist
 1. Random Thoughts on this Crazy Charging Stock Market Bull
By every measure of logic and or common sense, this bull market should have crashed years ago. However, it hasn’t, and much to the angst of many professionals continued its march upwards against all the odds.
2. The Middle East Is Blowing Up
Every day brings another scary headline from the Middle East — which makes it easy to treat them as background noise rather than a clear and present danger. But the latest batch is reminiscent of the Balkans circa 1914, which means it may be time to tune back in.
3. Bob Hoye: Checklist for a Top
Understandably, we don’t publish a “Checklist for a Top” all that often. But when we do, it is daunting. Not everyone is a researcher or trader. There are real lives and portfolios out there that are vulnerable.

76 years ago, “Joltin’ Joe” DiMaggio was in the middle of the hitting streak of streaks that would come to 56 consecutive games and which has remained a major league baseball record to this day. That season (1941), the Yankee Clipper would bat .408 during the epic streak or more than 4 hits for every 10 at bats. Ted Williams, of the Boston Red Sox, had the highest batting average in 1941, hitting .406 for the entire season.
What would you say if I told you that a batter had hit 1.000 for an entire season? Or that a pitcher threw no-hitters every time he played a game? I’m pretty sure you would say that’s impossible or that something was definitely wrong. And, of course, you would be correct – somethings are too impossible or outlandish to be true. Not just in baseball, but there are limits in almost every endeavor.
Therefore, I wouldn’t blame you if you questioned what I claim is the winning streak of all winning streaks in trading COMEX silver futures. Data published by the CFTC, the federal commodities regulator, indicate that JPMorgan and two or three other large financial institutions, have never taken a loss, only profits on every single silver trading position they have established over the past nine years and, in fact, for a lot longer than that. You can question what I claim all you want, but do yourself a favor and make sure you question me deeply enough – please don’t let me off the hook easily.
 Let me first define what I mean by establishing a COMEX silver position and never taking a loss. I’m not talking about high-speed computer day trading (HFT) which makes up the lion’s share of trading volume in silver and just about everything else. I’m talking about positions taken and held for weeks and months before they are closed out. Since JPMorgan and the two or three institutions which together hold the impossibly-perfect trading record in silver have never been net long COMEX silver futures, the trading positions established and closed out without loss, only profits, have all been short positions. If you are always net short on the COMEX, which JPMorgan and the other big perfect traders have always been, you can’t take long positions – only close out or add new shorts.
Therefore, JPMorgan and the two or three other large “never wrong, always right” COMEX traders only trade from the short side; always adding new short contracts first at higher prices than where those contracts are later bought back and closed out at. From studying silver intensely for more than 30 years, I don’t think I would be able to sleep peacefully for a minute if I ever found myself actually short the metal. I think I’d rather go skydiving without a parachute. Given silver’s long history of sudden price spikes, including the spike to nearly $50 six years ago, one would think a silver short position taken by JPM and the others, would end in a loss, at least once in a while. One would be wrong to think that.
Any thought of a baseball player hitting 1.000 or pitching no-hitters for a season is, I admit, far-fetched – that’s why I chose this example. And if it did occur, the only possible explanation would be that the game was somehow rigged. No player is that good, not even Joltin’ Joe or Ted Williams. Likewise, I admit that the thought is far-fetched that anyone could trade silver from the short side and bat 1.000, never taking a loss, only profits, not just for a season, but for nine years and longer.
So let me first show that JPMorgan and a few other traders have achieved what would have to be thought to be impossible and then just how such an impossibly-perfect silver trading record was actually accomplished. Fortunately, both the “what” and the “how” of the perfect silver trading record can be found in official CFTC data, including both the weekly Commitments of Traders (COT) and monthly Bank Participation Reports. I know this is usually where many eyes glaze over, so I’ll try to speak in the simplest terms possible. But please keep in mind that if JPMorgan’s perfect silver trading record could be seen easily, it would have been common knowledge long before now.
Every long form COT report contains concentration data, by which the agency sets out the positions held by the 4 and 8 largest traders, on both a gross and net basis, on both the long and short side of every commodity included in the reports. For reporting purposes, concentration data are given as a percentage of total open interest, so they must be hand-calculated to be converted into terms of numbers of contracts. No doubt this “extra step” discourages many from digging into the data. That’s too bad, because the concentration data tells the real story in COMEX silver futures.
What the data show are that the 4 largest short traders in COMEX silver futures on a “net” basis have never taken a loss, only profits for the past nine years and even longer (going back to 1983). The reason I speak in terms of the past nine years is because that’s the point at which JPMorgan became the largest COMEX silver short seller when in took over Bear Stearns in March 2008. No, I can’t know this from COT data alone, as the 4 and 8 largest traders in each commodity aren’t identified by name, according to CFTC regulations (which should be changed).
How I can know, for sure, that JPMorgan took over from Bear Stearns as the largest short seller in COMEX silver futures and has remained the largest silver short seller is from CFTC correspondence to lawmakers at the time and subsequent COT and Bank Participation Reports to this day. How I can know, also for sure, that JPMorgan and two or three other big COMEX silver short traders have only taken profits and never a loss when establishing new short positions in COMEX silver futures is from observing the continuing flow of data in the COT and BPR reports.
I’ve calculated and hand-recorded the concentrated data on the 4 and 8 largest net shorts in COMEX silver and gold futures for more than 25 years and, at least since 2000, on a weekly basis when the COT report first went weekly from every two weeks. The good news is that the weekly data is readily available and easy to retrieve from January 2005 to the present on the main CFTC COT web page (under Historical Viewable) for anyone interested in verifying what I’m about to say.
I’ve been making a big deal out of the concentrated silver short position for decades and I suppose that’s why I started to hand record the data in a good number of notebooks I keep around. I can assure you that I did not begin to calculate and record the concentration data decades ago with any sense whatsoever that I would be using it to make the case today about JPMorgan’s perfect trading record. This is all quite accidental – I hand-recorded the data because it helped clarify my thinking about market structure. It would have been impossible for me to have kept the data because I knew I would be making the claim of a perfect trading record today, 25 years after I started.
The running changes in the concentrated short position of the four largest shorts in COMEX silver futures show the unmistakable pattern of the short position increasing whenever prices rose above the key moving averages and always decreasing when silver prices fell below those same moving averages. This may sound simple, but it means that the four largest shorts never took a loss because they never covered a short position at prices higher than the price originally sold short at. And because the data show that the concentrated net short position always decreased when silver prices fell below where the short sale was first established, it means all such trades were profitable. Thus, no losses, only profits.
I’m making this as simple as possible and I know that the big short sellers are “making markets” and providing other various “necessary” services in their constant matchup against the managed money technical funds that tend to justify the big shorts’ perfect trading record – but that’s the whole point. Call it whatever you want, but the four biggest shorts in COMEX silver futures, led by JPMorgan, have always been right and have never been wrong when establishing a new silver position for many, many years. I would submit that could only occur if the game was rigged. That’s the “what” part; now how the heck have they pulled this off?
The main means by which the four big COMEX silver shorts have been able to amass a perfect trading record is because they have been granted unwritten but undeniable de facto permission from the CFTC and the CME Group to sell short as many silver contracts as necessary to satisfy as much buying demand that may arise. This can be seen in the growth over the years in the size of the concentrated short position in COMEX silver. On April 18, the concentrated short position of the 4 largest shorts hit an all-time record of 79,338 contracts, the equivalent of more than 396 million oz – that’s about 100 million oz net short per trader. If you are looking for a reason why silver prices were capped at $18.50, look no further.
But having the ability to short sell unlimited quantities of silver contracts to cap the price is only half of the equation of the perfect trading record, although it’s the biggest part. Once the silver price is capped by whatever number of concentrated short sales that was necessary, the short positions must then be bought back at lower prices if a profit is to be made and loss avoided. In fact, the ability to short sell unlimited quantities is easier to see than is the methodology for how those added short positions have always been bought back at lower prices. But not if you look closely enough.
The key to buying back all added silver short positions at lower and thereby profitable prices is collusion, pure and simple. And not just on behalf of the four largest shorts either, as all the smaller commercials participate in the buy side collusion. We know that the commercials are constantly snookering and hoodwinking the technical funds into and out from positions because the technical funds are slaves to buying and selling as prices move higher and lower, set by commercial prices prompts (spoofing and HFT, in general).
Where the collusion comes in is in the remarkable patience, discipline and lack of overt competition on the part of the commercials in buying whatever the technical funds can be induced to sell as the commercials rig prices lower. There’s never any pushing or shoving by the commercials to buy silver contracts, they are the very model of civility and patience. There’s a good reason for that; if any of the commercials break rank and rush to buy before the other commercials, the whole scam would fall apart. I’ve jokingly referred to the commercials as behaving as the Three Musketeers in that they are most usually one for all, all for one; but it’s no joking matter – cooperation of this sort is collusion.
There’s no question that the silver market is the most rigged game in the world because no one would be able to establish a more perfect trading record than what JPMorgan and a few other big shorts have achieved. The only question is what can and will be done to end it. In time, the charade will become clear enough to a sufficient number of people, including the victimized technical funds, to bring changes to interrupt the perfect trading record of the big shorts – knowledge is power and all that.
I still believe a quicker route to end the silver scam could come at the hands of the regulators, including the CFTC’s new Enforcement Director, James McDonald. I don’t think there’s any chance that the agency will ever find JPMorgan guilty of manipulating the price of silver (as this crooked bank sorely deserves) for the simple reason that such an action would leave JPMorgan open to an unlimited number of lawsuits; enough to sink what is thought to be an unsinkable ship. No government agency would ever do that. But that doesn’t mean the regulators are helpless, either.
My suggestion is still that McDonald privately order JPMorgan and a few other big silver shorts not to add new shorts ever again. This will break the perfect trading record and end the manipulation immediately. Will the agency and McDonald find the courage to do so? Time will tell, but the clock is ticking. Although he’s only been in office for a bit over two months, there have already been two incredibly blatant price takedowns in silver (as I just described above) on McDonald’s watch. The way to end a rigged game is to go after the riggers, not to pretend the game isn’t rigged.
On to developments since Saturday’s review….
Ted Butler
June 22, 2017
For subscription information please go to www.butlerresearch.com

-
I know Mike is a very solid investor and respect his opinions very much. So if he says pay attention to this or that - I will.
~ Dale G.
-
I've started managing my own investments so view Michael's site as a one-stop shop from which to get information and perspectives.
~ Dave E.
-
Michael offers easy reading, honest, common sense information that anyone can use in a practical manner.
~ der_al.
-
A sane voice in a scrambled investment world.
~ Ed R.
Inside Edge Pro Contributors

Greg Weldon

Josef Schachter

Tyler Bollhorn

Ryan Irvine

Paul Beattie

Martin Straith

Patrick Ceresna

Mark Leibovit

James Thorne

Victor Adair