
Timing & trends
A potential increase in risk may create massive opportunities for investors.
Throughout our ongoing analysis of the US markets, metals, energy and other market sectors, one thing we have seen over and over is that markets can, and often do, develop longer term trends than most people believe are possible or believable.
Recently, numerous analysts have been warning of potential “critical crashes” and “deep retracements” because of the fear that this rally is nearing some type of end cycle. We believe the charts tell the story of the investor sentiment and that, at some point in the future, these predictions may become true – but not today.
The VIX chart tells us quite a bit in terms of volatility, trend and potential market changes. One can see from this chart that the VIX has been trending within a “flag formation” that reaches a pinnacle in October 2017. This contracting flag formation is telling us that, unless the VIX breaks this range substantially, it should continue trading within this range for some time. At some point in the future, the VIX will break this flag channel and we could, then, see much more dramatic price volatility and corrections. But, until that time, contractions will continue to be muted in size and the bullish trend is likely to continue for a while.
Notice the averages are near the 12~13. There is a strong likelihood that the VIX could pop into and above these levels, briefly, through natural market contractions in the near future. By our analysis, roughly every 10~15 trading days (2~3 weeks) the VIX attempts to make some attempt at these levels from extreme lows.
I originally wrote this article on June 7th, but was not able to get it edited and posted until this weekend. See my statement below regarding when the VIX was set to spike:
This cycle indicates we should expect a VIX spike near June 9th or 12th and June 29th. Well, Friday the VIX spiked big as the NASDAQ crashed. In fact, I did take a net short position on the VIX as I expect stocks will continue their trend higher and thus the VIX will fade back down. I took this swing trade with my automated VIX trading system AT VIX
 The NASDAQ has been the driving force in the US majors for quite some time and the chart of the NASDAQ below proves why. The Tech heavy NASDAQ has been driven to new highs on what we believe is a “capital migration” from local and foreign sources into the stability of the US markets. Almost like the Dot Com bubble, investors are piling into the tech stocks with the belief that these companies will continue to generate billions in revenues and branch out into other enterprises to drive innovation and growth. I talked about this last week “The Fourth Industrial Revolution, which will be referred to as: Tech Hypergrowth”
One point of interest is that we have recently reached a Fibonacci 1.272 expansion level that will likely prompt a bit of price consolidation/rotation. This level is substantial enough to prompt some level of concern for price rotation, but not enough concern (yet) to warrant panic. Remember, the VIX will tell us when to panic and that will be when it breaks the flag channel and the majors drive lower in correlation with the VIX.
This 1.272 level is cause for “tightening and revaluing open positions”. It means we should be aware that price may attempt a contraction period at this level before attempting to resume trending. One thing to always keep in mind is that price is always seeking new highs or new lows. One way or another, it will get to one of those objectives.
Additionally, the clear price channel (red levels) on the NASDAQ chart shows us normal price boundaries. A short period of price contraction here would, potentially, allow for resumption of the bullish trend and allow for an additional 2~4% bullish run.


Metals are the other symbols we pay close attention to in regards to trending, correlation to the majors and to determine overall fear/greed factors within the markets. Pay close attention to Gold and Silver over the next few months. Gold has recently broken out of a SIX YEAR downward price channel temporarily last week and may attempt a move higher on global uncertainty. News from Europe, China and South America are concerning for the markets in general. Defaults, bankruptcies and “bail-ins” are the standard practice for these types of events. No reason to panic in regards to these events (yet) as they are fringe events – smaller, localized and isolated. Still, the metals markets will react to these concerns by factoring in the fear/greed levels globally.
Gold is also setting up a massive Flag Formation originating from December 2015. This formation tells us that potential upside targets, should a metals breakout/run happen, would be $1457, $1547 & $1788. We’ll keep you informed of opportunities as they play out with the metals.

Do you find this analysis helpful and insightful? Want more of it and my trades? Consider joining ActiveTradingPartners.com where our analysts and researchers are hard at work finding the best possible opportunities for you every day

1. Preparing for THE Bottom: Part 1 – Gold
Since the bull market in gold started over 15 years ago, we haven’t seen such a long consolidation pattern – ever. Even the big 2008 plunge was followed by a rally almost immediately (from the long-term point of view, that is). The gold volatility index confirms the above having recently moved to new all-time lows
2. Qatar & the Rising Tensions in the Middle East – On Schedule
Stephen Poloz, Governor of the Bank of Canada said they are keeping rates the same for the 15th time in face of uncertainty. Also his views on the economy, challenges from the US including the selloff of their strategic oil reserve and more….
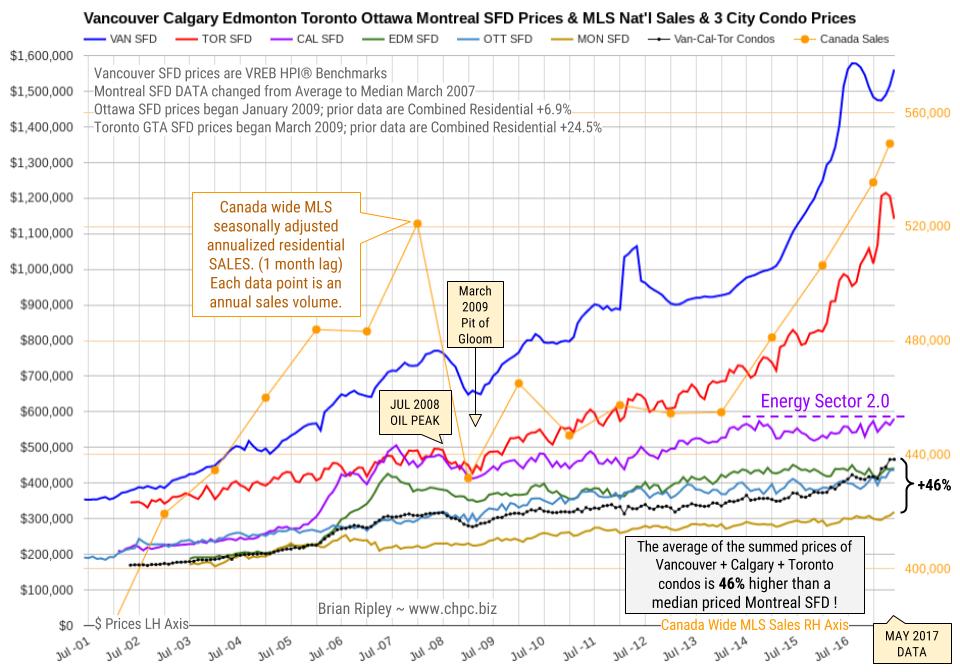
3. Canada 6-City May Housing Prices & the Plunge-O-Meter
The average detached housing prices for Vancouver, Calgary, Edmonton, Toronto, Ottawa and Montréal. And the Plunge-O-Meter which tracks the dollar and percentage losses from the peak and projects when prices might find support.
 With the price of gold nearing the $1,300 level in early trading, this is the reason why there was a panic to push the price of gold lower today.
Gold So Close!
By Andrew Adams, at Raymond James
June 7 (King World News) – Finally, gold has been on a bit of a tear lately to rocket back up close to $1300, and if it can just get over $1310 or so, it should have a good chance to once again challenge its highs from last July…
…also from KingWorld:
One Of The Greats Says Gold & Silver Are Poised For Major Bullish Advances


Qatar is known for its ultra-modern architecture. In this respect, Doha is something to be viewed at least once in life. However, Qatar is a strict religious country that follows sharia law, in which homosexuals and adulterers face a possible death penalty, life imprisonment, or flogging. Qatar is a Salafi version of Sunni Islam, which is an ultra-conservative reform branch that developed in Arabia during the first half of the 18th century. It advocated a return to the traditions of the “devout ancestors” in reaction to the spread of European ideas. Qatar is one of the two Salafi states in the Muslim world, the other being Saudi Arabia.
That said, Qatar is said to be the nost duplicitous country in the world. On the one hand they embrace the West, yet on the other hand many have called it “Club Med” for terrorists. Qatar is the richest nation on Earth on a Per capita basis. Abu Nakhlah Airport (Arabic:مطار أبو نخلة) in Qatar houses both the Qatari Air Force and U.S. Air Force as well as other Coalition personnel. It is also the headquarters of United States Central Command.
….also from Martin:
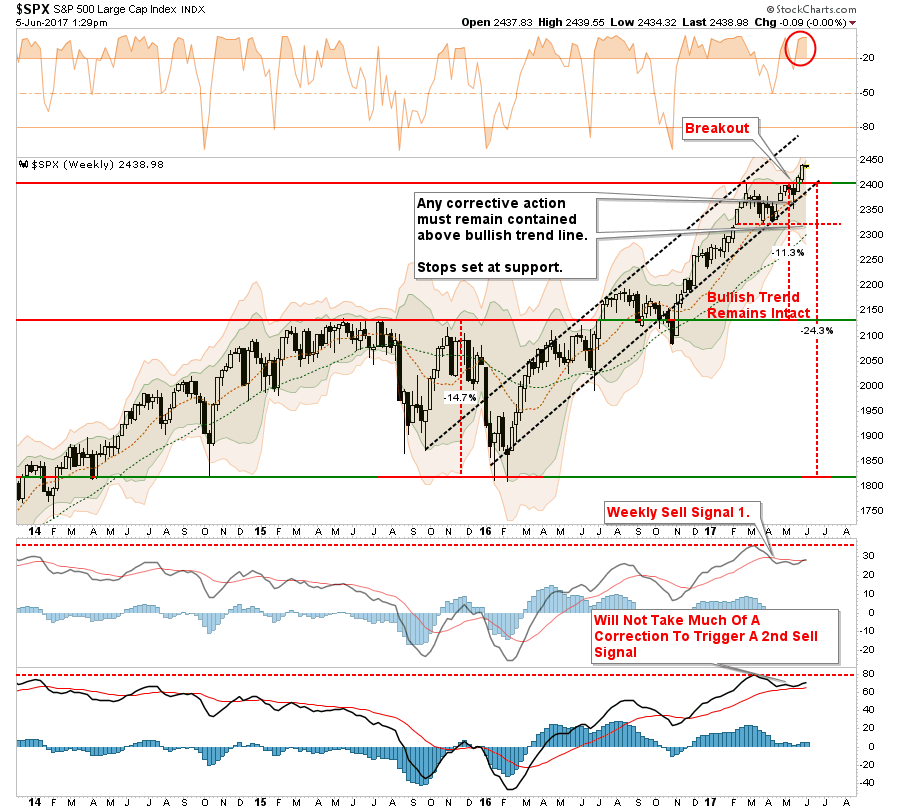
As I discussed in this past weekend’s missive, the breakout of the market to new highs keeps our allocation model nearly fully allocated. However, while we are long, we are still holding onto a little larger than normal cash pile, and raised stop levels, to hedge some volatility risk during the summer months. (Stops have now moved up to the bottom of the bullish trendline as shown in the chart below which coincides with the 100-day moving average which has been a running support line.)
One thing that keeps us a bit more cautious currently is the intermediate term “sell signal” which remains in place from very high levels. That, as shown below, and with a push into 3-standard deviations above the moving average, has not historically had the best outcomes. So, we’re cautious.
This is a very confusing market and the arguments between the “bulls” and the “bears” runs deep. It is these emotional biases of being either “bullish” or “bearish,” primarily driven by the media, which keeps you from truly focusing on long-term outcomes. You either worry about the next downturn, or are concerned you are missing the rally. Therefore, you wind up making short-term decisions which negate your long-term views.
Understanding this is the case, let’s take a look at the technical case for the markets from both a bullish and bearish perspective. From there you can decide what you do next.
THE BULL CASE
1) Central Banks Won’t Let The Markets Crash
This is the primary support of the bullish case, and frankly, one that is difficult to argue with. Despite all of the hand-wringing over valuations, economics or fundamental underpinnings, stocks have been, and continue to be, elevated due either to “direct” or “verbal” accommodation.
I discussed this idea in “The Illusion Of Permanent Liquidity:”
“But what ongoing liquidity interventions have accomplished, besides driving asset prices higher, is instilling a belief there is little risk in the markets as low interest rates will continue or only be gradually tightened.”
As I showed just recently, while the Fed may not be “actively” engaged in further liquidity injections via “Quantitative Easing,” there is certainly a fairly suspicious pattern as to the timing of the “reinvestment” of the balance sheet.

But it isn’t just the “Fed” that has pushed asset prices higher, but every major Central Bank globally with almost all of them pushing record levels of assets.

“Bad news is good news” has been the “siren’s song” for the bulls since “low rates for longer” and continued interventions and verbal accommodation keeps the “global chase for yield” intact.
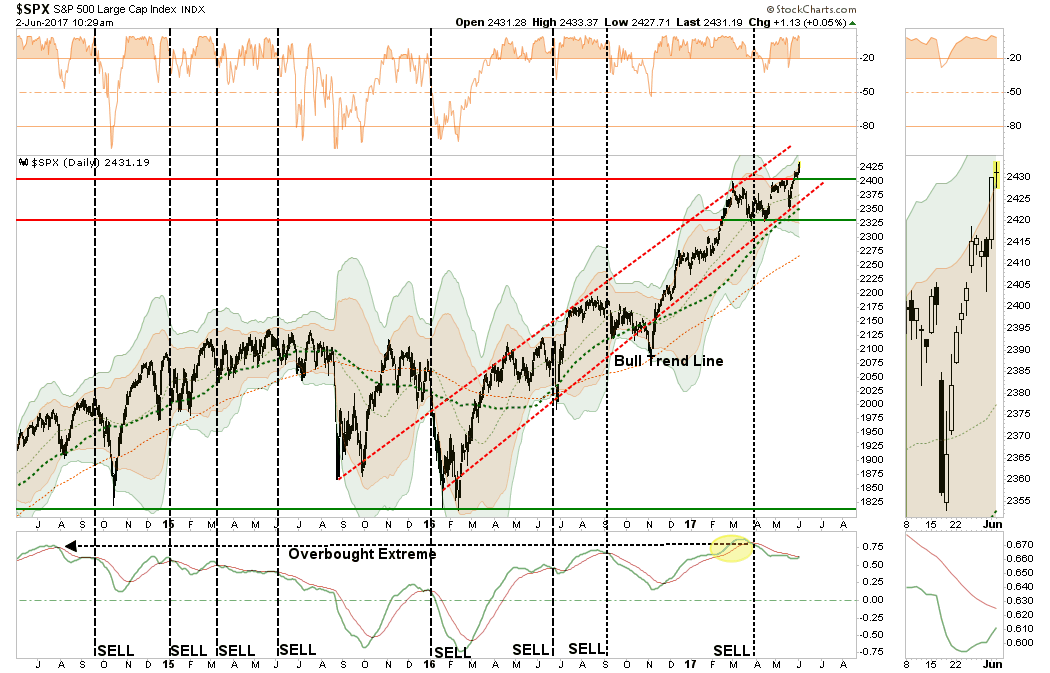
2) Stocks Made A Successful Retest Support & Broke Out
After a good bit of “sideways churning” beginning in March, the market was finally able to muster enough strength to break of the 3-month long trading range and move to new highs. While much of the move came from very light volume, the breakout occurred which is bullish and does suggest higher asset prices in the near term.
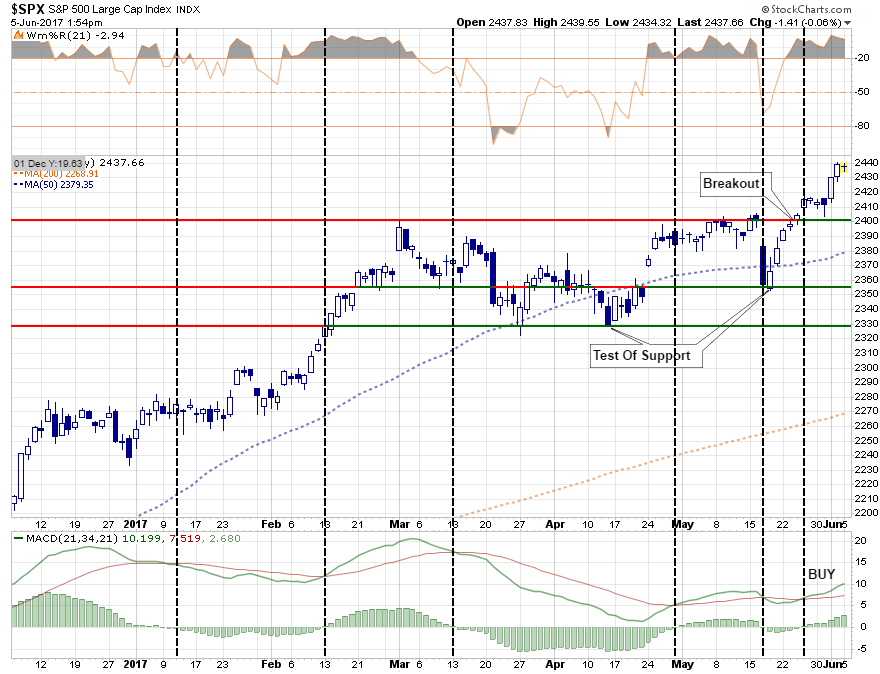
The dashed black lines show the short-term “buy” and “sell” signals with the latest “buy” signal being triggered with the price “breakout” at the end of May.
The market was successfully able to defend crucial support following a “sharp sell-off” on a one-day concern the current Administration “may” have obstructed an investigation. Such was quickly dismissed as #FakeNews by the markets and the markets rapidly regained footing in ongoing anticipation of “tax cuts/reforms.”
Importantly, the “sell signal,” which is shown in the lower part chart above, was also just as quickly reversed removing downward pressure on the market in the short-term. While the markets remain extremely overbought in the short-term, and some corrective action is likely, any such correction that does not violate the recent “breakout” and/or critical support levels, will keep the current bull market advance intact.
3) Advance-Decline Line Is Improving
The participation by stocks in the recent bullish advance has been strong enough to push the advance-decline line back onto a short-term “buy signal” as well.
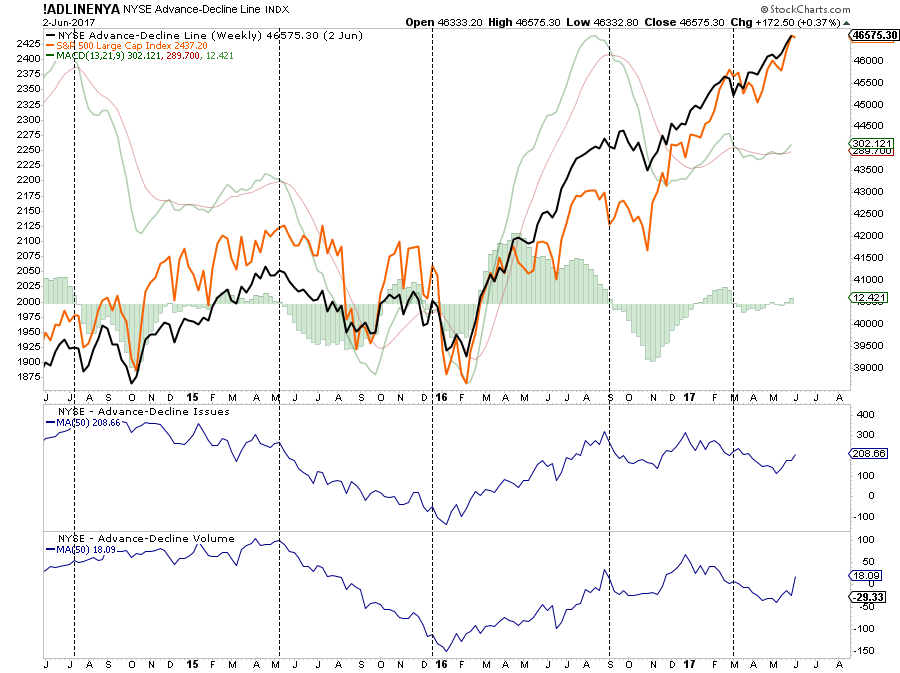
After languishing since the beginning of the year, both the number and volume of stocks on the NYSE are now participating in the advance. The rise in participation supports the bullish momentum behind stocks currently and should not be dismissed.
Currently, as shown above, the short-term dynamics of the market remain bullishly biased. This suggests equity exposure in portfolios remains warranted for the time being. However, let me be VERY CLEAR – this is VERY SHORT-TERM analysis. From a TRADING perspective, this remains a bull market at the current time. This DOES NOT mean the markets are about to begin the next great secular bull market. Caution is highly advised if you have an inherent disposition to “hoping things will get back to even” if things go wrong, rather than selling.
THE BEAR CASE
The bear case is more grounded in longer-term price dynamics – weekly and monthly versus daily which suggests the current rally remains a reflexive rally within the confines of a more bearish backdrop.
1) Bonds Ain’t Buyin’ It
As I noted this past weekend:
“The biggest problem I have currently is simply that bonds are NOT buying the rally. As I discussed last week, and as we saw on Friday, bonds continue their ‘bullish bias’ and broke through key support levels suggesting lower rates to come.”

With interest rates still overbought, and on an important “sell signal,” the downside break from the recent consolidation process suggests lower rates/higher bond prices in the near term.
On a longer-term basis, this suggests that either bonds (risk-off) or stocks (risk-on) is wrong. My suspicion is that ultimately stocks will take the hit as the “credit market,” which analyzes actual balance sheet risk, tends to be right more often than not.
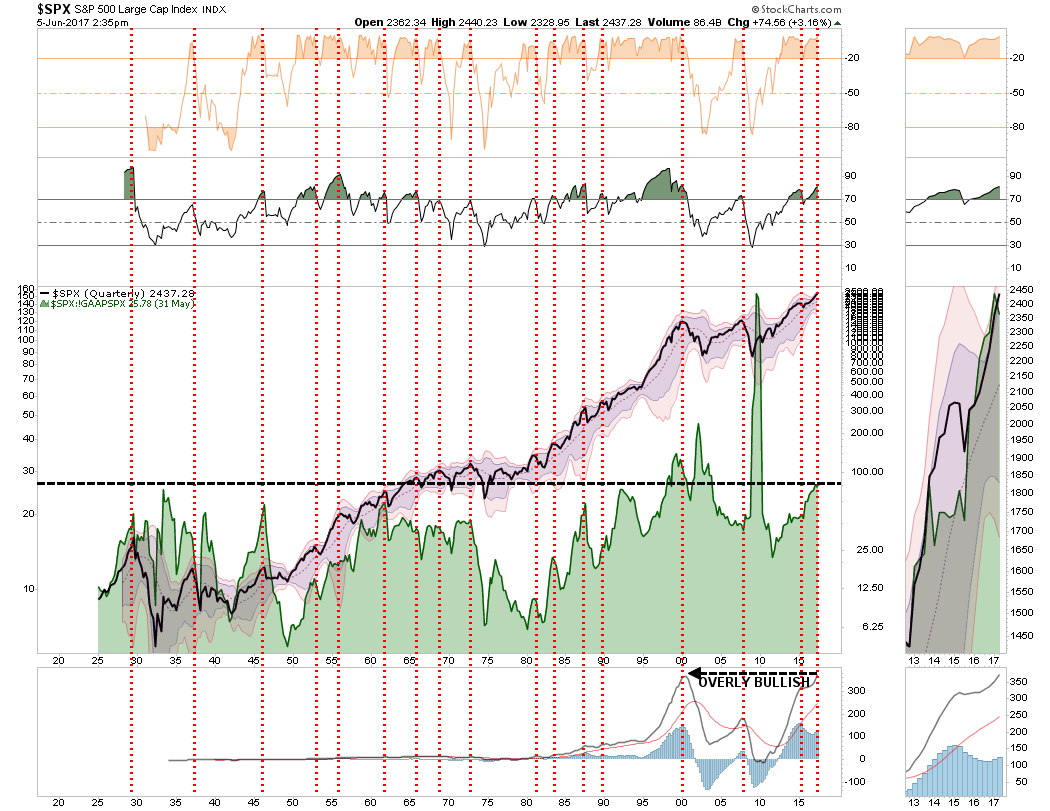
2) Longer-Term Dynamics Still Bearish
If we step back and look at the market from a longer-term perspective, where true price trends are revealed, we see a very different picture emerge. As shown below, the current dynamics of the market are extremely similar to every previous bull market peak in history. Given the deterioration in revenues, valuations, corporate profits, and weak economics, the backdrop between today and the end of previous bull markets remains consistent.
3) M&A Ain’t “M’n or A’n”
A recent post via Business Insider brought to light an interesting view to a longer-term driver of market support.
“M&A lawyers argue the ‘uncertainty’ factor, which has come about recently, given some unpredictable aspects of the new Trump administration, has been the issue. It only may explain the last six months, but the trend has been poor for about two years or more. In the past, there has been some correlation with the S&P 500 and thus it could generate more legitimate fears than some of the other excuses that are put forth for not wanting to buy American equities.”
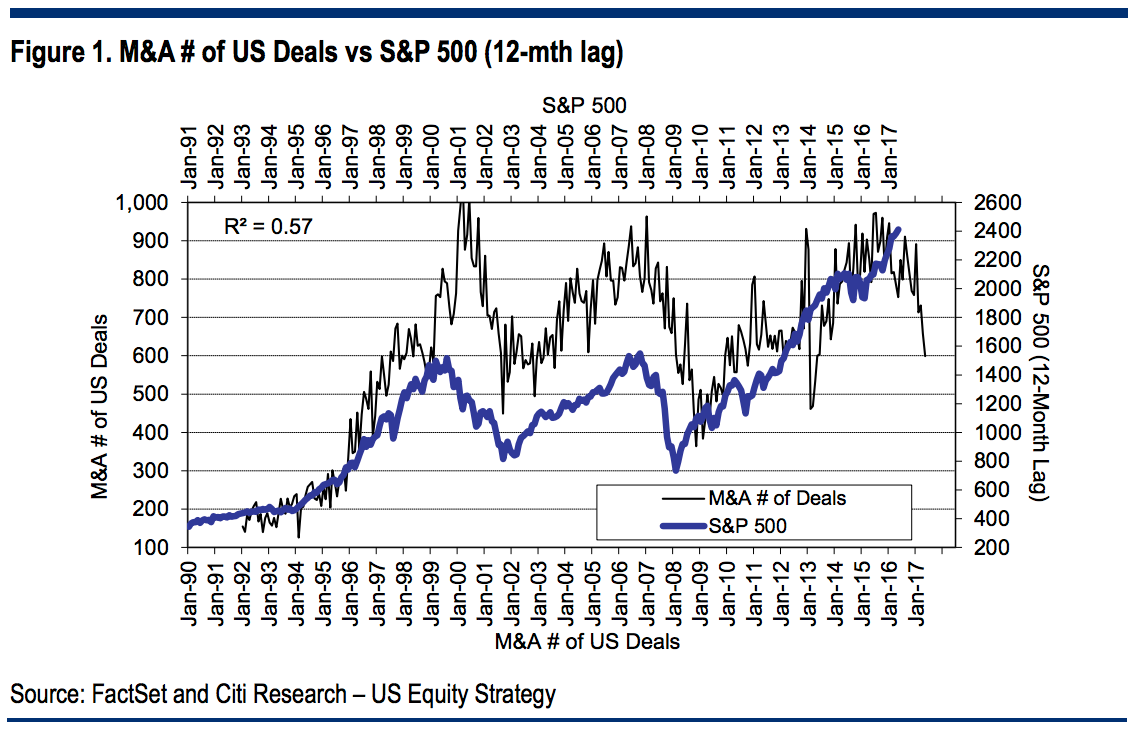
This year through June 5, 7,561 deals were announced, the lowest count since 2013, according to S&P Global Market Intelligence. While M&A volume reached a record $2.055 trillion 2013, the volume has slipped in 2016 to just $1.7 trillion.
Given the length and maturity of the current economic expansion, tighter monetary policy in the U.S. and a lack of legislative agenda moving forward in Washington, there is further risk of M&A support being pulled from the markets.
What you decide to do with this information is entirely up to you. As I stated, I do think there is enough of a bullish case remaining to warrant some equity risk on a very short-term basis.
However, the longer-term dynamics are clearly bearish. When those negative price dynamics are combined with the fundamental and economic backdrop, the “risk” of having excessive exposure to the markets greatly outweighs the potential “reward. “
Could the markets rocket up to 2500, or more, as some analysts currently expect? It is quite possible given the ongoing interventions by global Central Banks, bullish optimism and the rising belief “this time is different.”
The reality, of course, is that while the markets could reward you with 100 points of upside, there is a risk of 600 points of downside just to retest the lows of 2016.
Those are odds that Las Vegas would just love to give you.
“Technically Speaking” is a regular Tuesday commentary updating current market trends and highlighting shorter-term investment strategies, risks, and potential opportunities. Please send any comments or questions directly to me via //lance@realinvestmentadvice.com/” target=”_blank” rel=”noopener noreferrer”>Email, Facebook or Twitter.
….more from Lance Roberts:

-
I know Mike is a very solid investor and respect his opinions very much. So if he says pay attention to this or that - I will.
~ Dale G.
-
I've started managing my own investments so view Michael's site as a one-stop shop from which to get information and perspectives.
~ Dave E.
-
Michael offers easy reading, honest, common sense information that anyone can use in a practical manner.
~ der_al.
-
A sane voice in a scrambled investment world.
~ Ed R.
Inside Edge Pro Contributors

Greg Weldon

Josef Schachter

Tyler Bollhorn

Ryan Irvine

Paul Beattie

Martin Straith

Patrick Ceresna

Mark Leibovit

James Thorne

Victor Adair