Timing & trends

Eerie Calm Shrouds Markets

calmThe VIX, the volatility  of the S&P 500, is sometimes touted as a “fear index.” Today is it extending its push below 10%, to fall to its lowest in nearly a quarter of a century.  
 
There has been four (Finland, Austria, the Netherlands, and France) successive European election that did not produce a victory for the euro-skeptics, who want to leave either the EU or EMU or both.  In Germany, the AfD has imploded and may be lucky to be represented in the Bundestag after the national elections in September.  A few months ago, some were talking about the possibility that Merkel is defeated in her bid for a fourth term as Chancellor.  Merkel and the CDU have done well in the state elections, and will likely do well in this weekend’s contest in NRW, the most populous German state.  
 
Three-month implied volatility in the euro, a common benchmark has broken below 7% to trade at its lowest level since late 2014.  The low since at least 1999 was set in 2014 near 4.75% and besides briefly in 2007, it has not traded below 5%.    The fact that volatility has come off suggests participants are less worried about macro-events and in terms of the spot are anticipating range trading.  
 
The risk-reversal (skew in the pricing of puts and calls equidistant from the money, in this case, 25 delta)  has steadily moved to reduce the premium that is paid for euro puts.  In February, the premium for (three months) puts over calls swelled to more than 3%.  This was the most in five years. The premium fell and today stands near  0.25%.   Calls were briefly at a premium last February for the first time since 2009.  
 
The yen, like the VIX, is often thought of as some sort of fear measure.  Yet to think of the yen as a safe haven may be misleading.  When anxiety is running high, and the pendulum of market sentiment swings toward fear from greed, global investors are not rushing to buy Japanese stocks or bonds.  
 
Instead, two things happen.  First, the US Treasury market is the safe haven.  Investors do in fact flock to the depth, breadth, and security of the US Treasury market.  This exerts downward pressure on US interest rates and weakens the yen through the differential.  Second, often in such anxious moments, Japanese investors who typically exports their savings, stop doing so.  Given Japan’s current account surplus (driven, incidentally, by investment income (e.g., coupon payments, dividends), without the export of savings to recycle the inflows, the yen “naturally” rises.  
 
In any event, the yen has been weakening steadily since the middle of April.  On April 17, the dollar bottomed in front of JPY108.   The US 10-year yield bottomed the next day near 2.16%.  The dollar poked through JPY114.00 for the first time since the Federal Reserve hiked rates in the middle of March.  The dollar has punched through the downtrend line from the year’s high and March highs to approach the 61.8% retracement objective of this year’s decline (~JPY114.65) 
 
Three-month implied yen volatility is a little firmer today after reaching its lowest level in more than a year yesterday a little ahead of 8.0%.  The correlation between the implied yen volatility and the VIX (percentage change 60-day rolling basis) is near 0.35 today, the highest so far this year.  
 
Looking at the put-call skew, one sees that the premium for dollar puts has been sharply reduced since the end of February when it reached 2%.  The skew is now less than 0.5%, the least since late January.  Historically, dollar puts (yen calls) often trade a premium.  The thought was that Japanese corporations who have dollar receivables hedge in the options market by buying dollar puts (yen calls).  One thing the options market may be telling us is that participants are less concerned about a weaker dollar.  
 
The price of gold has fallen for the past three weeks.  With today’s losses, the yellow metal is back to levels seen in mid-March when the Fed last hiked.  It fell through the 200-day moving average last week ($1250) and appears to be making a decisive break of the 100-day moving average (~$1224). Gold appears headed toward a test on the $1180-$1210 area, which may help shape the medium term view.  
 
One need not be a hardcore contrarian or an options trader to take notice of the markets’ calm.  Minsky warned that due to the perverse dynamics and incentive structure, stability could itself can fuel instability.   The French and UK elections next month are interesting but unlikely to shake up investors.    Success is an aphrodisiac, and the former Socialist Macron is drawing candidates that want on his banner.  In the UK there is little doubt that May will lead the Tories into victory.   The German election in September is Merkel’s to lose.  
 
Many observers seem to recognize that Italy’s election next year may be the next important European test.  However, it is a year away.  Perhaps Italian banks are the “ultimate” risk asset.  An index of Italian bank shares is up by more than a third since the end of February.  Yesterday, it reached its highest level since April 2016.  
 
Geopolitics can always come back to bite.  Consider that just yesterday, for the first time this year, a Russian jet violated Estonia’s airspace.  Reports indicate that it did so around half a dozen times last year.  Russia’s foreign policy agenda may not be dependent on who occupies the US White House. Recall, Russia invaded Georgia in 2008 when George W Bush was president.  General Eisenhower was president when the Soviet Union invaded Hungary.   Johnson, who had projected US power in Vietnam, the Middle East, and the Caribbean when the Soviet Union invaded Czechoslovakia.  
 
Russia’s asymmetrical warfare has been successfully deployed on what it calls the near abroad.  It borders.  It has harassed the Baltic States, like Estonia.  The airspace incursions are a subject of diplomatic protests, but not an escalation of tensions.  Where is that line?  Russia can find a small border town in a Baltic country that the majority of people speak Russian and may even have Russian passports.  Isn’t this a logical “next move” in the chess game Putin is playing in central and eastern Europe?  
 
Meanwhile, the Trump Administration is pursuing less antagonistic policies toward China. Remember, after the electoral college victory, Trump spoke to the president of Taiwan, and even questioned the US one-China policy. Trump has not levied a 25% tariff on Chinese goods.  China has not been cited as a currency manipulator.  The US may also be backing off from challenging China in the South China Sea.  The New York Times reported that the Department of Defense had rejected the last three proposals for freedom of navigation operations.  These essentially are a display of US force in waters that some countries, such as China, claim are theirs.  
 
The point here is to note the extremely low levels of anxiety in the market.  The VIX, US Treasuries, gold and the volatility of the yen and the euro, all are pointing in the same direction.  There is not the reason it cannot continue, and this should not be read as a call that the Sky is Falling.  It is meant to show how extreme the calm is, and remind ourselves, that large moves typically do not happen when volatility is high, and investors are anxious and nervous.  It happens when things are calm, and investors see TINA (there is no alternative).   Geopolitics and the divergence of policy, and asset/liability and duration mismatches have not gone away.   It is a reminder that we are often lulled into complacency just before being shocked by how treacherous things really are.  

Gold: A Tsunami of Selling

A chain reaction is forming the last great gold stock buying opportunity of the decade, says Lior Gantz, editor of Wealth Research Group.

Gantz5-7-17-2 1.jpg

I want you to take a close, hard look at this chart: 
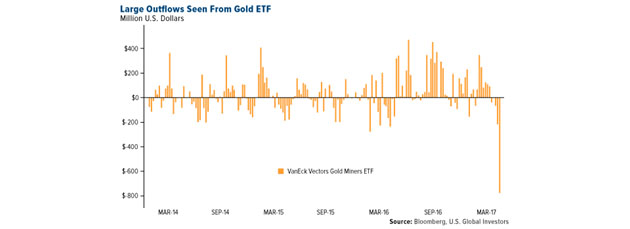
Large Outflows from Gold ETF

The GDXJ (VanEck Vectors Junior Gold Miners ETF) is the ETF that has become one of the world’s most popular investment vehicles for gold investors over the last decade.

The idea behind ETFs is luring many investors by allowing you to buy and sell broad baskets of stocks with a single trade.

It’s a one-click way to buy a basket of small-cap gold exploration, development and production companies, and from January 2010 to May 2017, the market capitalization of the GDXJ grew by 480%. 

Since it became so popular, a technical challenge has emerged: by definition, junior gold stocks don’t have large market caps and their shares don’t have tremendous trading liquidity. The GDXJ grew in popularity so much that it had too much cash and not enough places to put it.

Here’s where this becomes interesting. I know many precious metal investors who are hurting big time right now because they missed the phenomenal move between January and August of 2016 and have been seeing nothing but a massacre ever since. 

My gut and the research I’ve put together suggests that we are about to undergo a frenzy sell-off, something that will cause some gold investors (who have too much of their net worth weighting in gold-related stocks) to feel like puking, but for those who prepare, I am telling you that this is your “Bitcoin at $3” moment.
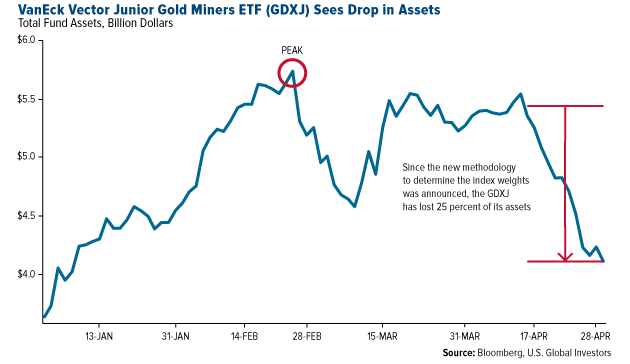
GDXJ Sees Drop in Assets

The sell-off has already begun, and it’s due to no fundamental reason at all—it is a “forced selling” based on technical issues.

Many junior gold stocks are Canadian. As soon as an entity owns more than 20% of a Canada-listed company, regulations restrict its trading ability and make holding the position a bureaucratic mess.

Because the ETF got so popular and the small-cap miners are truly a tightly knit group of companies that are not collectively worth that much, the ETF couldn’t find ways to deploy cash. As a result, it now has to rebalance its components.

This rebalancing is already underway, with hedge funds, short-selling funds and retail investors all looking for a way to either make a killing due to this selling avalanche or protect their holdings from further declines.

The rebalancing is set for June 16.

Between now and then, expect significant volatility in all the sub-$1 billion market cap junior and mid-tier gold companies. Shares of companies will be sold by the GDXJ so the new ETF can become a “large mid-tier to small major” gold ETF.

The Chain Reaction: Margin of Safety Will Be at All-Time High 

Margin of Safety is the most important term in finance, according to Warren Buffett and his mentor, Benjamin Graham. Essentially, the idea is that no investment—and certainly no trade—are bulletproof, therefore the cheaper you can buy it, the better. 

It goes deeper than that: a more effective use of Margin of Safety is contrarianism.

This means that you’re buying when assets are out of favor (and therefore cheap), with the certainty that demand will be increasing later.

But the most effective use of Margin of Safety is buying so cheap that the company actually trades at or below its liquidation value.

The GDXJ is going to dump close to $4 billion worth of junior mining shares—that’s a massive amount.

We all know how the market reinforces our most innate emotions, and as this forced regulatory selling commences, panic selling will ensue.

Gold stock investors will hit stop losses and dump shares, which will create more selling.

What may be in the cards here is a self-reinforcing cycle of forced, ignorant selling that will feed on itself and cause a panic in some of the world’s best small-cap gold stocks. It could be a chain reaction, and again, this is coming on June 16, right when the Federal Reserve next announces an interest rate decision.

Wealth Research Group’s Strategy
We follow a proprietary due-diligence process in order to sift through the hundreds of publicly traded companies.

We are currently reviewing all the companies that the GDXJ will be forced to sell. I can already tell you that I have personally taken profits on a number of dividend-paying stocks and liquidated a real estate holding in order to be cashed-up. 

The reason I did this is because at the bottom, after some companies’ stock prices basically go back in time to levels lower than 2015’s historical lows, guys like my partners and I—or funds like Marin Katusa’s, or Sprott Asset Management and Peter Schiff’s Euro Pacific—and other legendary investors in the space will be making our most aggressive move yet.

Gold is not in a bubble, nor has it displayed any “bubble-like” golf stick-shaped chart.

Instead, it’s a highly depressed market where demand is high, but concentrated short positions by large funds who are long the S&P 500 are absolutely creating havoc for the retail investor. As I said last week, once the entire investment community begins taking profits after a nine-year bull market, the over-leveraged short positions they currently hold in mining shares will be liquidated, and you will most likely be among the rare breed of investors that get to experience a 100-fold move in a stock you own.

At the moment, a total of 52 companies are estimated to be under excessive liquidation by the GDXJ, and we’re preparing for this as we speak.

You need to make a decision—one that will define you regarding gold stocks from here on out. You need to be absolutely sure that you can stomach high volatility, which will test every fiber of your being, because buying when Margin of Safety is at an all-time high is not as easy as it sounds. It requires nerves of steel, and most of all, it entails forgetting all about the pain you endured (if you endured any) by mismanaging positions in the past or getting the timing wrong.

There’s no escaping this—it will get bloody before we get our chance to create dynasty money.

Now is the absolute ideal time to learn exactly how industry insiders are finding the best values.

Lior Gantz, an editor of Wealth Research Group, has built and runs numerous successful businesses and has traveled to over 30 countries in the past decade in pursuit of thrills and opportunities, gaining valuable knowledge and experience. He is an advocate of meticulous risk management, balanced asset allocation and proper position sizing. As a deep-value investor, Gantz loves researching businesses that are off the radar and completely unknown to most financial publications.

Related Articles


Want to read more Gold Report articles like this? Sign up for our free e-newsletter, and you’ll learn when new articles have been published. To see a list of recent articles and interviews with industry analysts and commentators, visit our Streetwise Interviews page.

Disclosures:
1) Statements and opinions expressed are the opinions of Lior Gantz and not of Streetwise Reports or its officers. Lior Gantz is wholly responsible for the validity of the statements. Streetwise Reports was not involved in the content preparation. Lior Gantz was not paid by Streetwise Reports LLC for this article. Streetwise Reports was not paid by the author to publish or syndicate this article. 
2) This article does not constitute investment advice. Each reader is encouraged to consult with his or her individual financial professional and any action a reader takes as a result of information presented here is his or her own responsibility. By opening this page, each reader accepts and agrees to Streetwise Reports’ terms of use and full legal disclaimer. This article is not a solicitation for investment. Streetwise Reports does not render general or specific investment advice and the information on Streetwise Reports should not be considered a recommendation to buy or sell any security. Streetwise Reports does not endorse or recommend the business, products, services or securities of any company mentioned on Streetwise Reports.

Charts provided by Wealth Research Group


Technically Speaking: Breakout Or Fakeout

SP500-3000-Or-1500-050817

In this past weekend’s newsletter, I discussed the relatively “weak” breakout of the market to new record highs. To wit:

“Over the last few weeks, I have been discussing the ongoing consolidation process for the S&P 500 from the March highs. (For a review read: “Oversold Bounce Or Return Of The Bull,” and “Return Of The Bull…For Now.”) As the expected rally in stocks, and reversal in bonds, took shape as the S&P 500 was finally able to ratchet a record close at 2399.29. (Read: 10/2016 – “2400 Or Bust”)

SP500-Chart9-050517


Larger Chart

“With the market on a short-term ‘buy signal,’ deference should be given to the probability of a further market advance heading into May. With earnings season in full swing, there is a very likely probability that stocks can sustain their bullish bias for now.

The market did do exactly that this past week, and while hitting a new high, as noted above, it was a ‘weak’ breakout as volume contracted.”

The question for the bulls, of course, is whether the current “breakout” is sustainable, or, is it a “fakeout” that reverses back into the previous trading range? As Steve Reitmeister from Zack’s Research suggested on Monday:

“I would say it all depends on investor confidence that tax breaks are on the way.”

It all hangs on just one issue.

……read more HERE

Shifting World Economies Present Massive Opportunities for Investors

Recent news from the World Economic Forum (weforum.org) has outlined recent core global economic functions and relationships.  We found this interesting in both factual data and interpreted data and we wanted to present our analysis to you, our valued members.

The factual data presented by the World Economic Forum is clearly showing that China’s growth as an emerging, diversified economy is already displacing some other emerging economies (India, Brazil, Italy, France and Canada). When we consider the maturity of these economies as well as their total output (see the infographic below), we begin to understand the mature global economies are likely saddled with more debt as multiple global economic crisis events have transpired since 2000. The graphic below clearly illustrates that many North American and European countries have gone further into debt since the initial Dot Com bubble event took place near the turn of the century (2000).

Gross Debt Ratio 2000 – 2013

picf32bec0fdbc7bdd43aadcdaeaf8ba857

Interestingly, many of the countries that have acquired so much new debt since 2000 are also the worlds largest economies and, therefore, are much more capable of experiencing continued economic growth cycles to address and pay down these debt expansions.

 Largest Economies 2017

World's Biggest Economies

It is our opinion that the expansion of debt across the globe since the year 2000 will find a means to propel economic growth in many of these most mature markets vs. transition to younger emerging markets with higher risks. Our opinion is based on two primary factors; longer-term economic growth and contraction cycles and the understanding that capital always attempts to move towards the safest net positive return venues at times of uncertainty. Although we believe certain opportunities will continue to exist in younger emerging markets, we believe these opportunities should be viewed as much shorter term rotational plays in global markets that may present a higher risk opportunity for valuation or price rotation. We strongly believe the major growth opportunities will continue to be present in the more mature and economically diverse economies that continue to drive global growth and propel many of the emerging markets opportunities.

Recently, many people have been talking about the US GDP growth predictions and if the US growth will ever get back to near 3%. The word “luck” seems to pop up in regards to reaching this level ever again. We disagree with the concept that “luck” has anything to do with this level being reached in the near future. We believe the longer-term economic cycles will begin to play a more tangible role in all global economies over the next 3~7 years. We also believe these cycles will present major headwinds for certain emerging markets that may equate to contagion type crisis events for many.

We believe these emerging market crisis events will drive investment capital away from many of these debt laden emerging markets as these events unfold and push capital investment into stronger, more stable, mature economies.  This dramatic shift of capital deployment will further strengthen these established global economies and allow they to experience economic growth on a scale that has not been seen since the 1950s~1980s.

Global Economy 101

Global Economy

Many people fail to realize the world has experienced at least 7 of these major cycle events in recent history (from the 15th century till now). Empires have fallen. Emerging markets have collapsed. Dynamics and wealth shift dramatically in the midst of these major cycle events and many times the strongest and most capable empires are the one that are able to restructure, rebuild and thrive.

When we consider this list of the top 20 countries with the highest debt to GDP ratio, we see that nearly 80% of them are what we would consider “fledgeling economies”. Debt for these countries is a method of attempting to launch themselves onto the global playing field and a process of the easy money policies of the last 20+ years. The newer European Union and BRICs hype of the late 1990s and early 2000s likely drove many of these countries to have larger and larger debt requirements in an attempt to compete on a larger global level. Now, as we believe this major cycle event will begin to play out over the next few years, we believe the opportunity for investors will be to chase the rotation of capital around the globe as it attempts to find safe and stable growth opportunities.

20 countries with highest debt to GDP ratios

20 countries with highest debt to GDP ratios

We believe the opportunities for strategic investors will be seen and experienced in global ETFs, major global Indexes, precious metals and currencies. We believe the opportunities for massive moves are just starting and key elements of the proposed global capital migration will begin to become noticeable over the next 6 to 18 months. If you wish to continue receiving our updates and detailed trading signals, please visit ActiveTradingPartners.com or TheGoldAndOilGuy.com.  We keep our clients up to date with the highest levels of forward looking market analysis and trading opportunities. We welcome you to become a member and begin profiting from our shared experience.

In closing, take a look at these sample Emerging market charts. Notice the multi-year downward sloping peaks correlating with global QE events. Notice how massive price rotation (30~60%) events happened when QE events ended or when these economies were left to operate without outside impetus? Now, imagine the price rotation that may occur with a major, “generational”, event cycle playing out? Where do you think all that capital will run to for deployment and safety?

GMM Emerging Markets Weekly Flag

GMM Emerging Markets Weekly Flag

EET Ultra Emerging Markets Weekly Flag

EET Ultra Emerging Markets Weekly Flag

There are many new and exciting positions to be entered this month and we just added another two this week each with the potential for over 30% profit upon MRM breakout pattern.


Visit www.ActiveTradingPartners.com today to learn more.

The Top 3 Articles of the Week

free1. What Happened To Common Sense

A recent poll says a majority of Canadians don’t think Free Trade has benefited Canada. The numbers are compelling, access to 360 million US citizens, 131 million Mexicans in exchange for access to 35 million Canadians!

….read it all HERE

2. Know When To Hold Your Winners

Jesse Livermore, the tenacious trader immortalized in the 1923 investment classic Reminiscences of a Stock Operator, warned about pundits. He hated tips and claimed following them had lost him hundreds of thousands of dollars.

….read it all HERE

2. Gold Stock Cherry Picking Season

Gold and silver currently have a bit of a fundamentally and technically oriented “hangover”.

….read it all HERE