
Timing & trends
The past few weeks have been rough for precious metals. Gold had climbed all the way to $1297/oz but the other parts of the sector (Silver and the gold stocks) failed to confirm the move. They have since fallen off a cliff. Over the past 14 days, GDX has lost 15% while GDXJ has declined 20%. Silver during that span has declined every day. Yes, Silver has declined 14 consecutive days. Gold still has some “catching down” to do (with the rest of the sector) but the gold stocks and Silver are oversold and nearing a bounce.
We plot the daily bar charts of our in-house junior gold index and GDXJ below along with GDX. The junior sector has been hit especially hard partly due to news that GDXJ, because of massive inflows will be cutting its stake in various juniors and investing in larger companies. Regardless of the why, the charts are the charts and much damage has been done. However, both junior indices have a bit more downside potential before testing strong support. GDX has good support roughly 4% below Thursday’s close.

Silver, as we noted, is down 14 consecutive trading days and nearly 13% over that period. This week Silver has lost 5.6% and sliced below key long-term averages. While the broader trend is lower, Silver is very close to testing strong short-term support from $15.90 to $16.13. That is another 1%-2% lower for Silver, which could then face resistance from $16.90 to $17.20.

Overall, both the gold stocks and Silver are oversold and nearing a bounce. We say nearing because another day or two of selling is possible before a bounce. Gold meanwhile, has key support at $1220/oz but the gold stocks have already priced in sub $1200/oz Gold. Although the gold stocks are setup to bounce this month and we see a few opportunities, we expect another opportunity and a better one in the middle of summer.

 Question: Martin You said the turning point will be on monday 8th may. Could it be in connection with the result of the french election on may 7th? If it isMacron, the turning point will be up. If it is Le Pen, it will be down. Or?
ANSWER: The French media is portraying Macron as a centrist. It is expected that Macron should be able to attract a wider spectrum of second-round voters than Le Pen, pulling in left-leaning voters from Hamon and Mélenchon as well as those leaning to the right that voted Fillon in the first round. The polls put him at 65%.
Our computer projected that the “populist” vote would win. Indeed, for the first time in modern French history, the runoff vote will not feature a single presidential candidate from a mainstream party. The Conservative and Socialists all lost.
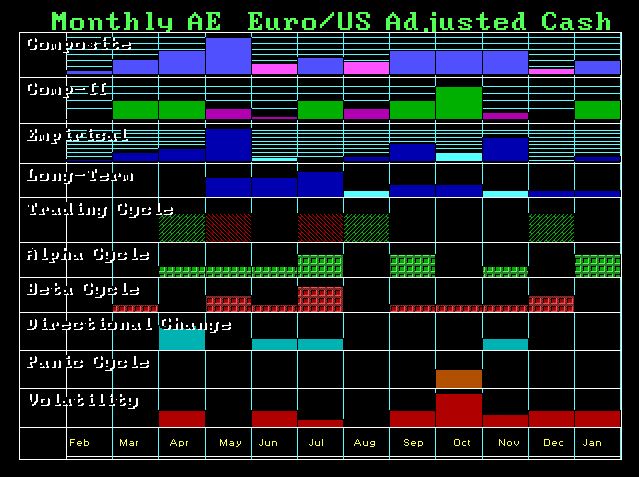
The elite want Macron to win but this will be the nail in the coffin for the EU. Brussels will assume they defeated the “populist” simply if Le Pen loses. However, the mainstream parties all lost already. Macron will simply mean that Brussels will not reform and that suggests that we are looking at the collapse of the Euro moving forward into 2018. Our Yearly models have had three Directional Changes 2017 into 2019. Our Monthly Models have been targeting May 2017 for about one year.
A Macron victory should help the Euro hold for now. The key resistance stands in the 113-114 zone. The press will try to manipulate the people to save the EU. That is the agenda of the press in Europe, so they will cheer Macron and do their best to destroy Le Pen and in doing so, they are condemning the EU to utter failure. All they can see is keep the EU together even if that leads to internal civil war within Europe. The only thing holding the EU together is France and Germany.
….also from Martin:
How Small Events Can Cascade into Contagions
&

 While there’s been plenty of focus on apps and cloud computing in the technology space, advances are also being made in hardware-focused sectors such as nanotechnology. Uses include everything from more efficient drug delivery systems to tiny transistors that allow for smaller and more powerful computer chips.
To be sure, the markets for nanotechnology products and nanotechnology uses are set to grow in the coming years. A report released this past December from Research and Markets states that nanotechnology “is a rapidly growing technology” and the global industry has been forecast to grow annually by 17 percent up to 2024.
Similarly, BCC Research has said that the global nanotechnology market was valued at $39.2 billion in 2016 and should grow at a CAGR of 18.2 percent, in order that the market will reach a believed $90.5 billion by 2021.
Still, for investors just starting to look at nanotechnology stocks, it can be difficult to know where to to begin, as nanotechnology uses are so varied. As a starting point, here’s an overview of six of the top areas in which nanotechnology uses are making a big difference today.
Materials and coatings
Market Summary
The stock market is on track to rise by more than 5% during the first 100 days of the Trump presidency, outperforming Ronald Reagan’s 1% loss and Barack Obama’s 2.8% gain, as reported by CNBC. The benchmark Standard & Poor’s 500 Index (S&P 500) has climbed roughly 5.2% from January 20 through April 25, according to Google Finance. “Trump is the second-best Republican and third-best President since World War Two,” said Sam Stovall, describing the S&P 500’s performance under our latest president during an interview with Investopedia. “He can boast that his 100-day performance exceeded that of Ronald Reagan, his role model,” added Stovall.
Last week, the benchmark S&P 500 index advanced 1.5% and ended April .9% higher. The blue-chip DOW Jones Industrial Average gained 1.9% last week and 1.3% over the month. The tech-heavy Nasdaq Composite Index logged a 2.3% weekly and monthly gain. The smaller cap Russell 2000 and MidCap 400 indexes are up for the week 1.49% and .88% respectively. Note that the Nasdaq has taken over as the leading asset class which seem to confirm the overall markets current bullish move.

A standard chart that we use to help confirm the overall market trend is the Momentum Factor ETF (MTUM) chart. Momentum Factor ETF is an investment that seeks to track the investment results of an index composed of U.S. large- and mid-capitalization stocks exhibiting relatively higher price momentum. This type of momentum fund is considered a reliable proxy for the overall stock market trend. We prefer to use the Heikin-Ashi format to display the Momentum Factor ETF. Heikin-Ashi candlestick charts are designed to filter out volatility in an effort to better capture the true trend. Last week’s comment “…The updated MTUM chart below is at an inflection point. You can see the current bullish trend is starting to pierce through the top of the current six-week trading range. Next week we should find out if the trend continues with a confirmed breakout or if it retrenches and stays range bound…” The updated MTUM chart shows the major stock indices confirming a breaking out above the top of their trading ranges. The next question is whether the MTUM ETF will continue trending higher or will the price stabilize. The ETF has gotten extremely overbought but this situation can continue indefinitely and as you can see there has not been a significant pullback all year. If the current uptrend starts to dissipate the most probable expectation is range-bound trading.

A tool to help confirm the overall market trend is the Bullish Percent Index (BPI). The Bullish Index is a popular market “breadth” indicator used to gauge the internal strength/weakness of the market. Like many of the technical market internal indicators, it is used both to confirm a move in the market and as a non-confirmation and therefore divergence indication. Nasdaq stocks have been leading the market direction for the past year. Last week we noted “…the $BPCOMPQ is beginning a recovery bounce. We are looking to see the index moves above its 200-day moving average at approx. 62 to signal a break higher out its current trading range. There is a lot of overhead resistance, but as mentioned above the Nasdaq has been the market leader and if it breaks out the other major indexes can be expected follow…” This analysis played out as advertised. The Nasdaq index attained all-time highs again this week and finally dragged the other major equity indices higher. 40% of the tech-heavy index is driven by five companies (AAPL, AMZN, FB, GOOG & NFLX). If the Nasdaq keeps surging is should be able to push the other indices through their all-time highs.

The dollar advanced on Friday, finishing with a weekly gain, after official data showed labor costs and U.S. economic growth improved modestly during the first quarter. Treasury yields erased an early gain to end lower on Friday, ending a five-day run of increases. Gold prices climbed on Friday, raising their monthly gain to roughly 1.3%, as weaker-than-expected first-quarter U.S. economic growth weighed on the dollar. Prices, however, ended the week about 1.6% lower as a rise in global equities from last Friday helped to dull safe-haven investment demand for the metal. Treasury bonds ended the week lower after data showed a rise in the Federal Reserve’s inflation measure and weak first-quarter U.S. growth.

Market Outlook
According to Jeff Hirsch in a recent issue of the Almanac Trader, May has been a tricky month over the years, a well-deserved reputation following the May 6, 2010 “flash crash”. It used to be part of what we called the “May/June disaster area.” From 1965 to 1984 the S&P 500 was down during May fifteen out of twenty times. Then from 1985 through 1997 May was the best month, gaining ground every single year (13 straight gains) on the S&P, up 3.3% on average with the DJIA falling once and two NASDAQ losses. In the years since 1997, May’s performance has been erratic; DJIA up nine times in the past nineteen years (three of the years had gains in excess of 4%). NASDAQ suffered five May losses in a row from 1998-2001, down – 11.9% in 2000, followed by ten sizable gains in excess of 2.5% and four losses, the worst of which was 8.3% in 2010. Post-election-year Mays rank at or near the top. May is the top performing NASDAQ and Russell 2000 month in post-election years. The Russell 2000 has been up 9 straight with gains averaging a whopping 4.6%. DJIA and S&P 500 (since 1953) have been nearly as strong, with May ranking 4th and 3rdrespectively. In the 2nd quarter-to-date graph below investors are picking up the pace of trading “risk-on”. Investors are still holding on to gold to hedge against uncertainty, but you can see the Nasdaq index is the leader and the other indices are coming strong.

The CBOE Volatility Index (VIX) is known as the market’s “fear gauge” because it tracks the expected volatility priced into short-term S&P 500 Index options. When stocks stumble, the uptick in volatility and the demand for index put options tends to drive up the price of options premiums and sends the VIX higher. Last week’s analysis said “…The chart below indicates the market is at an inflection point…the Volatility Index pulled back from six-month highs as the S&P 500 recovered higher. If the S&P continues crossing above the VIX line it might indicate the market is headed back to challenge its all-time highs…” The updated chart confirms this analysis played out as advertised. You can see the move followed through with the Volatility index crashing and the S&P 500 on the move back toward all-time highs.

The American Association of Individual Investors (AAII) Sentiment Survey measures the percentage of individual investors who are bullish, bearish, and neutral on the stock market for the next six months; individuals are polled from the ranks of the AAII membership on a weekly basis. The current survey result is for the week ending 04/26/2017. Optimism among individual investors about the short-term direction of stock prices rebounded to its highest level in two months. At the same time, the percentage of investors describing their outlooks as either neutral or pessimistic fell. All three sentiment indicators are now near their historical averages. Bullish sentiment, expectations that stock prices will rise over the next six months, jumped 12.3 percentage points to 38.0%. This is a two-month high. Even with this week’s rise, optimism remains below its historical average of 38.5% for the 14th out of the last 15 weeks. The big jump in optimism follows what had been an unusually low reading last week (25.7%). Furthermore, not only did large-cap and small-cap stocks rise over the past five trading days, the NASDAQ closed above 6,000 for the first time. The recent upward momentum in stocks may have lessened concerns among some individual investors about stock prices dropping in the very short term. Neutral sentiment, expectations that stock prices will stay essentially unchanged over the next six months, fell 5.3 percentage points to 30.2%. The drop puts neutral sentiment below its historical average of 31% for the first time in six weeks. Bearish sentiment, expectations that stock prices will fall over the next six months, fell 7.0 percentage points to 31.7%. Though at a five-week low, pessimism continues to be at or above its historical average of 30.5% for the 11th consecutive week and the 14th out of the last 15 weeks.

The National Association of Active Investment Managers (NAAIM) Exposure Indexrepresents the average exposure to US Equity markets reported by NAAIM members. The blue bars depict a two-week moving average of the NAAIM managers’ responses. As the name indicates, the NAAIM Exposure Index provides insight into the actual adjustments active risk managers have made to client accounts over the past two weeks. The current survey result is for the week ending 04/26/2017. First-quarter NAAIM exposure index averaged 92.85%. Last week the NAAIM exposure index was 70.82 %, and the current week’s exposure is 89.71%. Money Managers have converted back to trading “risk-on” as they increase equity exposure ahead of some of the heavy hitters that are due to start reporting next week. Out of the S&P 500 companies that have reported earnings, 77% have beaten EPS estimates and top-line revenue is out-performing in over 66% of the results. If companies continue beating estimates it is reasonable to the NAAM Exposure Index to return to highs for the year.

Trading Strategy
The ‘Risk-On’ trade is still in favor this week on the back of earnings and the Tax reform anticipation. This is confirmed in the graph below with Cyclicals, Technology and Industrials sectors outperforming over the last month. Recently we mentioned “…the best six months for owning stocks can begin in October or early November and usually lasts until April or early May for DJIA and S&P 500. However, seasonal strength for technology stocks, measured by NASDAQ, tends to last until June…the S&P 500 also demonstrates a tendency to rally from late April until early June. This trade has been profitable 62.9% of the time over the longer-term however; its recent track record has been rough, declining seven times in the last eleven years. Going long the September futures contract on or about April 27 and holding until on or about June 7 has worked 23 times in 35 years. The key to this trade is overall market trend and proper trade management as numerous sizable losses and gains have occurred over trade’s history…”

Kitty Hawk is the “flying car” company that’s financially backed by Google founder Larry Page, and today it has published the first video of its prototype aircraft. The company describes the Kitty Hawk Flyer as an “all-electric aircraft” that is designed to operate over water and doesn’t require a pilot’s license to fly. Kitty Hawk promises people will be able to learn to fly the Flyer “in minutes.” A consumer version will be available by the end of this year, the company says.


-
I know Mike is a very solid investor and respect his opinions very much. So if he says pay attention to this or that - I will.
~ Dale G.
-
I've started managing my own investments so view Michael's site as a one-stop shop from which to get information and perspectives.
~ Dave E.
-
Michael offers easy reading, honest, common sense information that anyone can use in a practical manner.
~ der_al.
-
A sane voice in a scrambled investment world.
~ Ed R.
Inside Edge Pro Contributors

Greg Weldon

Josef Schachter

Tyler Bollhorn

Ryan Irvine

Paul Beattie

Martin Straith

Patrick Ceresna

Mark Leibovit

James Thorne

Victor Adair