
Timing & trends

QUESTION: The bounce in the Euro is a fool’s’ game?
ANSWER: Absolutely. The Euro is doomed because especially if Le Pen loses, Brussels will be relieved and proceed as usual. The same problems will merely exist and no reform will come forward to save the day. A good wind will blow over the European banking system. You are expecting politicians to admit they were wrong and surrender power in Brussels. NOT GOING TO HAPPEN. As Einstein said, you will NEVER solve the problem of the Euro with the same thinking process.
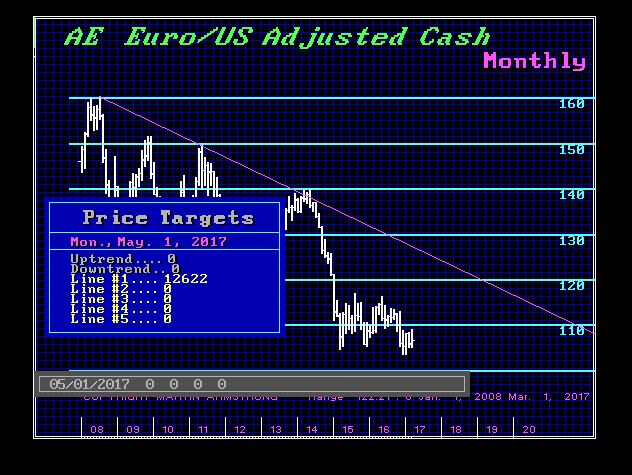
A weekly closing above the 10860 level in the Euro will imply the rally will press higher to test the 112-114 level. Just look at the technical perspective on a monthly level. The Downtrend Line stands in May up at 12622. We are nowhere near reversing the trend in the Euro.
We have the French, British, and then German elections here in 2017. We do not expect total chaos before 2018. That seems to be the point of a major shift.
…also from Martin:
Market Talk – French Election Reaction

Market Summary
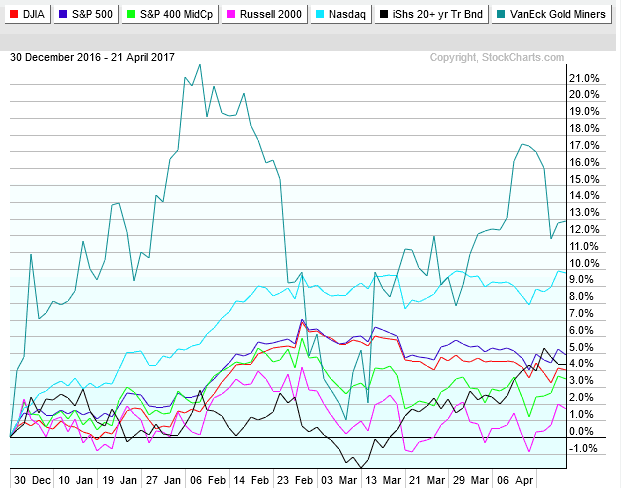
Last week, the benchmark S&P 500 index and the blue-chip DOW Jones Industrial Average advanced .9% and .5% respectively. The tech-heavy Nasdaq Composite Index logged a 1.8% weekly gain. The smaller cap Russell 2000 and MidCap 400 indexes are the biggest gainers ending up 2.57% and 2.18% respectively. In the chart below, gold is the biggest winner for the year as investors are hedging against nervousness about market uncertainty. Note that Nasdaq is edging higher which might signal the next bullish move for the overall market.
A standard chart that we use to help confirm the overall market trend is the Momentum Factor ETF (MTUM) chart. Momentum Factor ETF is an investment that seeks to track the investment results of an index composed of U.S. large- and mid-capitalization stocks exhibiting relatively higher price momentum. This type of momentum fund is considered a reliable proxy for the overall stock market trend. We prefer to use the Heikin-Ashi format to display the Momentum Factor ETF. Heikin-Ashi candlestick charts are designed to filter out volatility in an effort to better capture the true trend. Last week’s comment “…the Momentum Factor ETF remains stuck in an almost two-month long trading range. Eventually there will be a breakout, but the question is will it be an upside or downside break…” The updated MTUM chart below is at an inflection point. You can see the current bullish trend is starting to pierce through the top of the current six-week trading range. Next week we should find out if the trend continues with a confirmed breakout or if it retrenches and stays range bound.

A tool to help confirm the overall market trend is the Bullish Percent Index (BPI). The Bullish Index is a popular market “breadth” indicator used to gauge the internal strength/weakness of the market. Like many of the technical market internal indicators, it is used both to confirm a move in the market and as a non-confirmation and therefore divergence indication. Nasdaq stocks have been leading the market direction for the past year. Last week we noted “…the Nasdaq Composite Bullish Index ($BPCOMPQ) continues to break down, until we get a confirmed recovery bounce the overall stock market will probably continue trending sideways…” As you can see in the updated chart the $BPCOMPQ is beginning a recovery bounce. We are looking to see the index moves above its 200-day moving average at approx. 62 to signal a break higher out its current trading range. There is a lot of overhead resistance, but as mentioned above the Nasdaq has been the market leader and if it breaks out the other major indexes can be expected follow.

The dollar rebounded a bit last week after Treasury Secretary Steven Mnuchin affirmed that there’s bipartisan support for raising the U.S. debt ceiling, and that an extension would likely be approved by the summer. Gold prices climbed Friday, erasing a loss for the week on the back of investor uncertainty ahead of first round of France’s presidential election this weekend. Gold prices have now posted gains for six weeks straight. Treasury prices fell Friday, pushing up yields, as investor appetite for riskier assets was boosted in response to U.S. President Donald Trump’s promise to unveil a tax plan next week, outweighing a flight to safety ahead of the first round of the French presidential election this weekend. Bond prices move in the opposite direction of yields; one basis point is one hundredth of a percentage point.

Market Outlook
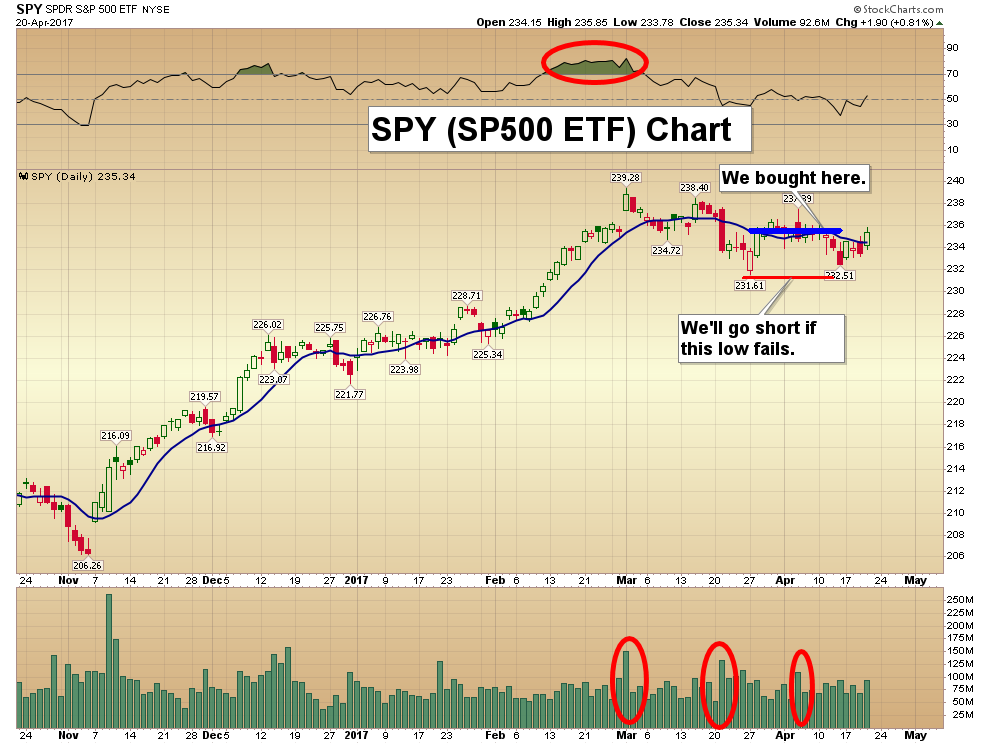
As reported by Sue Chang, Markets Reporter for MarketWatch.com, just when it looked like the stock market was drowning in a sea of worry, President Donald Trump threw it a much-needed life line. Trump on Friday said he will reveal a massive tax package that will deliver cuts “bigger I believe than any tax cut ever.” The president plans to unveil the details on Wednesday, reiterated by a Saturday tweet. Some of the stock market’s sluggishness since the S&P 500 index hit a record on March 1 has been blamed on the absence of meaningful policy change since Trump took office. As a result, any hints that the president is committed to delivering on tax reform and deregulation will help to offset worries about soft economic data, most notably tepid auto and retail sales. But even that may be a boon for stocks as economic weakness could prompt the Federal Reserve to opt for gradual normalization of monetary policy, according to strategists at Yardeni Research. With the much-anticipated tax reform a step closer to reality, investors will be emboldened to return to the market to chase stocks higher. That the corporate-friendly measure comes on the back of an upbeat earnings season will give the market added upside momentum. Analysts are projecting one of the best quarterly earnings in more than five years on the back of a recovery in both the U.S. and global economies. You can see in the chart below how “risk-off” assets like gold, real estate and treasuries have been the stellar performers at the start of the second quarter.

The CBOE Volatility Index (VIX) is known as the market’s “fear gauge” because it tracks the expected volatility priced into short-term S&P 500 Index options. When stocks stumble, the uptick in volatility and the demand for index put options tends to drive up the price of options premiums and sends the VIX higher. The chart below indicates the market is at an inflection point. Last week the Volatility Index pulled back from six-month highs as the S&P 500 recovered higher. If the S&P continues crossing above the VIX line it might indicate the market is headed back to challenge its all-time highs.

The American Association of Individual Investors (AAII) Sentiment Survey measures the percentage of individual investors who are bullish, bearish, and neutral on the stock market for the next six months; individuals are polled from the ranks of the AAII membership on a weekly basis. The current survey result is for the week ending 04/19/2017. Optimism among individual investors about the short-term direction of stock prices is at a new post-election low, according to the latest AAII Sentiment Survey. At the same time, neutral sentiment is at a two-month high and pessimism remains above its historical average. Bullish sentiment, expectations that stock prices will rise over the next six months, fell 3.3 percentage points to 25.7%. Optimism was last lower on November 2, 2016 (23.6%). The drop keeps bullish sentiment below its historical average of 38.5% for the 13th out of the last 14 weeks. This is the third consecutive week with a bullish sentiment reading below 30%. This week’s reading is unusually low, meaning more than one standard deviation below the historical average. (The breakpoint is 28.1 %.) Historically, unusually low levels of optimism have been followed by above-average gains in the stock market. The S&P 500 has realized a median six-month gain of 6.3% over the following six-month periods. Furthermore, the large-cap index has risen nearly 85% of the time following unusually low bullish sentiment readings versus nearly 72% for all six-month periods between September 1987 and November 2016. Neutral sentiment, expectations that stock prices will stay essentially unchanged over the next six months, rose 1.9 percentage points to 35.6%. Neutral sentiment was last higher on February 8, 2017 (36.5%). The rise keeps neutral sentiment above its historical average of 31% for the fifth consecutive week. Bearish sentiment, expectations that stock prices will fall over the next six months, rebounded by 1.3 percentage points to 38.7%. The rise keeps pessimism at or above its historical average of 30.5% for the 10th consecutive week and the 13th out of the last 14 weeks.

The National Association of Active Investment Managers (NAAIM) Exposure Indexrepresents the average exposure to US Equity markets reported by NAAIM members. The blue bars depict a two-week moving average of the NAAIM managers’ responses. As the name indicates, the NAAIM Exposure Index provides insight into the actual adjustments active risk managers have made to client accounts over the past two weeks. The current survey result is for the week ending 04/19/2017. First-quarter NAAIM exposure index averaged 92.85%. Last week the NAAIM exposure index was 86.70 %, and the current week’s exposure is 70.82%. Disappointing quarterly results from some big name companies made investors nervous last week. Instead of increasing equity exposure money managers sold some stocks and traded “risk-off” buying treasury bonds.

Trading Strategy
According to Jeff Hirsch in a recent issue of the Almanac Trader, the best six months for owning stocks can begin in October or early November and usually lasts until April or early May for DJIA and S&P 500. However, seasonal strength for technology stocks, measured by NASDAQ, tends to last until June. Due to its substantial weighting in technology, the S&P 500 also demonstrates a tendency to rally from late April until early June. This trade has been profitable 62.9% of the time over the longer-term however; its recent track record has been rough, declining seven times in the last eleven years. Going long the September futures contract on or about April 27 and holding until on or about June 7 has worked 23 times in 35 years. The key to this trade is overall market trend and proper trade management as numerous sizable losses and gains have occurred over trade’s history.


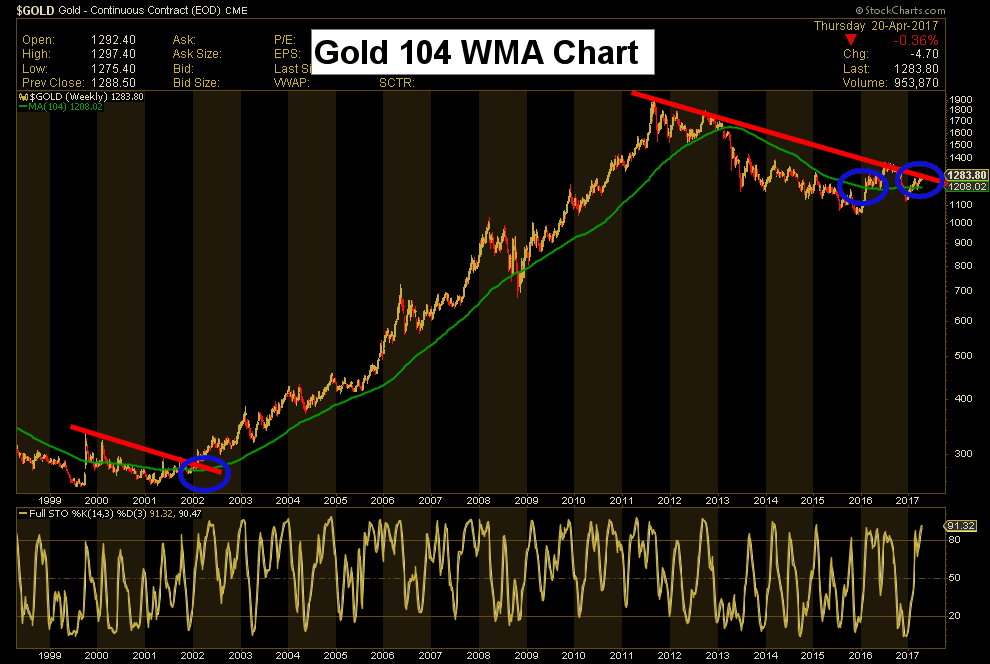
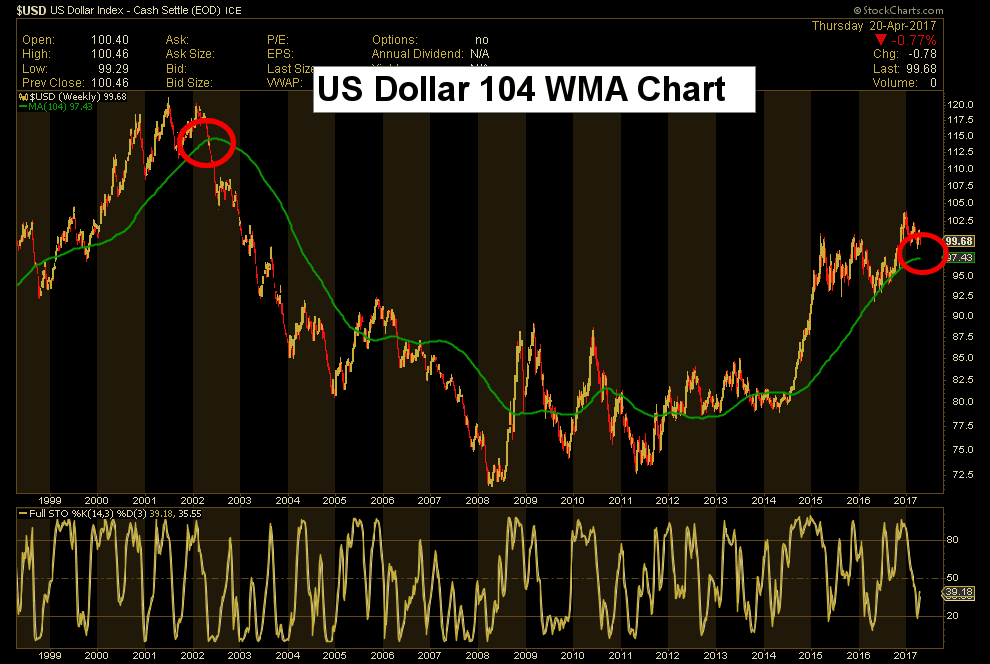
 1. Gold, Dow, & Dollar: The Big Picture
by Morris Hubbart
Big Picture (104 WMA) Charts & Video Analysis, Juniors Key Charts & Video Analysis, Key Charts & Tactics Video Analysis, Trader Time Key Charts Video Analysis
2. Extreme Pessimism indicates market is near inflection point!
by Chris Vermuelan
Big Picture (104 WMA) Charts & Video Analysis, Juniors Key Charts & Video Analysis, Key Charts & Tactics Video Analysis, Trader Time Key Charts Video Analysis
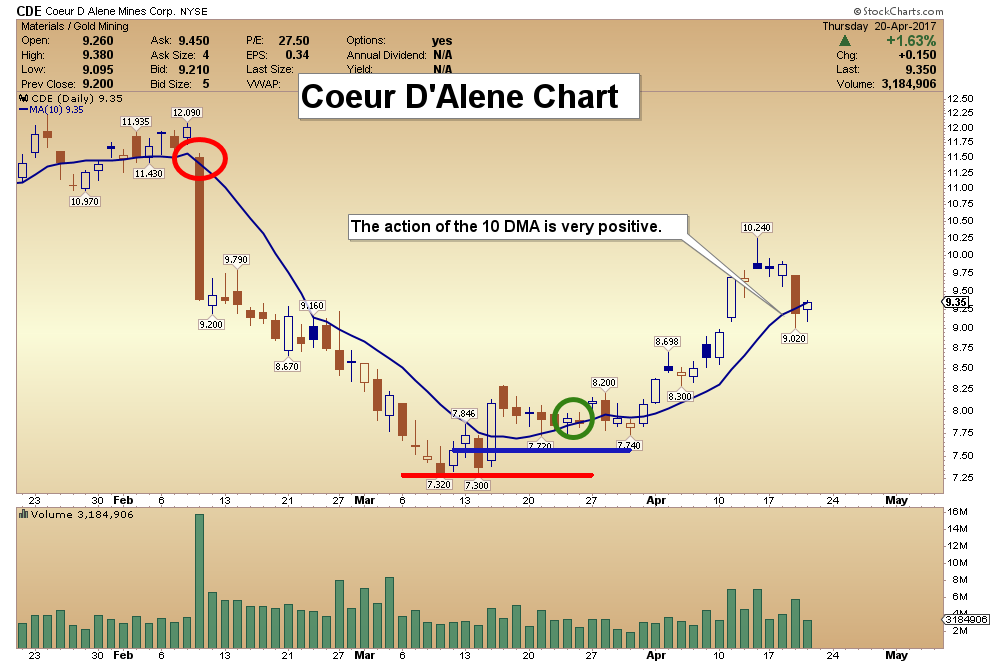
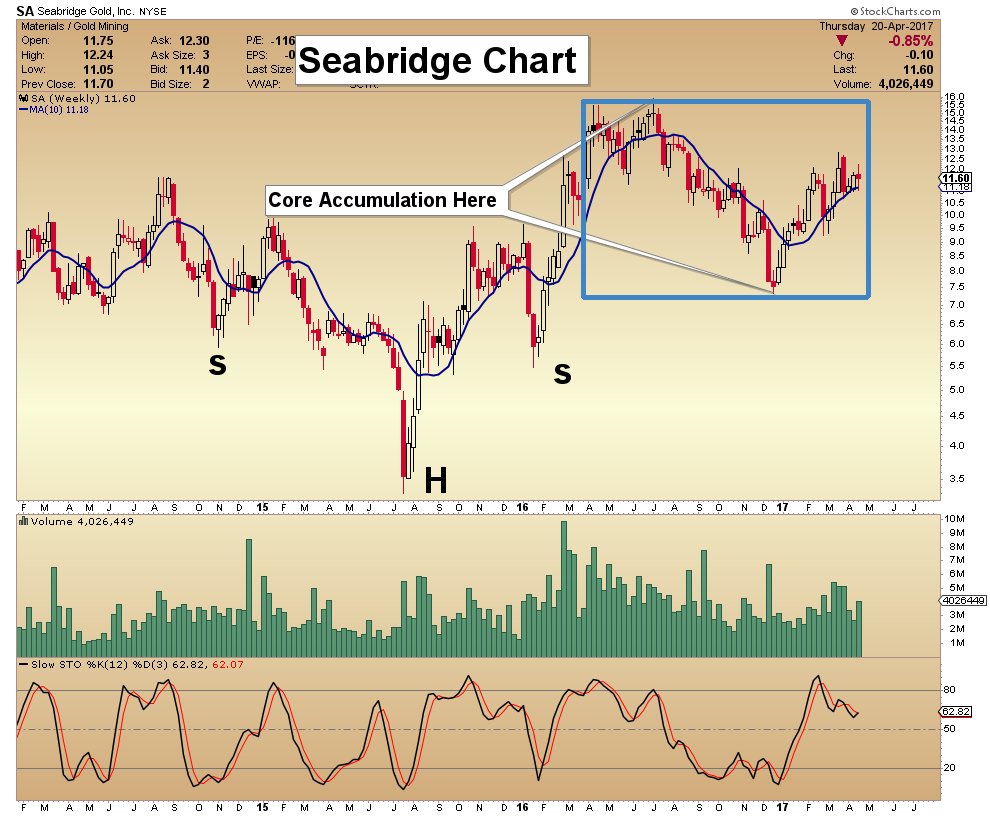
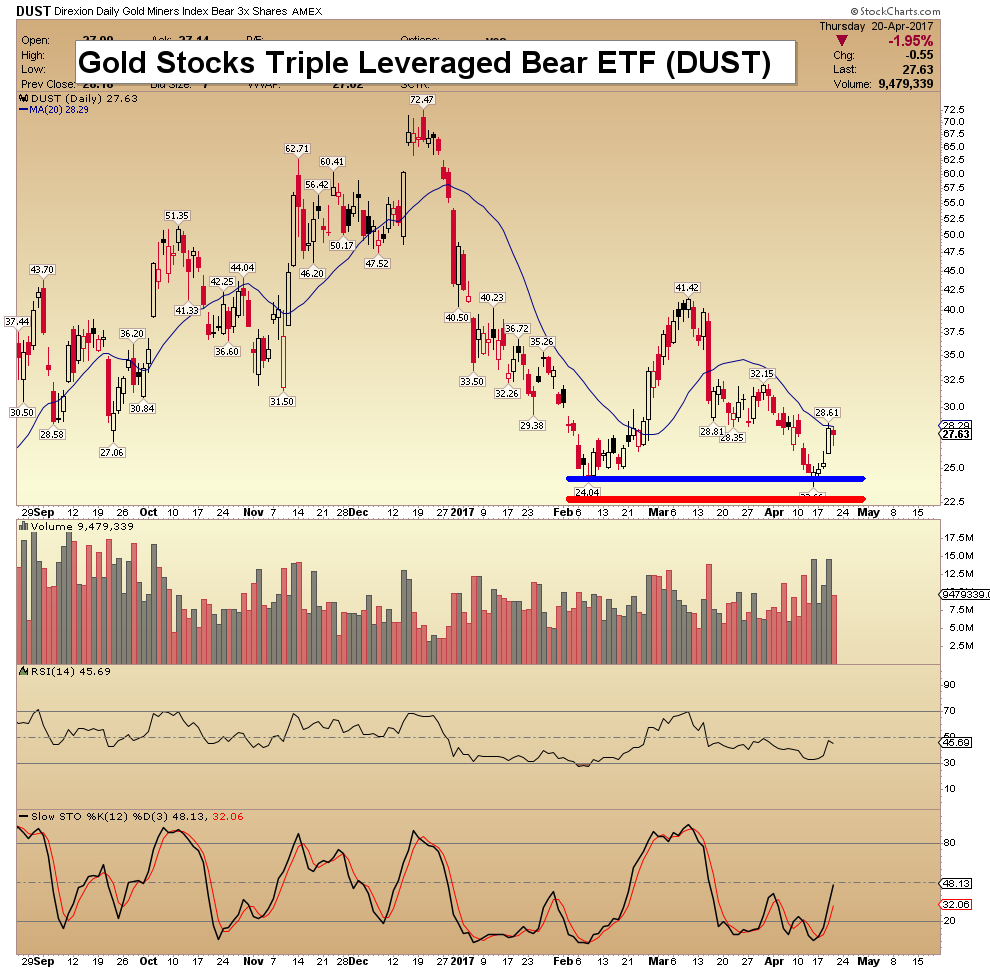
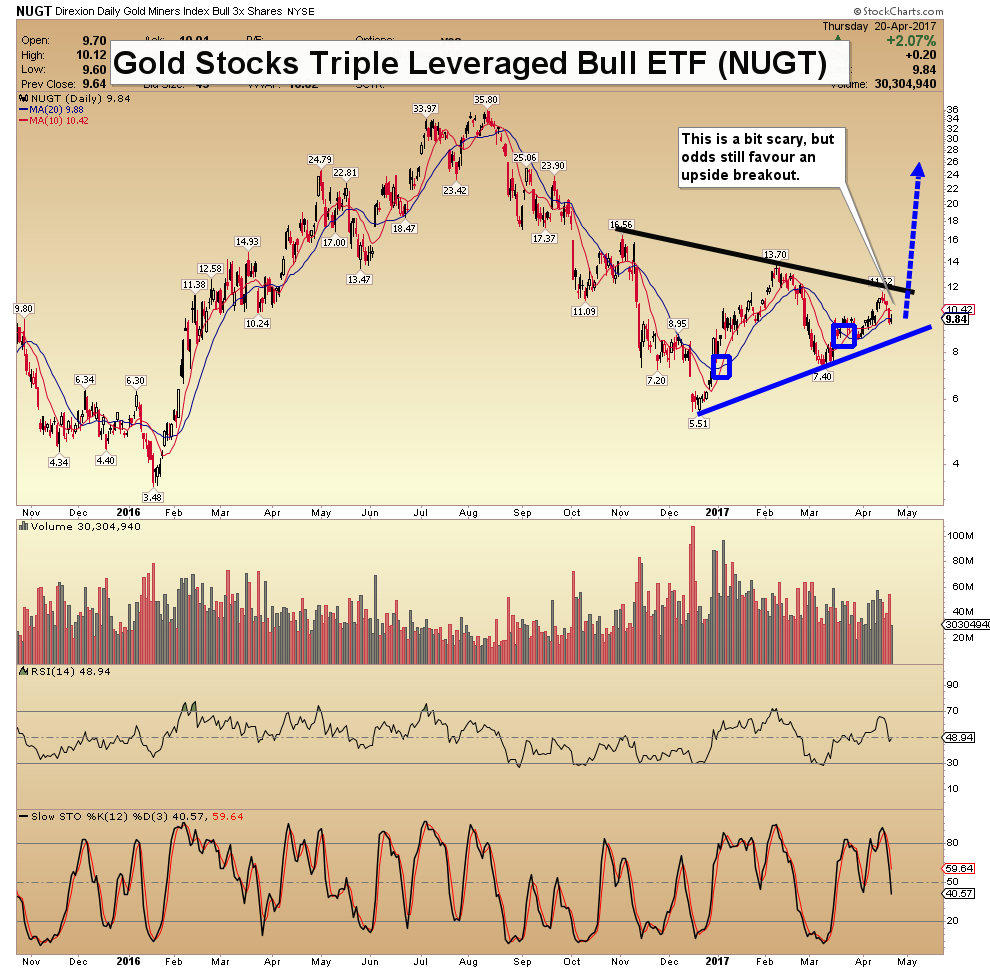
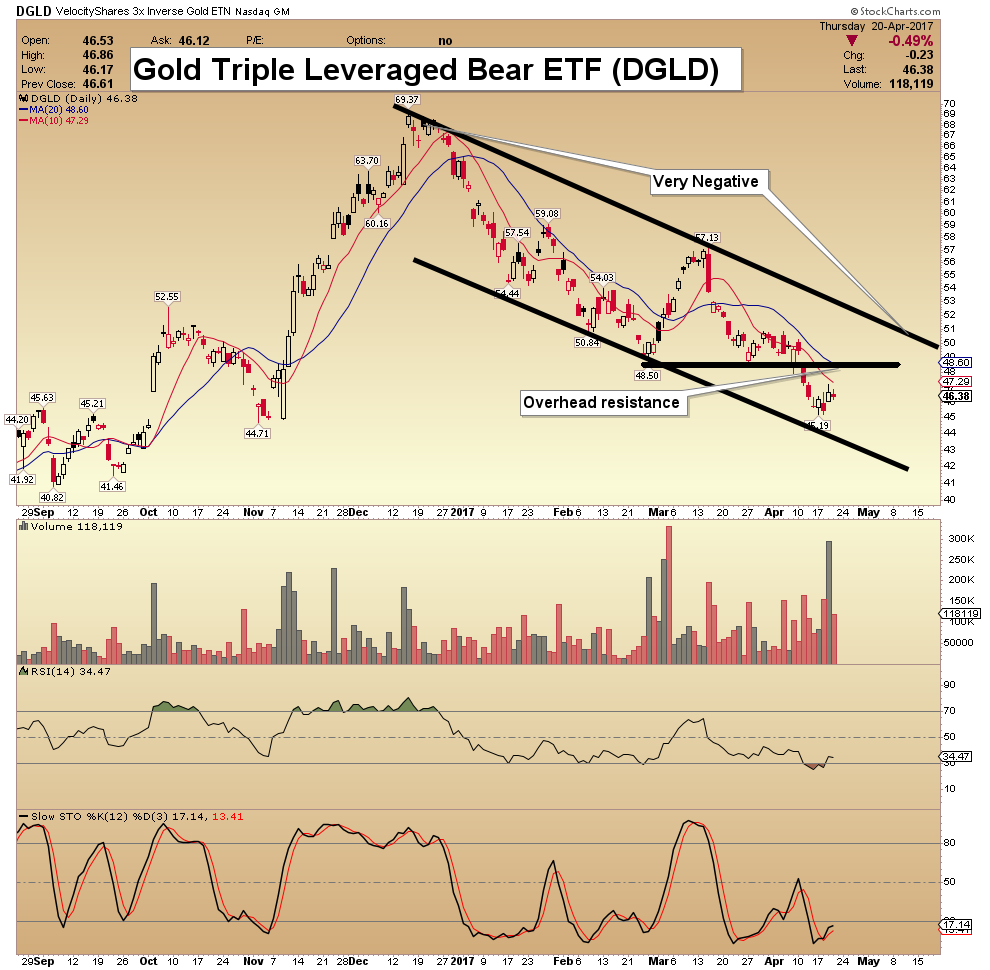
2. An In Depth Look at the Precious Metals Complex
by Rambus Chartology
There is a potential new pattern forming on some of the precious metals stock indexes which is only coming to light today. Before today’s price action there was only a guess of what may be forming with no confirmation. After today’s big gap breakout another piece of the puzzle is falling into place.
Today’s videos and charts (double click to enlarge):
Big Picture (104 WMA) Charts & Video Analysis


SF Juniors Key Charts & Video Analysis


SF60 Key Charts & Tactics Video Analysis


SF Trader Time Key Charts Video Analysis
Morris
The SuperForce Proprietary SURGE index SIGNALS:
25 Surge Index Buy or 25 Surge Index Sell: Solid Power.
50 Surge Index Buy or 50 Surge Index Sell: Stronger Power.
75 Surge Index Buy or 75 Surge Index Sell: Maximum Power.
100 Surge Index Buy or 100 Surge Index Sell: “Over The Top” Power.
Stay alert for our surge signals, sent by email to subscribers, for both the daily charts on Super Force Signals at www.superforcesignals.com and for the 60 minute charts at www.superforce60.com
About Super Force Signals:
Our Surge Index Signals are created thru our proprietary blend of the highest quality technical analysis and many years of successful business building. We are two business owners with excellent synergy. We understand risk and reward. Our subscribers are generally successfully business owners, people like yourself with speculative funds, looking for serious management of your risk and reward in the market.
Frank Johnson: Executive Editor, Macro Risk Manager.
Morris Hubbartt: Chief Market Analyst, Trading Risk Specialist.
website: www.superforcesignals.com
email: trading@superforcesignals.com
email: trading@superforce60.com
SFS Web Services
1170 Bay Street, Suite #143
Toronto, Ontario, M5S 2B4
Canada
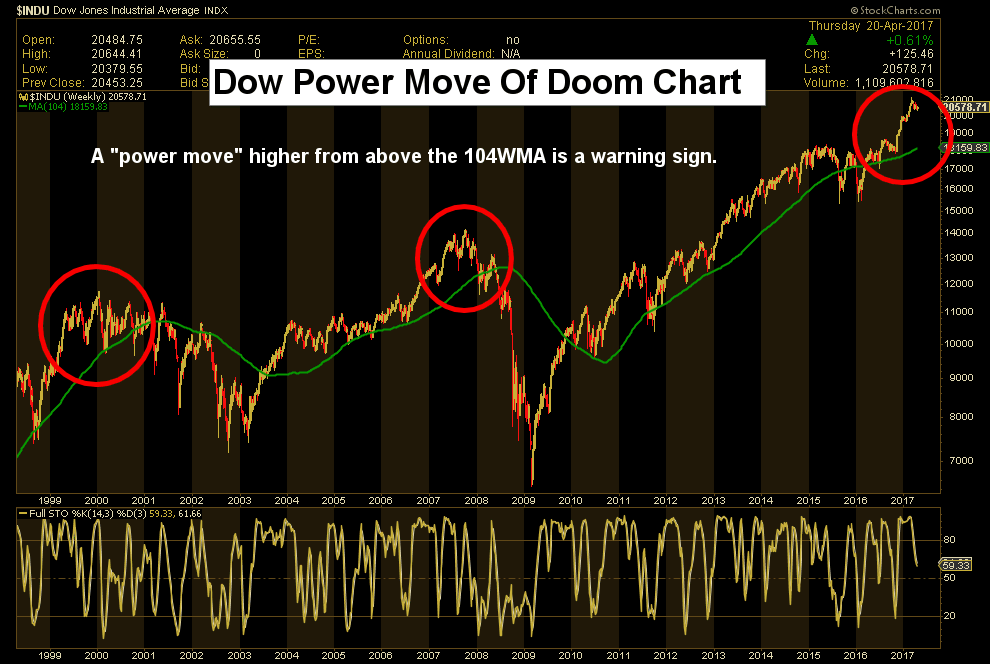
 From Jason Goepfert at SentimenTrader: The Dow has had a big little losing streak. Over the past 30 days, the index has seen 27 days with either a loss or tiny gain. That’s among the worst stretches since 1900, especially when the overall loss is small and it occurs relatively close to a multi-year high. The others usually led to gains over the next several months, and the exceptions’ losses were all small…
…also from King World:

-
I know Mike is a very solid investor and respect his opinions very much. So if he says pay attention to this or that - I will.
~ Dale G.
-
I've started managing my own investments so view Michael's site as a one-stop shop from which to get information and perspectives.
~ Dave E.
-
Michael offers easy reading, honest, common sense information that anyone can use in a practical manner.
~ der_al.
-
A sane voice in a scrambled investment world.
~ Ed R.
Inside Edge Pro Contributors

Greg Weldon

Josef Schachter

Tyler Bollhorn

Ryan Irvine

Paul Beattie

Martin Straith

Patrick Ceresna

Mark Leibovit

James Thorne

Victor Adair